Denison Mines announces $250 million convertible notes offering

Introduction & Market Context
SEI Investments Company (NASDAQ:SEIC) released its first quarter 2025 earnings presentation on April 23, 2025, highlighting strong year-over-year growth across key metrics despite a challenging market environment. The company demonstrated resilience with its assets under management increasing 2% sequentially even as the S&P 500 declined 4.6% during the same period. SEI’s stock closed at $71.90 and remained flat in after-hours trading at $73.00.
Quarterly Performance Highlights
SEI reported robust financial results for Q1 2025, with revenues reaching $551.3 million, a 7.8% increase compared to Q1 2024, though slightly down 1.1% from the previous quarter. Operating income showed impressive growth at $157.1 million, up 24.8% year-over-year and 8.0% quarter-over-quarter. Net income reached $151.5 million, representing a 15.3% increase from the same period last year.
As shown in the following comprehensive financial snapshot:
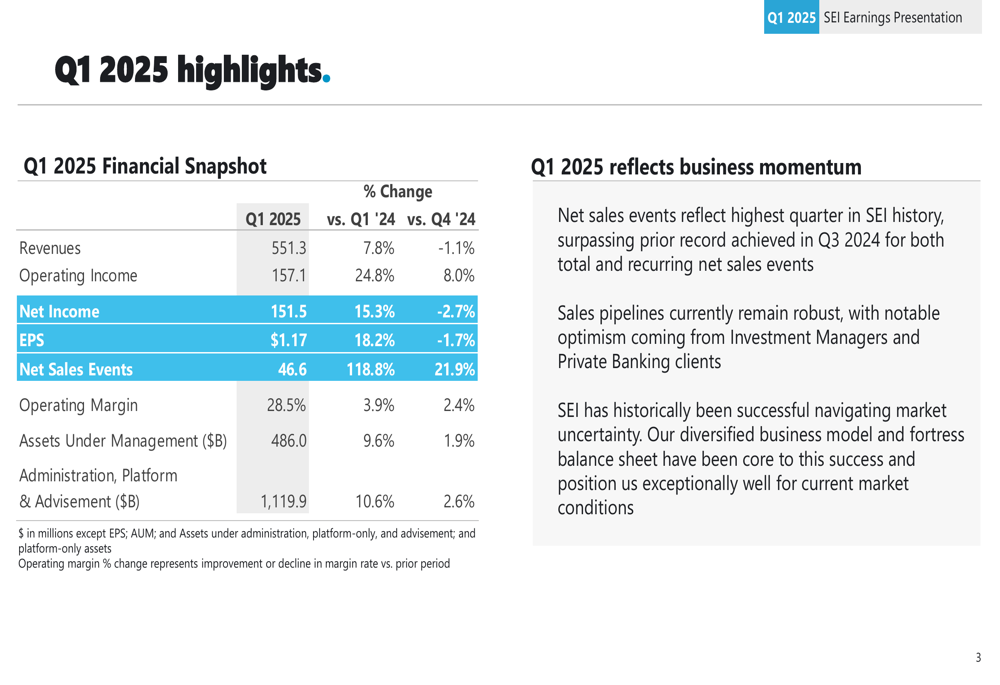
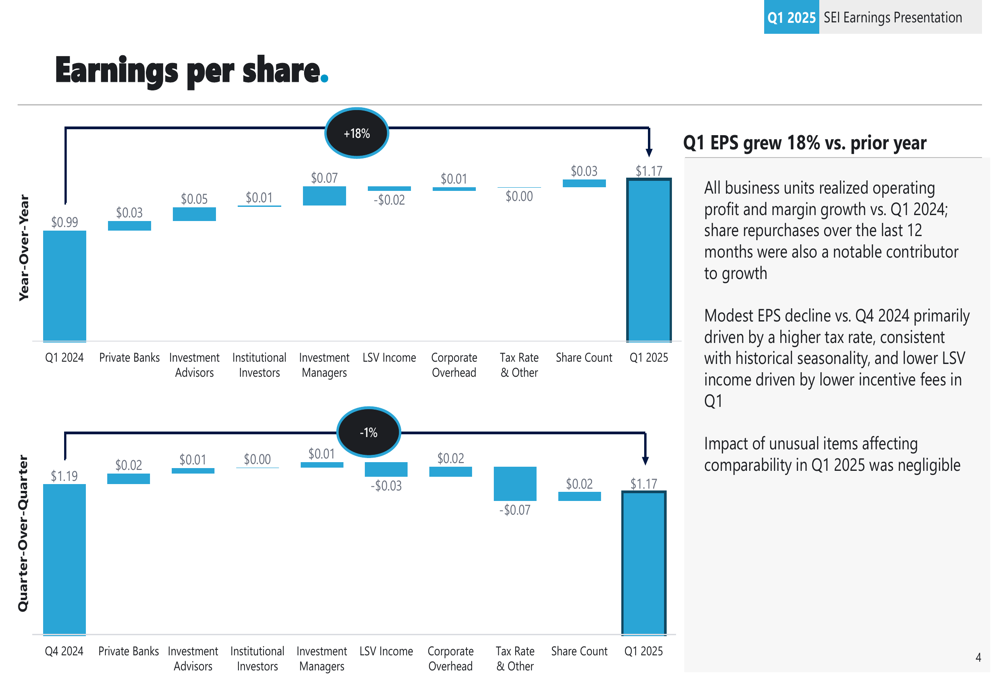
Earnings per share came in at $1.17, an 18.2% increase compared to Q1 2024, though slightly down 1.7% from Q4 2024’s $1.19. The company attributed this sequential decline to a higher tax rate and lower income from its LSV asset management affiliate. All business units contributed to operating profit and margin growth, with the EPS waterfall chart clearly illustrating the drivers of this performance:
Business Segment Analysis
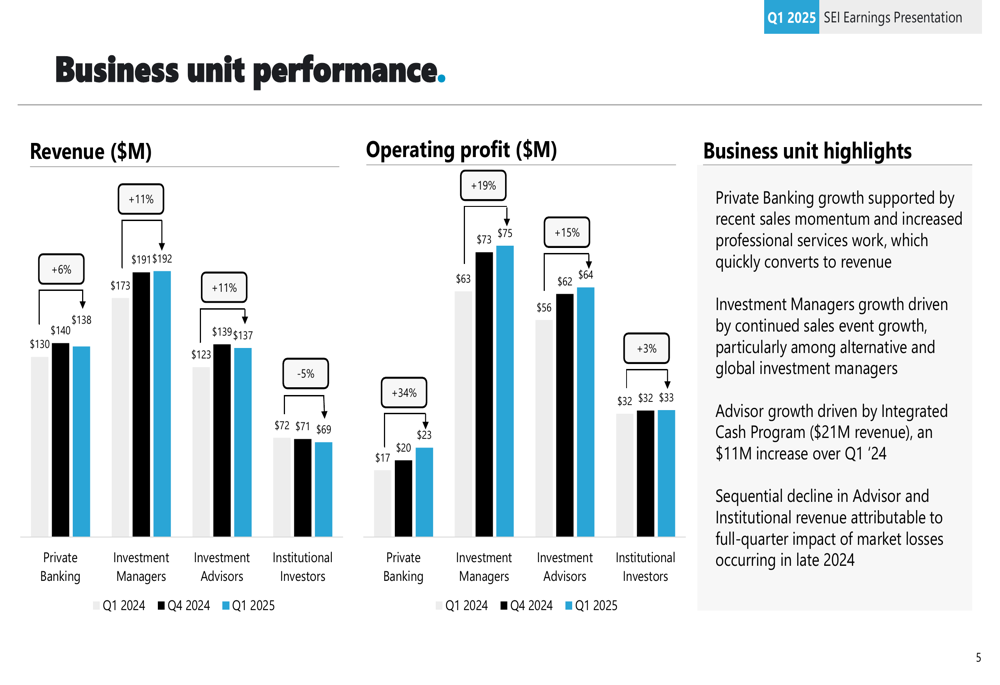
SEI’s business segments showed varied performance, with Investment Managers and Private Banking leading growth while Institutional Investors faced some headwinds. The Investment Managers segment generated $192 million in revenue, an 11% year-over-year increase, driven by strong sales event growth. Private Banking revenue reached $140 million, up 6% from Q1 2024, supported by recent sales and increased professional services.
The Investment Advisors segment also performed well with $137 million in revenue, an 11% increase year-over-year, bolstered by the Integrated Cash Program. However, the Institutional Investors segment saw a 5% decline in revenue compared to the prior year, which the company attributed to market losses occurring in late 2024.
The following chart illustrates the performance across business segments:
Operating Margins and Profitability
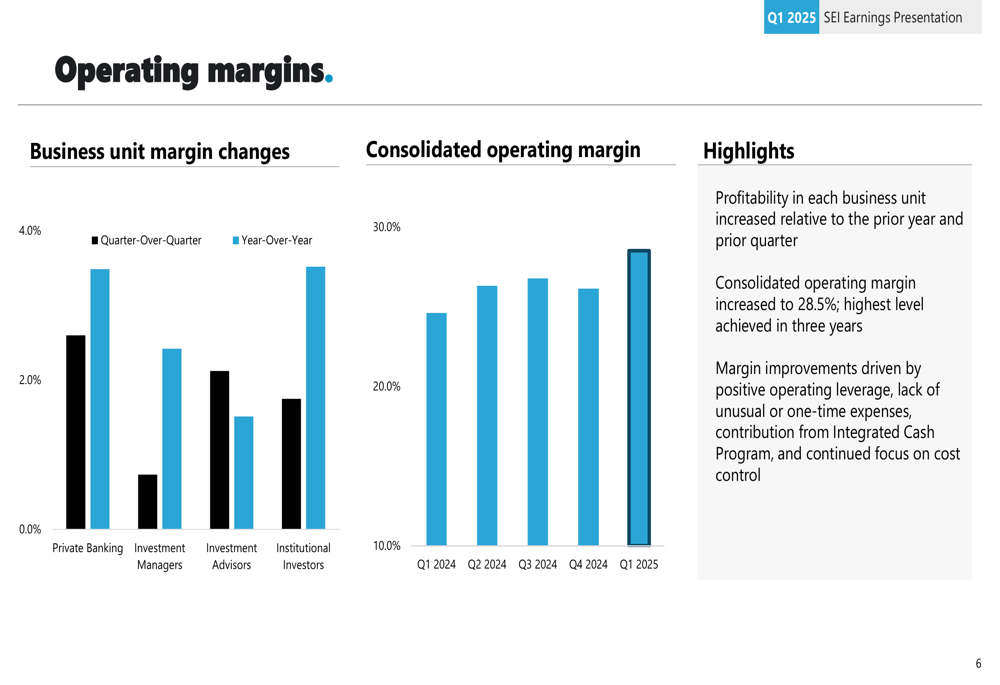
A standout achievement in Q1 2025 was SEI’s consolidated operating margin of 28.5%, representing the highest level achieved in three years. This margin expansion was 3.9 percentage points higher than Q1 2024 and 2.4 percentage points above Q4 2024. The company cited positive operating leverage, absence of one-time expenses, contribution from the Integrated Cash Program, and continued focus on cost control as key drivers for this improvement.
The following chart shows the operating margin trends across business segments:
Sales Growth and Asset Trends
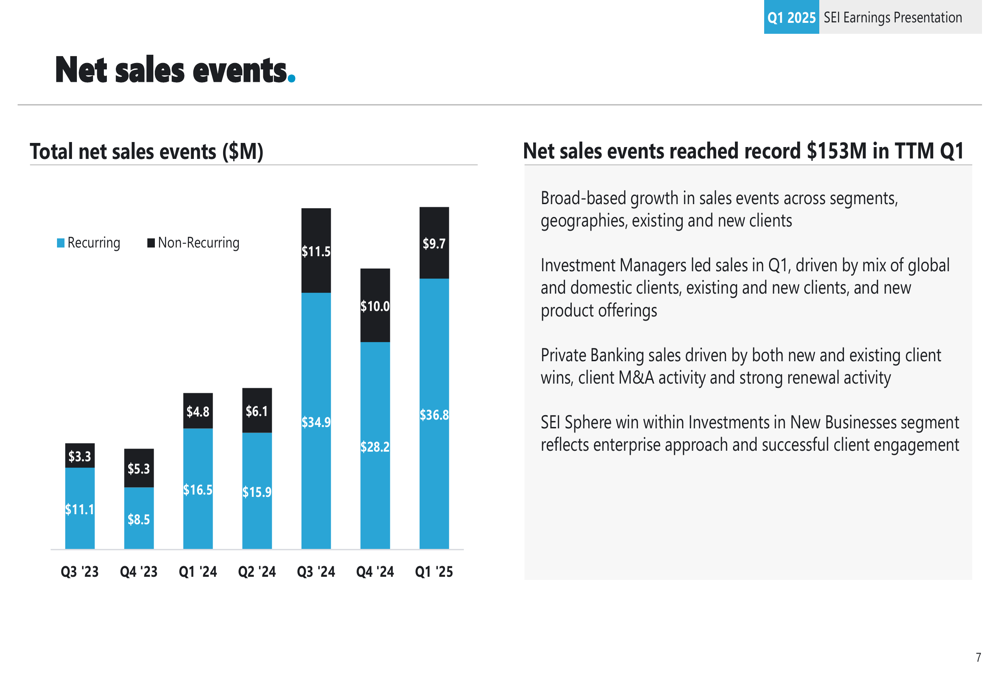
SEI achieved record net sales events of $46.6 million in Q1 2025, representing an impressive 118.8% increase compared to Q1 2024 and a 21.9% improvement over Q4 2024. On a trailing twelve-month basis, net sales events reached $153 million, highlighting the company’s strong sales momentum.
The breakdown of recurring and non-recurring sales events is illustrated in this chart:
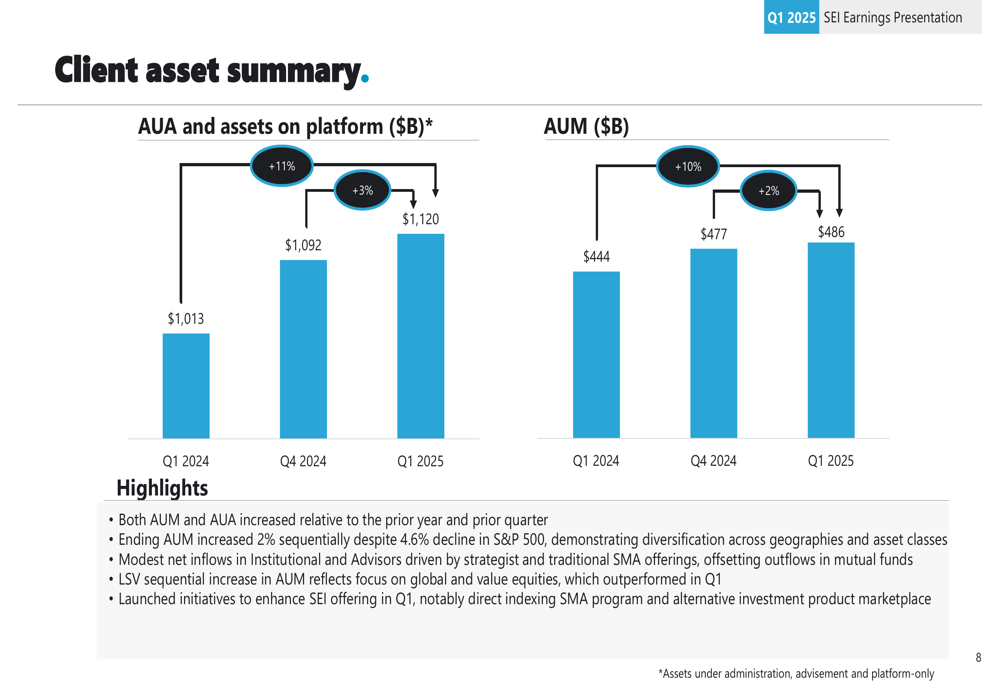
Assets under management reached $486.0 billion, up 9.6% year-over-year and 1.9% quarter-over-quarter. Administration, platform, and advisement assets totaled $1,119.9 billion, representing a 10.6% increase from Q1 2024 and a 2.6% rise from Q4 2024. The company noted modest net inflows in Institutional and Advisors segments, driven by strategist and traditional SMA offerings, which offset outflows in mutual funds.
As shown in the client asset summary:
Capital Allocation Strategy
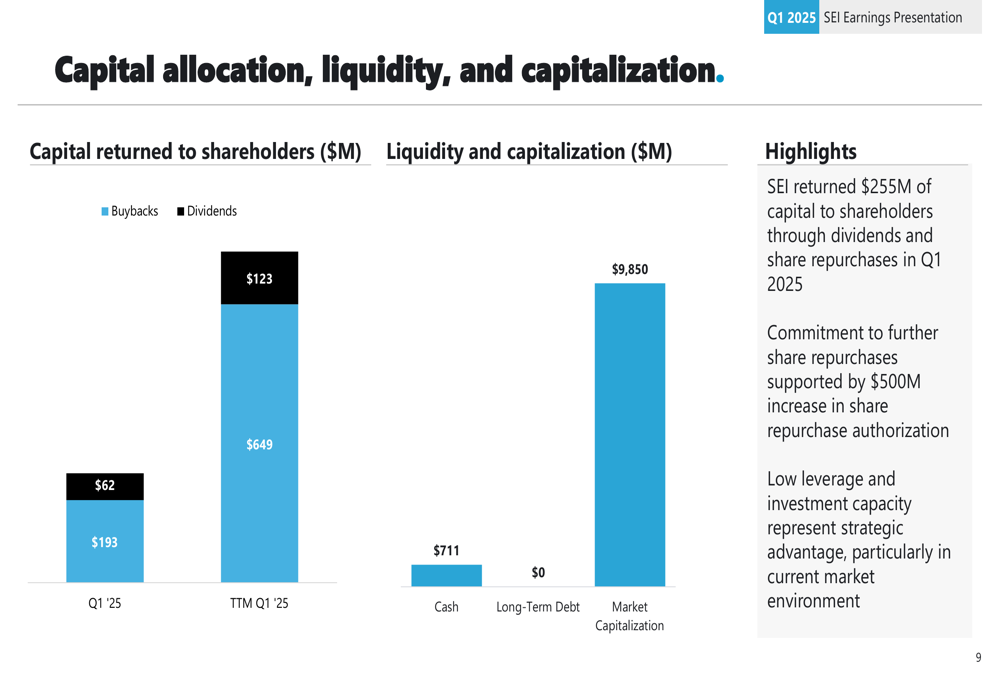
SEI maintained its shareholder-friendly capital allocation strategy in Q1 2025, returning $255 million to shareholders through $193 million in share repurchases and $62 million in dividends. The company’s board authorized a $500 million increase in the share repurchase program, signaling confidence in future performance.
The company’s strong financial position is reflected in its $711 million cash holdings and zero long-term debt, providing significant strategic flexibility. The capital allocation breakdown is illustrated here:
Forward Outlook
Looking ahead, SEI emphasized the strength of its diversified business model in navigating market uncertainty. The company highlighted robust sales pipelines, particularly from Investment Managers and Private Banking clients. New initiatives launched during the quarter include a direct indexing SMA program and an alternative investment product marketplace, aimed at enhancing SEI’s market offerings.
While the presentation did not provide specific forward guidance, the company’s strong Q1 performance, particularly in sales events and operating margins, suggests positive momentum for the remainder of 2025. This represents a continuation of the growth trajectory seen in Q4 2024, when the company reported a 31% year-over-year increase in EPS.
SEI’s ability to grow assets despite market headwinds and its continued investment in new products and services position the company well for sustained growth in an evolving financial services landscape.
Full presentation:
This article was generated with the support of AI and reviewed by an editor. For more information see our T&C.