Asia FX cautious amid US govt shutdown; yen tumbles after Takaichi’s LDP win

Introduction & Market Context
Simon Property Group (NYSE:SPG) released its Q2 2025 supplemental information package on August 4, 2025, revealing stronger-than-expected performance and improved guidance. The retail real estate investment trust’s stock rose 2.83% to close at $160.68, with additional gains of 0.62% in after-hours trading, reflecting positive investor sentiment following the results.
The company’s strong performance follows a mixed Q1 where SPG missed EPS forecasts but exceeded revenue expectations. The Q2 results demonstrate a significant improvement in profitability metrics and continued operational strength across its portfolio of malls, premium outlets, and international properties.
Quarterly Performance Highlights
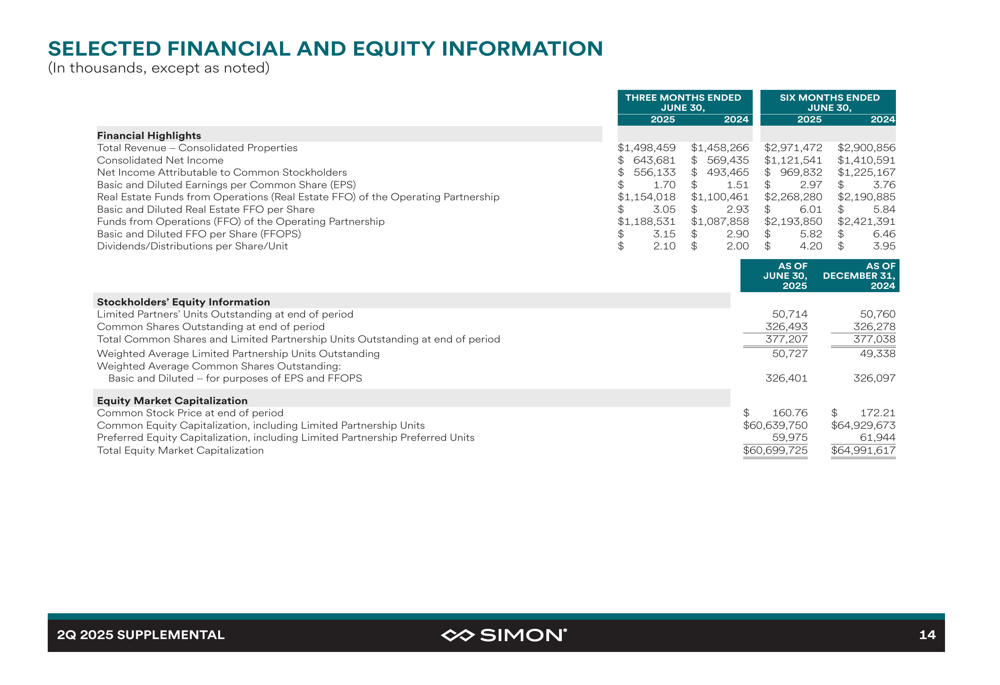
Simon Property reported net income attributable to common stockholders of $556.1 million ($1.70 per diluted share) for Q2 2025, compared to $493.5 million ($1.51 per diluted share) in the same period of 2024, representing a 12.7% year-over-year increase.
The company’s preferred metric, Real Estate Funds From Operations (FFO), reached $1.154 billion ($3.05 per diluted share) compared to $1.100 billion ($2.93 per diluted share) in the prior year, marking a 4.1% increase. Total (EPA:TTEF) FFO was $1.189 billion ($3.15 per diluted share), up from $1.088 billion ($2.90 per diluted share) in Q2 2024.
As shown in the following earnings release highlights:
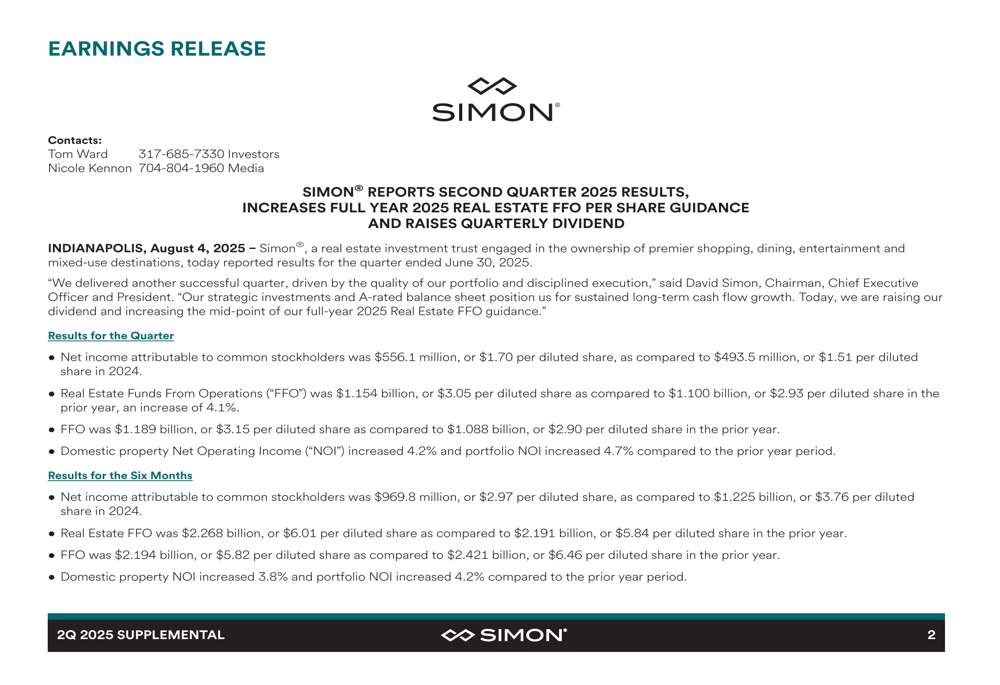
Total revenue for the quarter reached $1.498 billion, compared to $1.458 billion in Q2 2024, while domestic property Net Operating Income (NOI) increased 4.2% and portfolio NOI increased 4.7% compared to the prior year period.
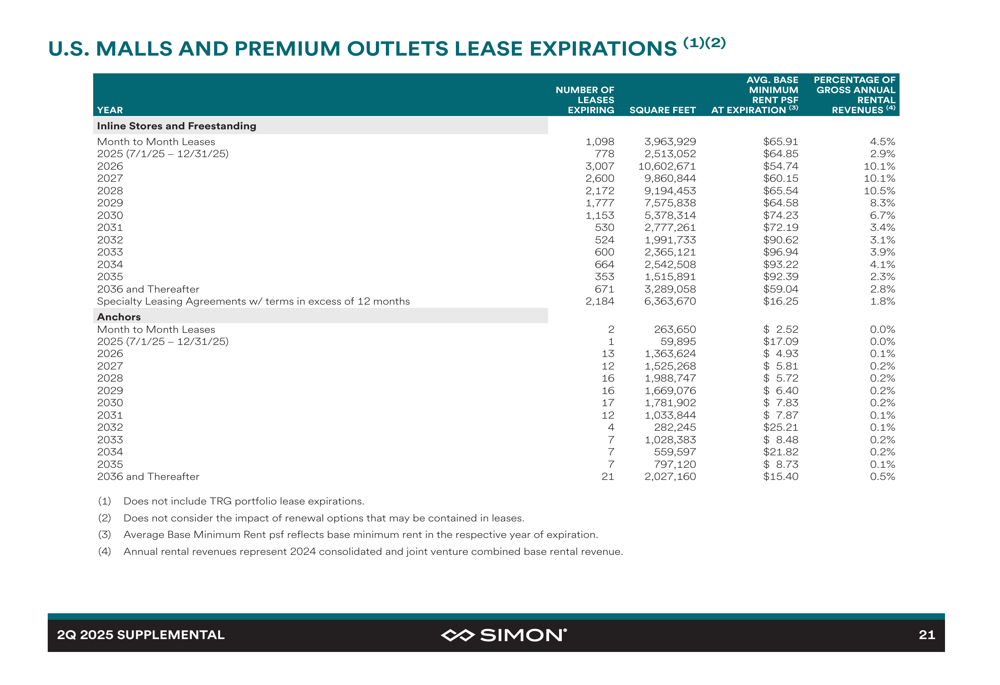
The company’s operational metrics also showed improvement, with occupancy at U.S. malls and premium outlets reaching 96.0% as of June 30, 2025, a 0.4% increase from 95.6% a year earlier. Base minimum rent per square foot grew to $58.70, up 1.3% from $57.94 in the prior year. Retailer sales remained robust at $736 per square foot for the trailing 12 months.
The following consolidated statements of operations provide a comprehensive view of the company’s financial performance:

Portfolio and NOI Analysis
Simon Property Group’s portfolio consists of 232 properties comprising 183 million square feet across North America, Asia, and Europe. The company’s Net Operating Income (NOI) composition reveals a diversified revenue stream with U.S. Malls & Premium Outlets contributing the largest share at 70.8%, followed by The Mills at 11.2%, Taubman Realty Group (TRG) at 8.3%, and International properties at 9.7%.
The geographic distribution of U.S. Portfolio NOI demonstrates Simon’s strategic focus on high-value markets, with Florida (19.2%), California (13.8%), and Texas (10.2%) representing the top three states by contribution:
The company’s tenant mix remains well-diversified, with top inline store tenants including The Gap (2.7% of total base minimum rent), Tapestry (NYSE:TPR) (1.7%), and Knitwell Group (1.7%). Major anchor tenants include Macy’s (NYSE:M) (11.0% of total square footage), JC Penney (OTC:CPPRQ) (5.1%), and Dillard’s (NYSE:DDS) (3.7%).
The following chart details Simon’s top tenants, providing insight into the company’s exposure to various retail categories:
Strategic Initiatives
On June 27, 2025, Simon Property Group acquired its partner’s interest in the retail and parking facilities at Brickell City Centre in Miami, Florida. The company now wholly owns and manages this asset, further strengthening its presence in the key Florida market.
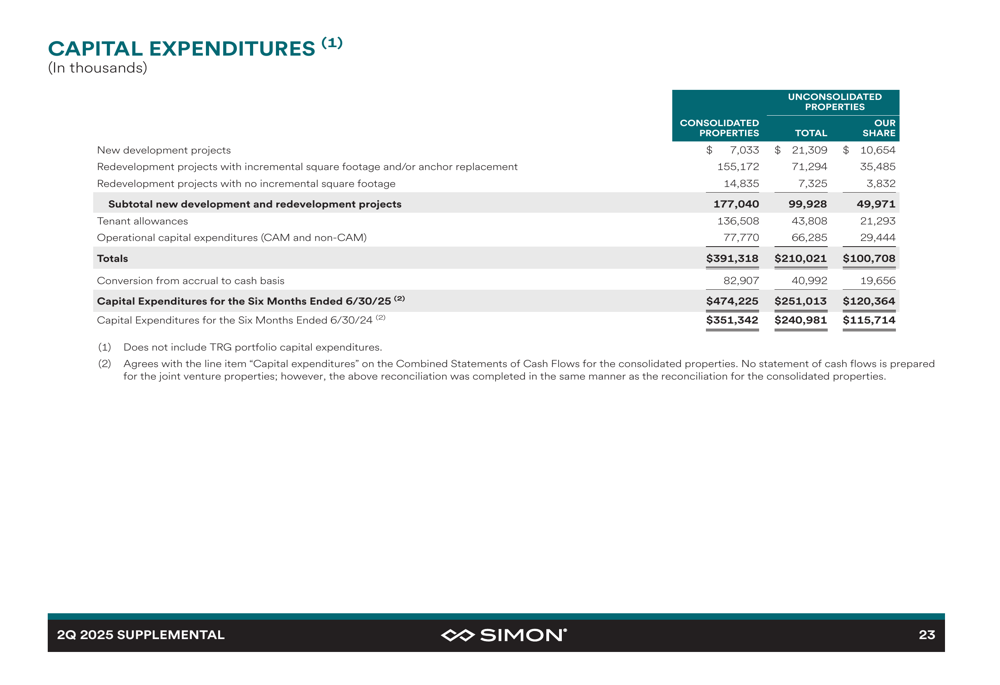
The company continues to invest in development activities, with ongoing mall redevelopments representing an outstanding net investment of $910.4 million and an expected stabilized return of 9%. For premium outlets new developments, the net investment stands at $57.5 million with an expected return of 11%.
The development activity summary provides details on current and planned investments:
Simon maintains a strong credit profile with investment-grade ratings from both Standard & Poor’s (A- with Positive Outlook) and Moody’s (A3 with Stable Outlook). The company’s debt metrics remain well within covenant requirements, with a total debt to total assets ratio of 38% (versus ≤65% required) and a fixed charge coverage ratio of 4.6x (versus >1.5x required).
The following credit profile illustrates Simon’s debt structure and key financial ratios:
Forward-Looking Statements
Based on the strong Q2 performance, Simon Property Group has increased its outlook for 2025 Real Estate FFO to a range of $12.45 to $12.65 per diluted share, a slight improvement from the previous guidance of $12.40 to $12.65 per share mentioned in the Q1 earnings call.
The reconciliation of estimated net income to Real Estate FFO provides transparency into the company’s forward-looking projections:
During the Q1 earnings call, CEO David Simon had emphasized the company’s "A-rated fortress balance sheet with over $10 billion in liquidity" as a key differentiator. The Q2 results reinforce this position of financial strength, with the company continuing to execute on its strategy of portfolio enhancement and operational excellence.
The improved guidance suggests management’s confidence in the company’s ability to maintain momentum through the second half of 2025, despite broader economic uncertainties and potential challenges related to retail inventory levels and consumer sentiment that were highlighted in previous communications.
With occupancy rates continuing to improve, base rents increasing, and strategic acquisitions enhancing the portfolio, Simon Property Group appears well-positioned to deliver on its updated financial targets for the remainder of 2025.
Full presentation:
This article was generated with the support of AI and reviewed by an editor. For more information see our T&C.