Bitcoin price today: falls to 2-week low below $113k ahead of Fed Jackson Hole

Introduction & Market Context
Simulations Plus Inc (NASDAQ:SLP) released its third-quarter fiscal year 2025 earnings presentation on July 14, 2025, revealing 10% revenue growth but a significant GAAP net loss. The stock reacted positively in aftermarket trading, rising 4.95% to $17.80 after closing the regular session up 3.01% at $17.47.
The biosimulation company, which provides software and consulting services for pharmaceutical and biotechnology development, continues to show revenue momentum despite some concerning metrics in software renewals. The quarter’s results highlight the company’s ability to improve adjusted profitability while managing through what appears to be a substantial one-time expense.
Quarterly Performance Highlights
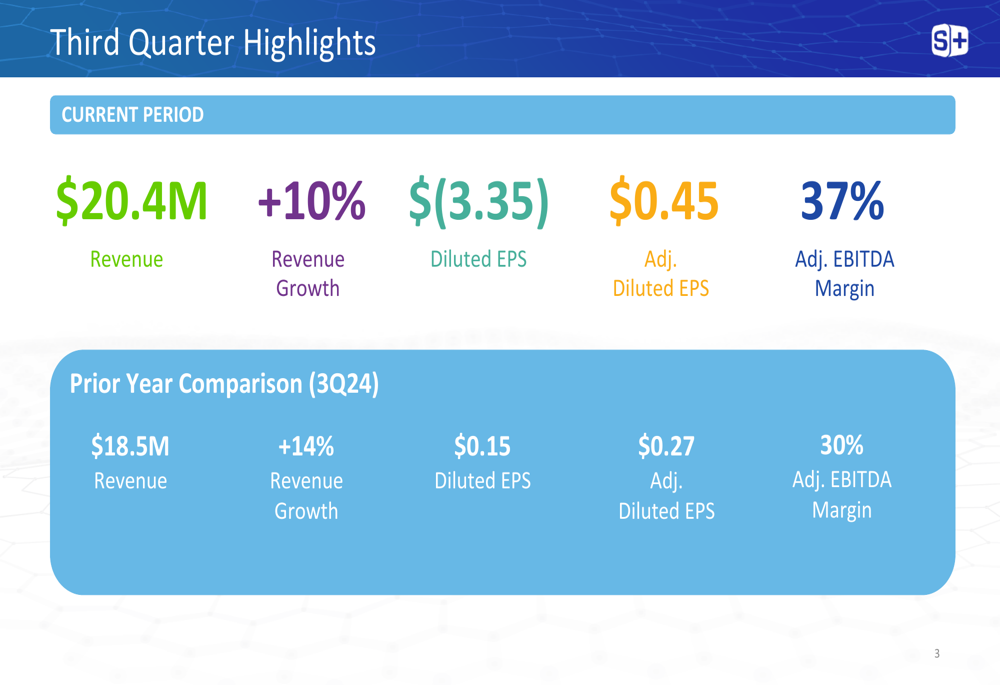
Simulations Plus reported third-quarter revenue of $20.4 million, a 10% increase compared to $18.5 million in the same period last year. The company’s adjusted EBITDA margin expanded significantly to 37% from 30% in Q3 2024, while adjusted diluted EPS rose to $0.45 from $0.27 in the prior-year quarter.
As shown in the following quarterly highlights chart:
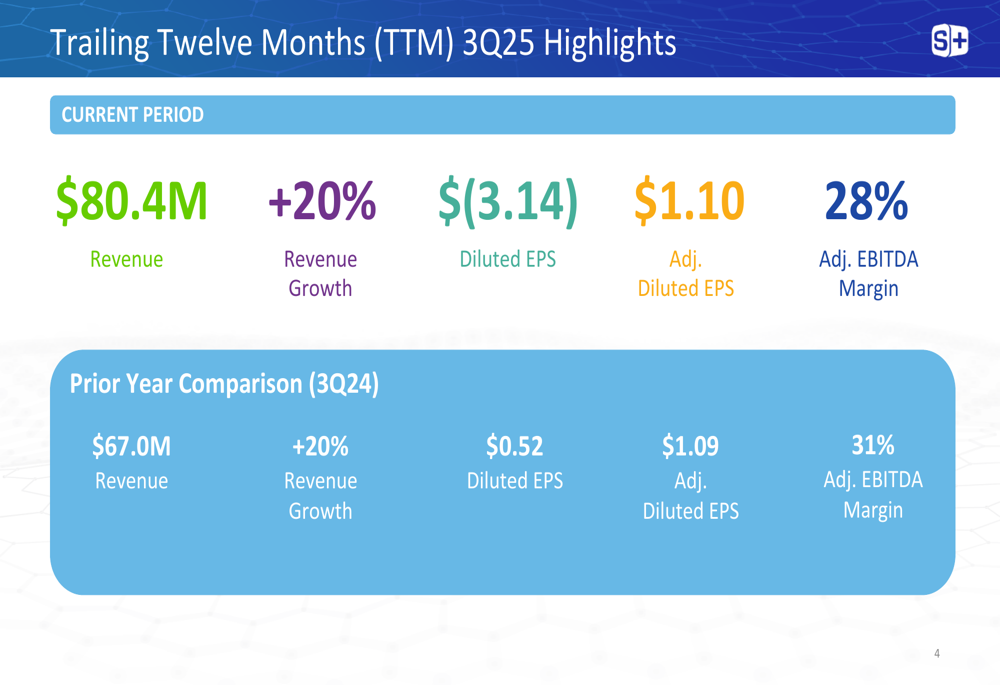
The company’s trailing twelve months (TTM) performance showed even stronger growth, with revenue reaching $80.4 million, up 20% year-over-year. This consistent growth trajectory demonstrates the company’s ability to expand its market presence despite challenges in certain segments.
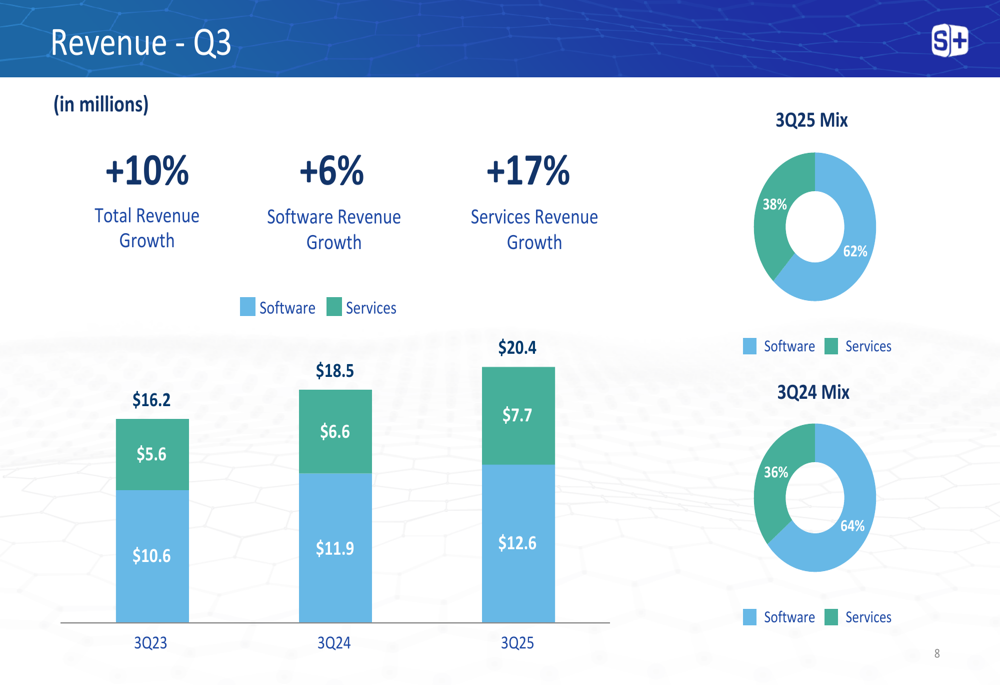
Revenue growth was driven by both business segments, with software revenue increasing 6% to $12.6 million and services revenue growing 17% to $7.7 million in Q3. The revenue mix remained relatively stable at 62% software and 38% services, compared to 64% software and 36% services in the prior-year period.
The following chart illustrates the revenue breakdown and growth trends:
Detailed Financial Analysis
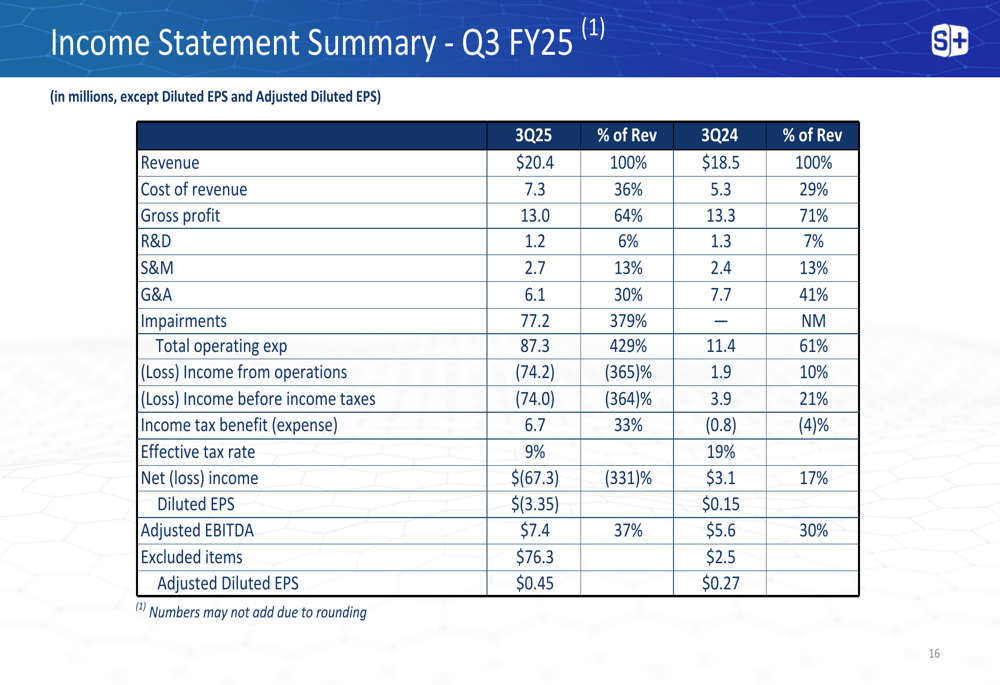
Despite strong revenue growth and improved adjusted metrics, Simulations Plus reported a significant GAAP net loss of $67.3 million or $(3.35) per diluted share, compared to net income of $3.0 million or $0.15 per diluted share in Q3 2024. This dramatic shift appears to be primarily related to a substantial increase in operating expenses, which totaled $87.3 million or 429% of revenue in the quarter.
The income statement summary reveals the extent of the discrepancy between GAAP and non-GAAP results:
The company’s balance sheet remains healthy, with cash and short-term investments increasing to $28.5 million as of May 31, 2025, up from $20.3 million at the end of fiscal 2024. Total (EPA:TTEF) assets decreased significantly from $196.6 million to $134.4 million, likely reflecting impairment charges or write-downs that contributed to the quarterly loss.
Software (ETR:SOWGn) and Services Segment Analysis
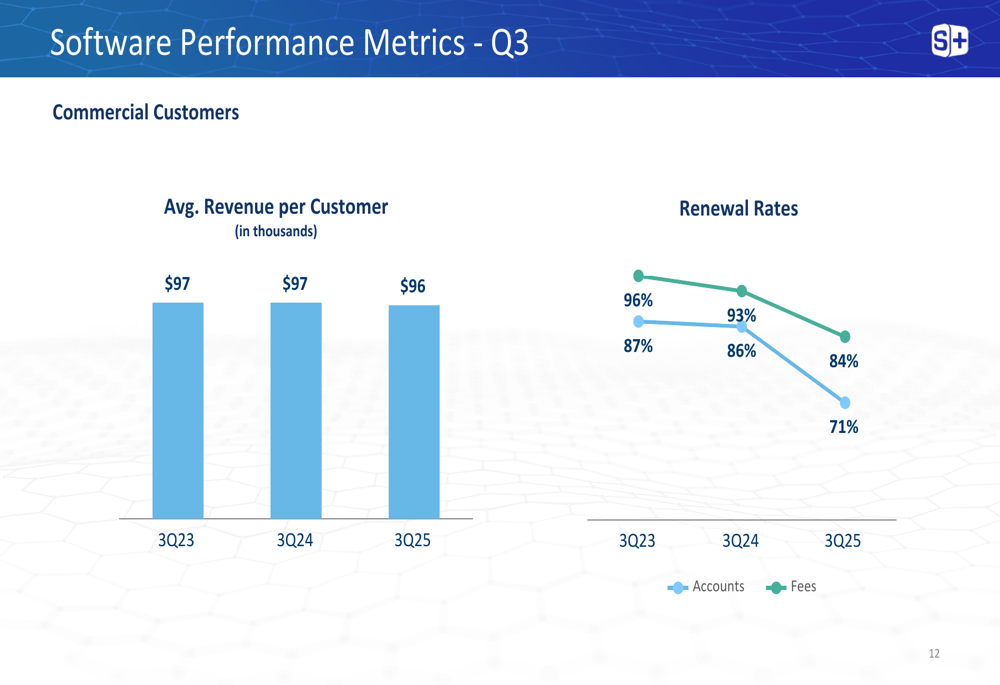
The software segment, which continues to be the company’s primary revenue driver, showed concerning trends in renewal rates despite overall growth. Account renewal rates declined to 84% in Q3 2025 from 93% in Q3 2024, while fee renewal rates dropped more dramatically to 71% from 86% in the prior-year period.
The following chart illustrates these software performance metrics:
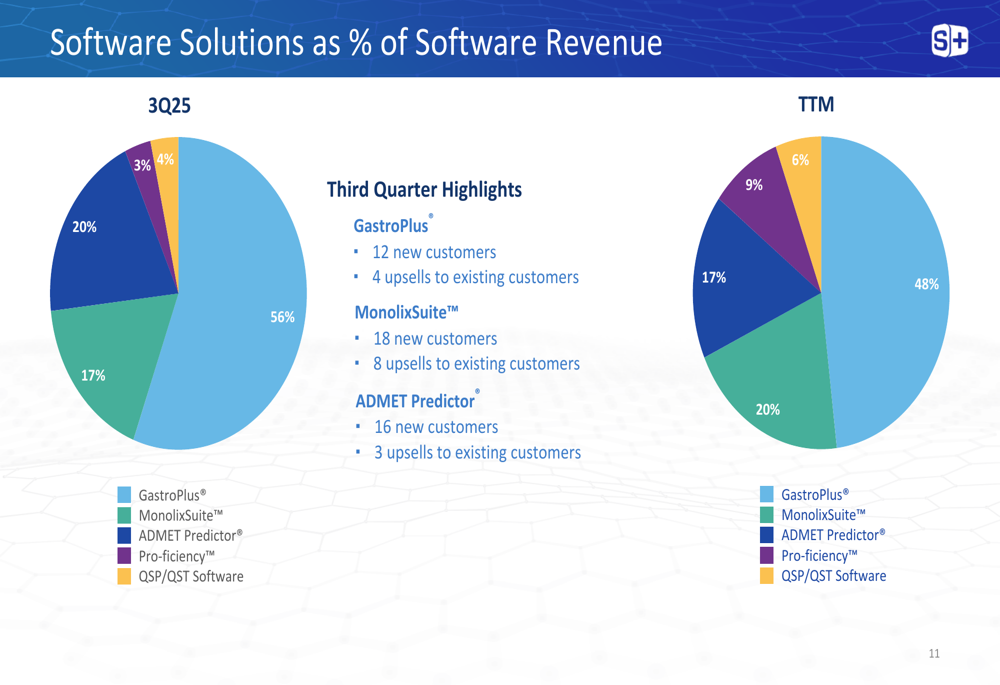
GastroPlus remains the company’s flagship product, accounting for 56% of software revenue in Q3 2025, followed by ADMET Predictor (20%) and MonolixSuite (17%). The company reported solid customer acquisition, with 12 new GastroPlus customers, 18 new MonolixSuite customers, and 16 new ADMET Predictor customers during the quarter.
The software product mix is illustrated in the following chart:
The services segment showed stronger growth than software, with a 17% revenue increase in Q3. PKPD Services represented the largest portion at 38% of services revenue, followed by Med Comm Services at 26%, which was added through the Pro-ficiency acquisition in June 2024. The services backlog stood at $20.7 million, with over 91% expected to be converted to revenue within the next 12 months.
Forward-Looking Statements
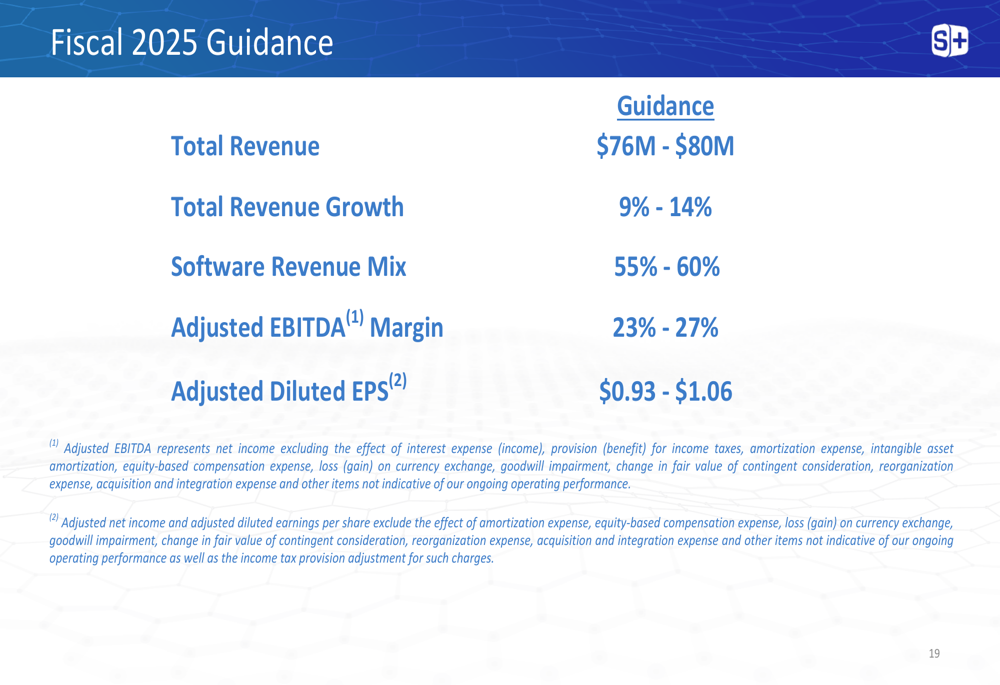
Simulations Plus provided fiscal 2025 guidance, projecting total revenue between $76 million and $80 million, representing growth of 9% to 14%. The company expects software to contribute 55% to 60% of total revenue, with an adjusted EBITDA margin of 23% to 27% and adjusted diluted EPS between $0.93 and $1.06.
The company’s guidance is summarized in the following chart:
This guidance appears to represent a downward revision from earlier projections. In the Q1 2025 earnings report, the company had projected fiscal 2025 revenue between $90 million and $93 million with an adjusted EPS range of $1.07 to $1.20.
Despite the significant GAAP net loss in Q3, the company’s strong adjusted EBITDA margin, growing services backlog, and healthy cash position suggest underlying business strength. However, the declining software renewal rates bear watching, as they could signal competitive pressures or customer satisfaction issues in the company’s highest-margin segment.
The market’s positive reaction to the earnings release suggests investors may be focusing on the improved adjusted metrics and revenue growth while looking past what appears to be a one-time expense impact on GAAP results. With the stock trading near its 52-week low of $16.72 prior to this report, the aftermarket gains indicate potential renewed investor confidence in Simulations Plus’s growth trajectory.
Full presentation:
This article was generated with the support of AI and reviewed by an editor. For more information see our T&C.