Trump to impose 100% tariff on China starting November 1

Sixth Street Specialty Lending, Inc. (NYSE:TSLX) released its second quarter 2025 earnings presentation, revealing an increase in net asset value (NAV) despite a decline in net investment income. The business development company, which focuses on providing financing solutions to middle-market companies, demonstrated resilience in its portfolio quality while maintaining substantial liquidity.
Quarterly Performance Highlights
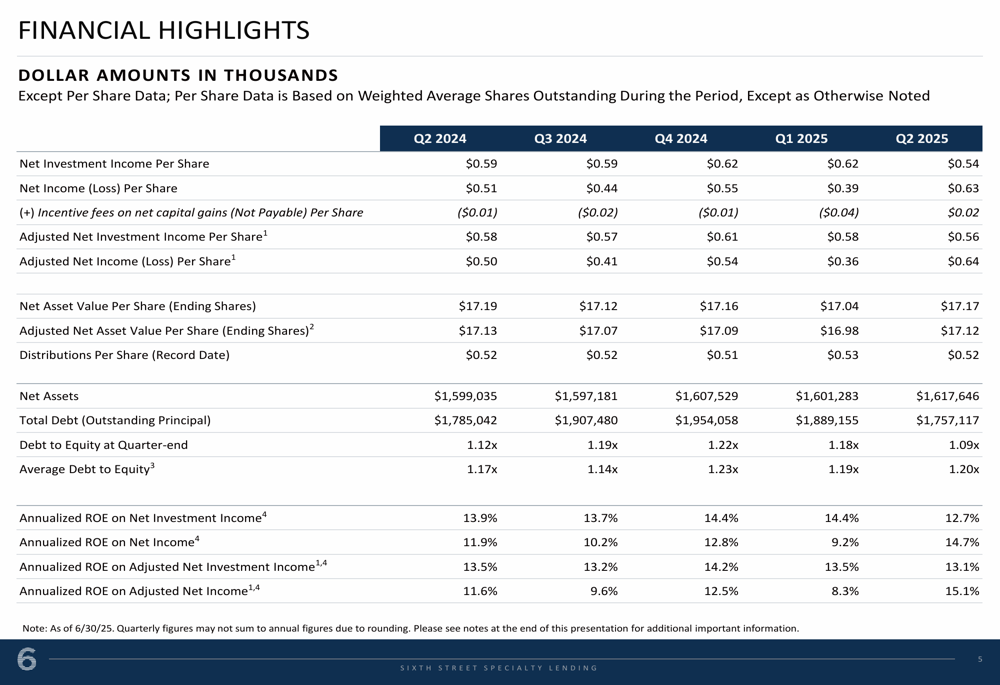
TSLX reported Q2 2025 net investment income per share of $0.54, down from $0.62 in the previous quarter. However, net income per share increased significantly to $0.63 from $0.39 in Q1 2025. The company’s NAV per share rose to $17.17 as of June 30, 2025, compared to $17.04 at the end of March 2025.
The company achieved an annualized return on equity (ROE) from net income of 14.7% and an ROE from adjusted net income of 15.1% for the quarter. These figures represent a substantial improvement from the previous quarter’s performance.
As shown in the following quarterly financial data table, TSLX has maintained relatively stable performance metrics over the past five quarters:
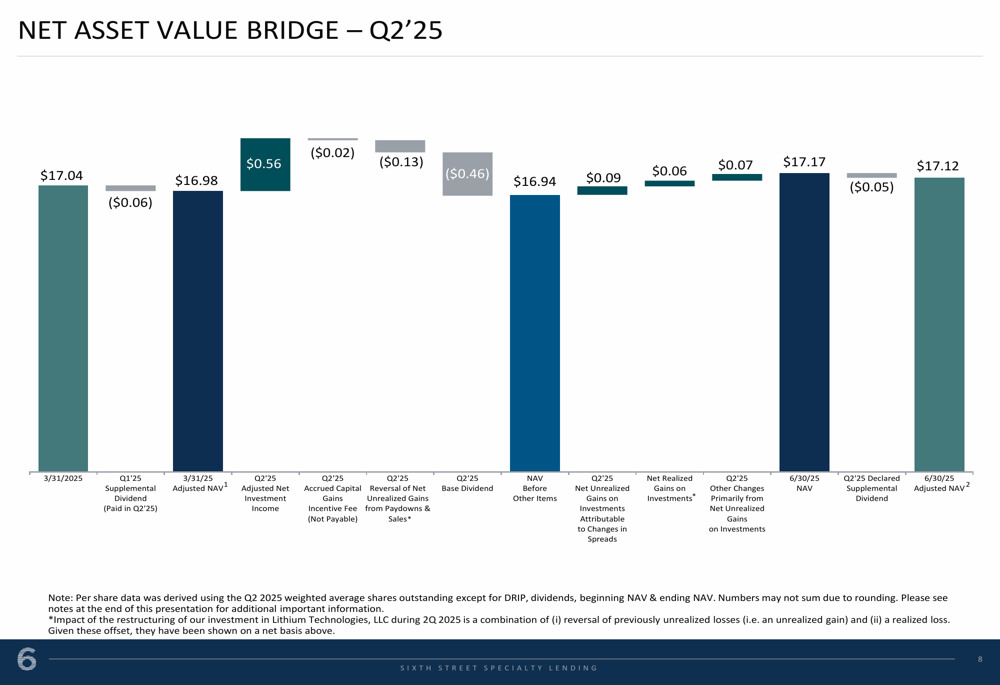
The NAV bridge below illustrates the components that contributed to the NAV increase during Q2 2025, including net investment income of $0.56 per share and net unrealized gains on investments attributable to changes in spreads of $0.09 per share:
Portfolio Composition and Quality
TSLX continues to maintain a high-quality portfolio with a focus on senior secured investments. As of June 30, 2025, the portfolio consisted of investments in 109 companies with an average investment size of $30.2 million. First-lien debt investments represented 92.4% of the portfolio, with 96.5% being floating rate investments.
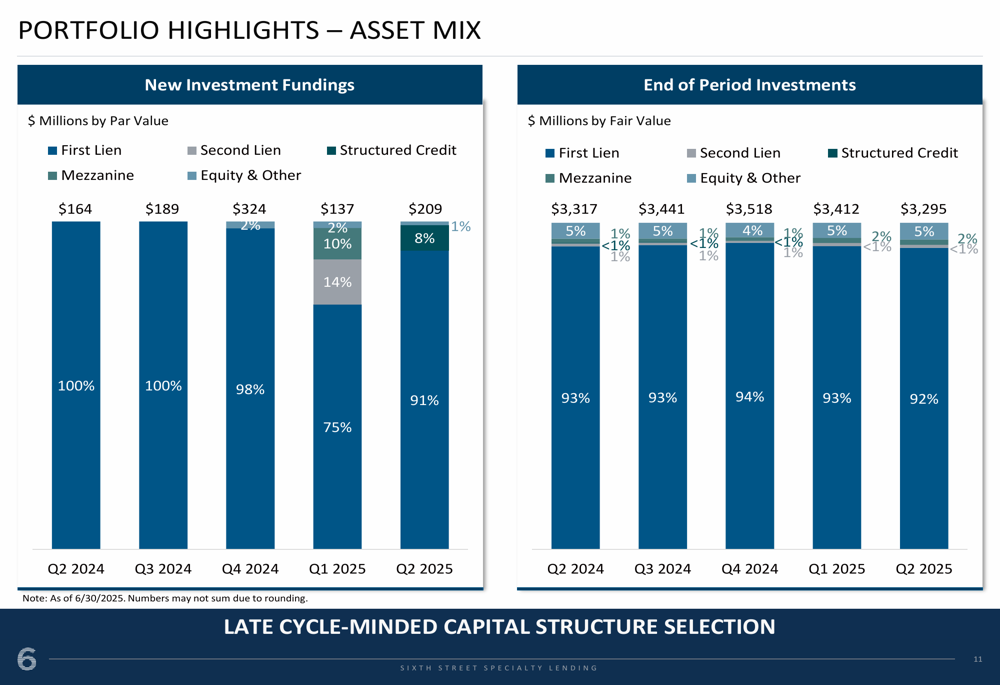
The company reported non-accrual investments representing only 0.6% of the portfolio at fair value, indicating strong credit quality. New investment commitments for Q2 2025 totaled $297.7 million, with fundings of $208.6 million.
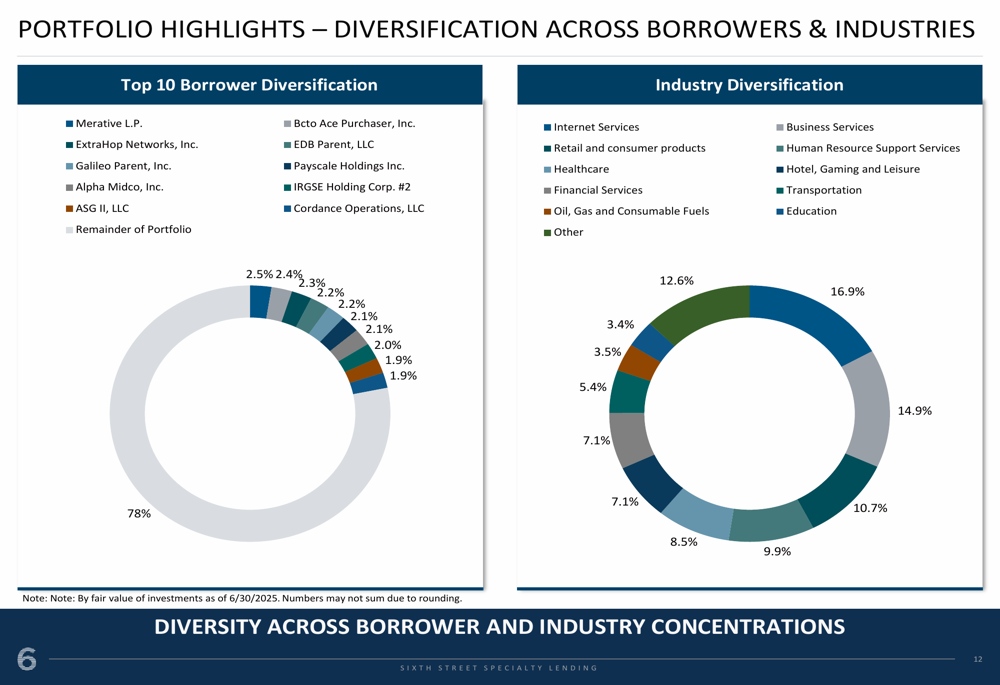
The portfolio remains well-diversified across industries, with Internet Services (16.9%), Healthcare (14.9%), and Retail and Consumer Products (12.6%) representing the largest sectors. The top 10 borrowers account for just 22% of the total portfolio, demonstrating the company’s commitment to diversification.
The following chart illustrates the company’s portfolio diversification across borrowers and industries:
The asset mix of TSLX’s portfolio has remained relatively consistent, with a continued emphasis on first-lien debt investments:
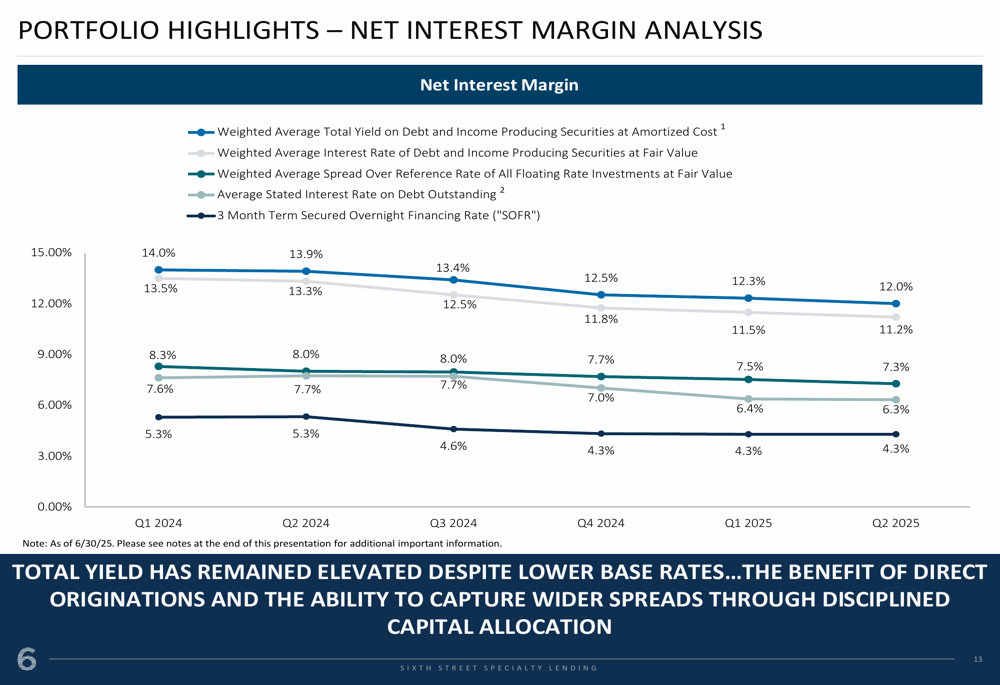
Interest Rate Environment and Margins
TSLX has navigated the interest rate environment effectively, maintaining attractive spreads despite market fluctuations. The weighted average spread over the reference rate for all floating rate investments was 6.3% at fair value, while the average stated interest rate on debt outstanding was 4.3%.
The following chart shows the evolution of interest margins over the past several quarters:
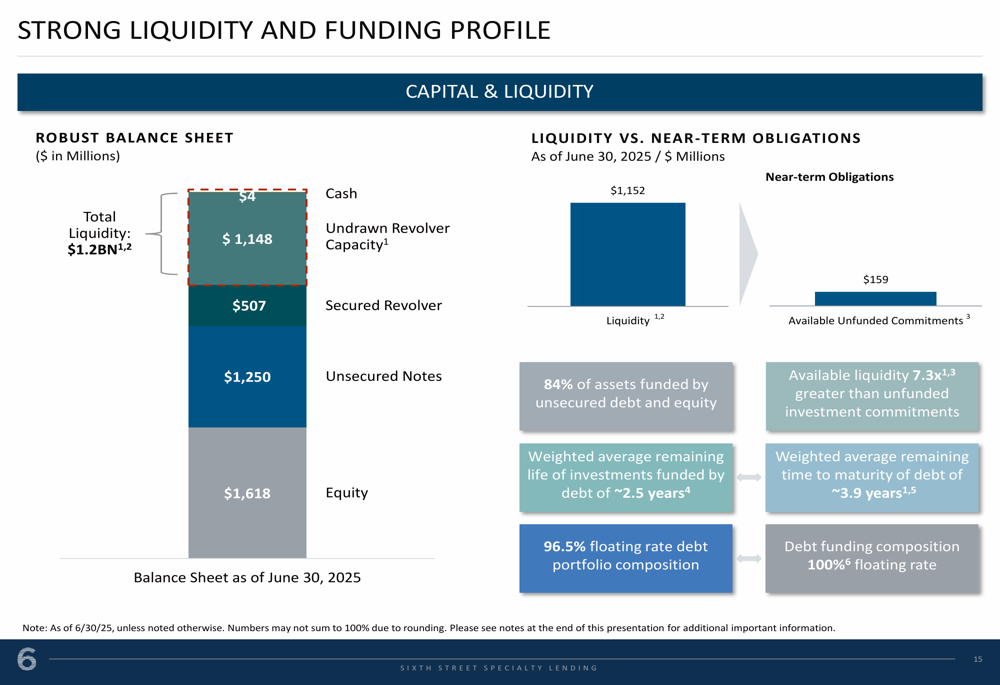
Liquidity and Capital Position
TSLX maintains a robust liquidity position with $1.15 billion in available liquidity, including $4 million in cash and $1.15 billion in undrawn revolver capacity. This liquidity is 7.3 times greater than the company’s unfunded investment commitments of $159 million, providing significant flexibility to pursue new investment opportunities.
The company’s leverage ratio stood at 1.09x at quarter-end, well within its target range. TSLX has a well-structured debt maturity profile with no significant maturities until 2026, and a weighted average remaining time to maturity of debt of approximately 3.9 years compared to a weighted average remaining life of investments of about 2.5 years.
The following chart illustrates the company’s strong liquidity and funding profile:
Dividend and Shareholder Returns
TSLX declared a base dividend of $0.46 per share and a supplemental dividend of $0.05 per share for Q2 2025. The company has consistently paid dividends since its IPO, with total dividends paid since inception reaching $25.75 per share.
According to the most recent market data, TSLX shares closed at $23.87 on July 30, 2025, down 0.88% for the day. The stock has traded between $18.58 and $25.17 over the past 52 weeks.
Forward-Looking Statements
TSLX is well-positioned to navigate the current market environment with its disciplined investment approach, strong liquidity position, and focus on senior secured investments. The company’s strategy of targeting middle-market companies with EBITDA between $10 million and $250 million continues to provide attractive investment opportunities.
The company’s external adviser, part of Sixth Street, a global investment firm with over $115 billion in assets under management, provides significant sourcing advantages with approximately 99% of originations coming from non-intermediated channels.
With its strong balance sheet, diversified portfolio, and experienced management team, TSLX appears well-equipped to continue delivering solid returns to shareholders while managing risks in an evolving economic environment.
Full presentation:
This article was generated with the support of AI and reviewed by an editor. For more information see our T&C.