BofA warns Fed risks policy mistake with early rate cuts

Introduction & Market Context
Icelandic insurer Sjóvá presented its Q1 2025 financial results on May 15, 2025, revealing a quarter of contrasting performance across its business segments. The company reported a loss after tax of 540 million ISK, despite strong insurance operations, as difficult conditions in the stock market significantly impacted investment returns.
The company’s stock price has shown resilience despite the quarterly loss, with shares trading at 48.6 ISK as of May 16, 2025, up 3.85% on the day following the presentation. This suggests investors may be focusing on the strong underlying insurance business rather than the temporary investment setbacks.
Quarterly Performance Highlights
Sjóvá’s Q1 2025 results showed a clear divide between its core insurance operations and investment activities. The company achieved a profit from insurance contracts before tax of 821 million ISK, while suffering a loss from investments before tax of 1,126 million ISK, resulting in an overall loss after tax of 540 million ISK.
As shown in the following comprehensive overview of the company’s key financial results:
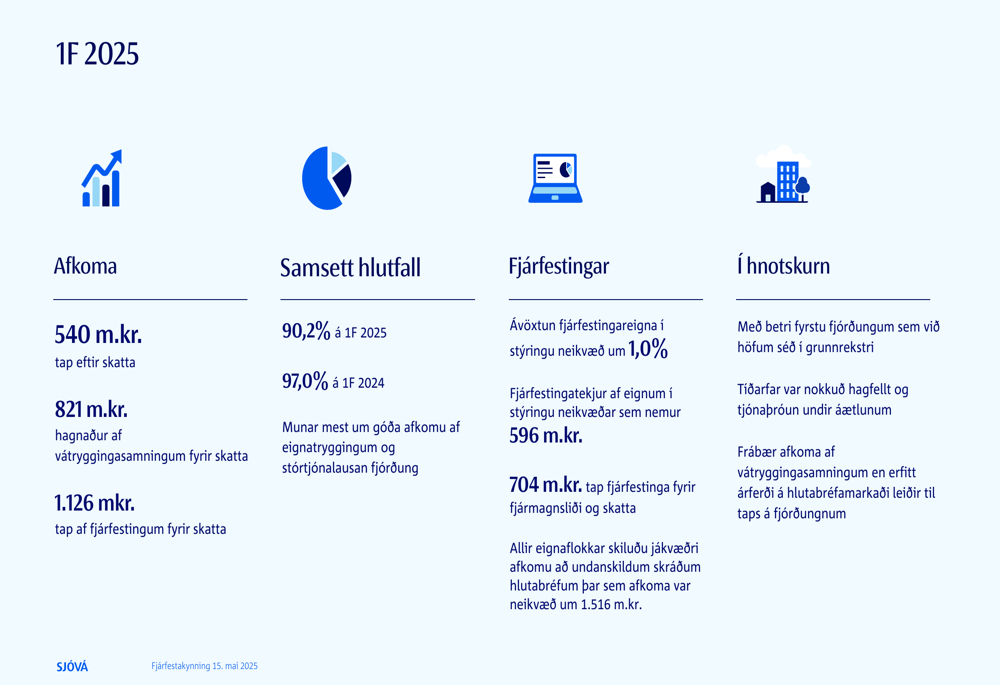
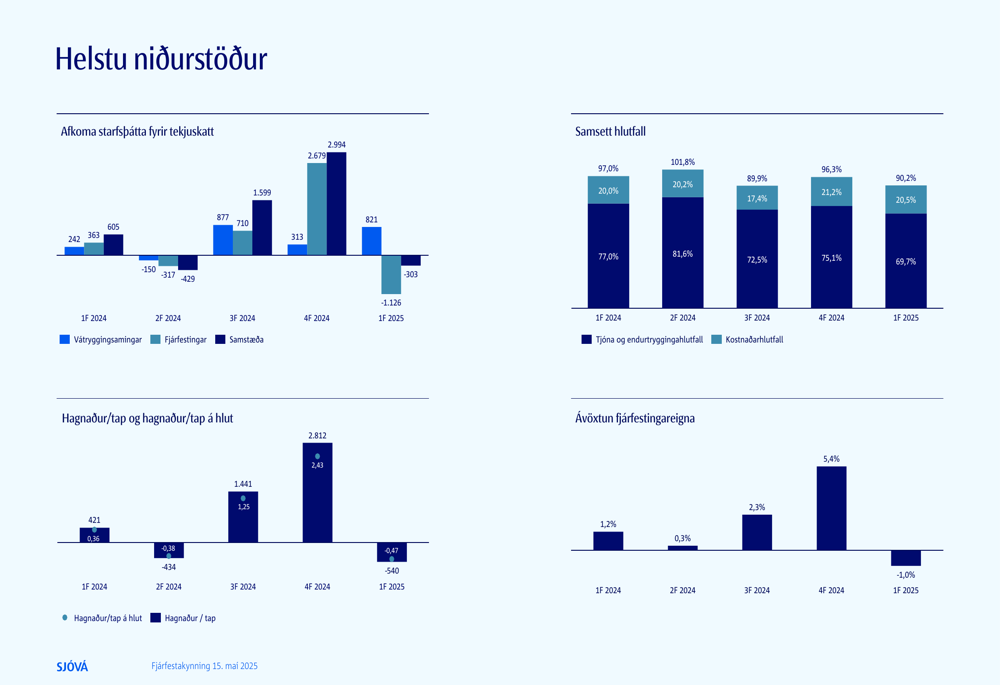
The combined ratio – a key measure of insurance profitability – improved significantly to 90.2% in Q1 2025 from 97.0% in the same period last year. This improvement was primarily attributed to strong performance in property insurance and a quarter with no major claims. The company noted that "the weather was quite favorable and claims development was below expectations," contributing to what management described as "one of the best first quarters that we have seen in core operations."
Revenue growth was modest at 3.6% year-on-year, which the company acknowledged was lower than in previous years. Meanwhile, claims costs decreased by 4.5%, helping to boost the profitability of insurance operations despite an increase in operating expenses driven by higher labor costs.
The following chart illustrates the company’s performance trends across key indicators:
Detailed Financial Analysis
Sjóvá’s income statement reveals the stark contrast between its insurance and investment segments. While insurance operations generated a profit of 821 million ISK before tax (up from 242 million ISK in Q1 2024), investment activities resulted in a loss of 1,126 million ISK (compared to a profit of 363 million ISK in Q1 2024).
The detailed breakdown of the operating income statement shows:
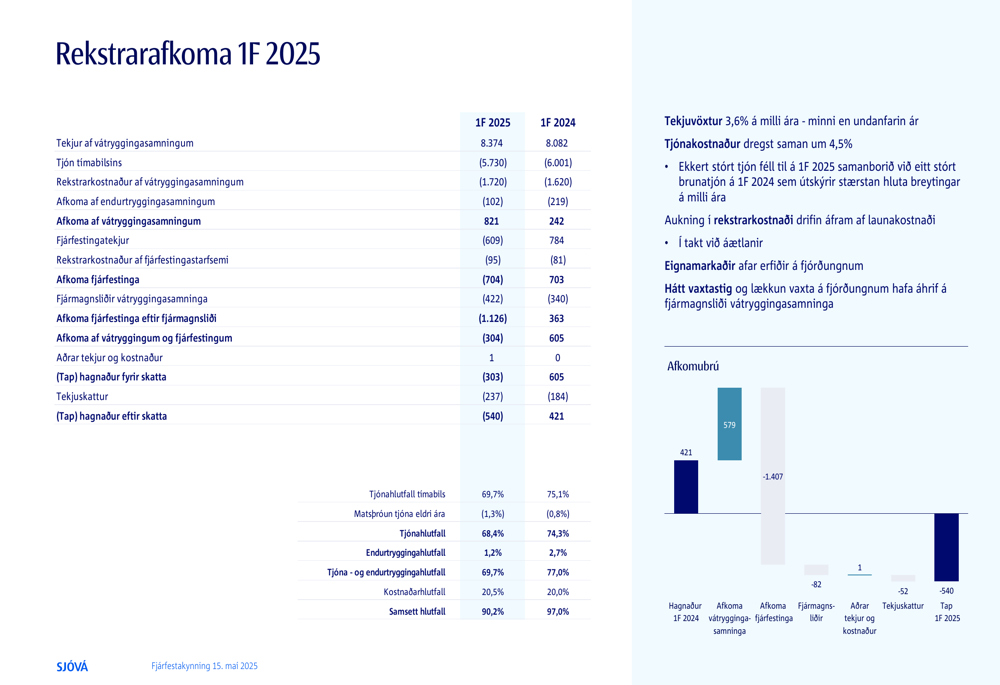
Income from insurance contracts increased to 8,374 million ISK (up from 8,082 million ISK), while claims for the period decreased to 5,730 million ISK (down from 6,001 million ISK). This resulted in a significantly improved loss ratio of 69.7% compared to 75.1% in Q1 2024.
Operating expenses related to insurance contracts increased to 1,720 million ISK (up from 1,620 million ISK), reflecting the higher labor costs mentioned by management. Despite this increase, the combined ratio improved substantially due to the reduction in claims costs.
Investment Performance and Strategy
The investment side of Sjóvá’s business faced significant challenges during Q1 2025, with an overall negative return of 1.0% on investment assets under management. The poor performance was primarily driven by listed equities, which delivered a negative return of 9.0%, resulting in a loss of 1,516 million ISK.
The following detailed breakdown of investment activities illustrates the performance across different asset classes:
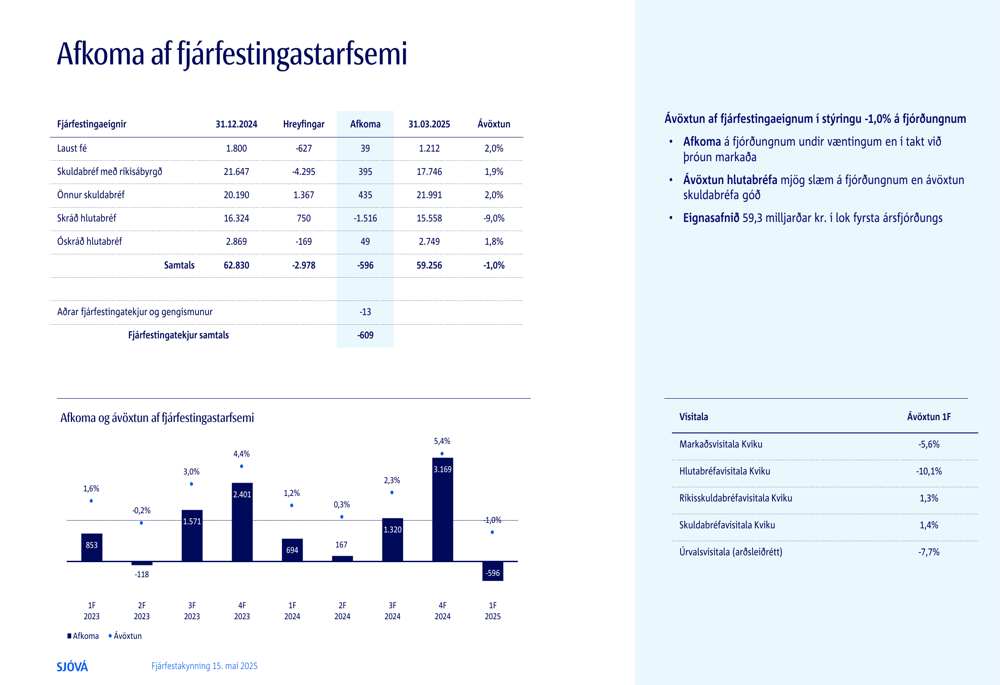
In contrast to equities, other asset classes performed relatively well. Government bonds yielded 1.9%, other bonds 2.0%, and unlisted equities 1.8%. Cash holdings returned 2.0% during the quarter.
The negative performance of listed equities aligned with broader market trends, as evidenced by the negative returns of various market indices: Market Index Kviku (-5.6%), Equity Index Kviku (-10.1%), and Selection Index (-7.7%).
Sjóvá made several adjustments to its investment portfolio during the quarter, as shown in the following asset allocation chart:
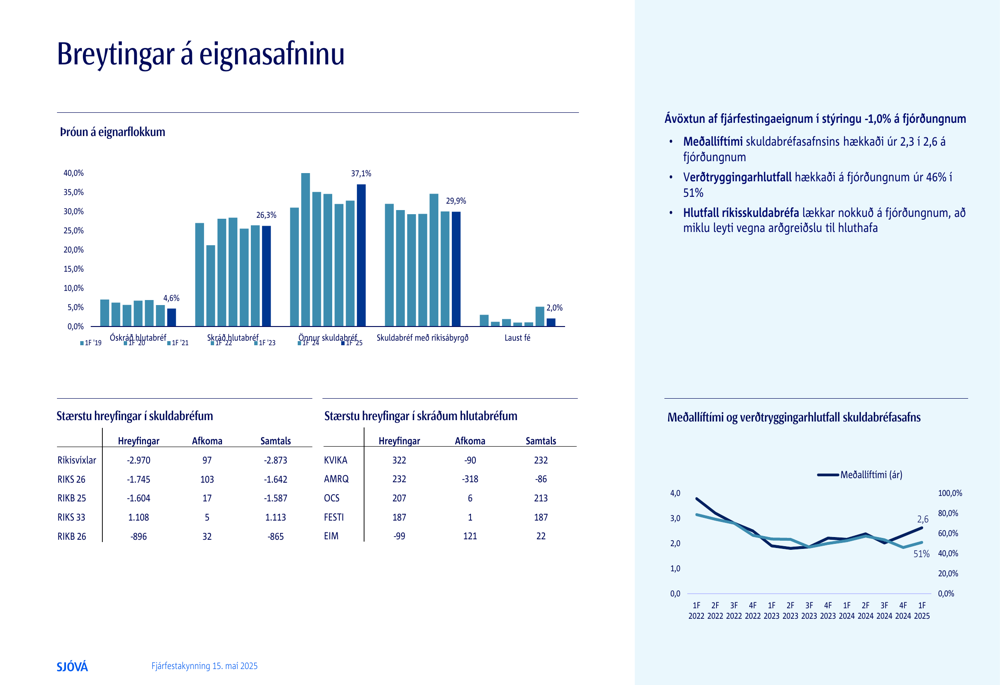
The company reduced its holdings in government bonds, partly due to dividend payments to shareholders. The average lifetime of the bond portfolio increased from 2.3 to 2.6 years during the quarter, while the indexation ratio rose from 46% to 51%.
Solvency and Balance Sheet Position
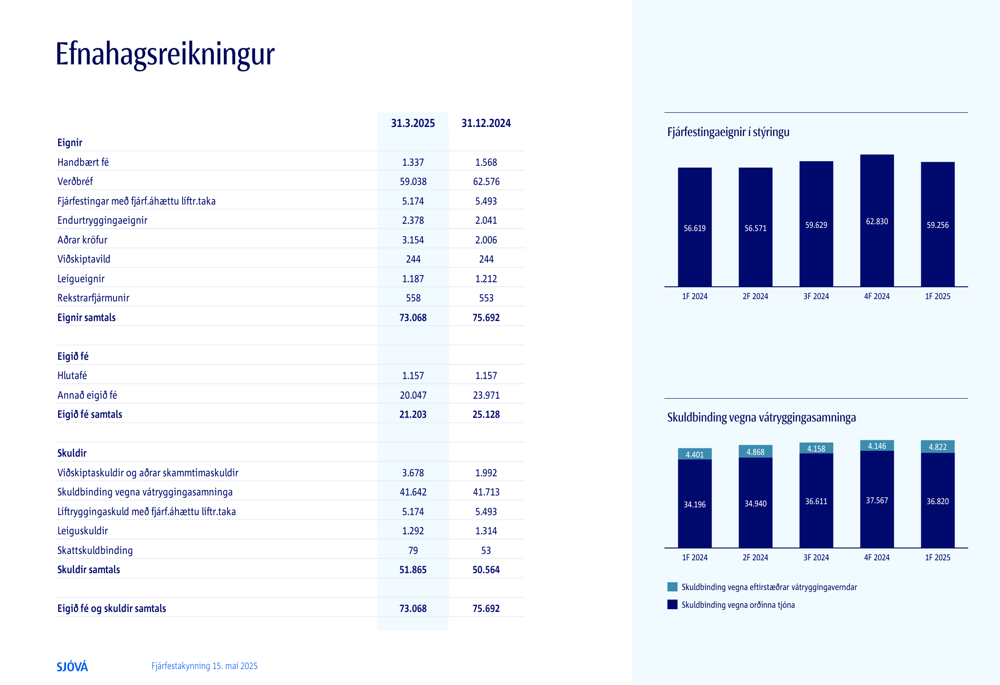
Sjóvá’s balance sheet remained solid despite the quarterly loss. Total (EPA:TTEF) assets stood at 73,068 million ISK as of March 31, 2025, down from 75,692 million ISK at the end of 2024. The decrease was primarily due to the dividend payment and the quarterly loss.
The company’s balance sheet shows:
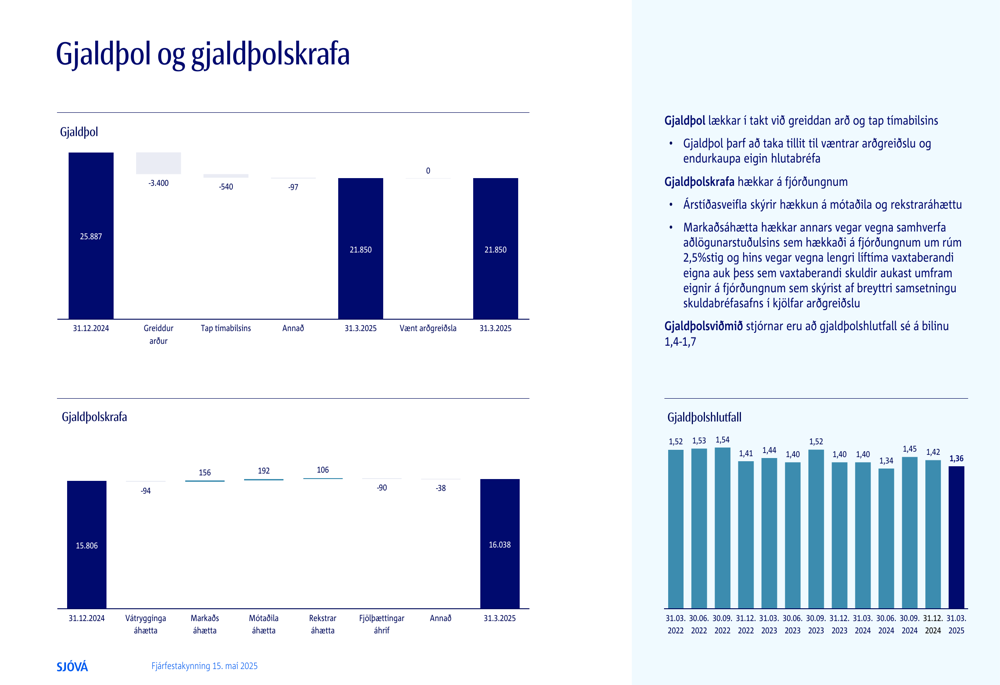
The solvency ratio, a critical metric for insurers, stood at 1.36 as of March 31, 2025. This represents a decrease from previous periods but remains comfortably above regulatory requirements. The solvency position was impacted by both the dividend payment of 3,400 million ISK and the quarterly loss of 540 million ISK.
The following chart illustrates the changes in solvency position:
Despite the quarterly loss, Sjóvá’s strong insurance operations and solid solvency position suggest the company remains well-positioned to weather the temporary investment setbacks. Management’s focus on maintaining core operational excellence while navigating challenging investment markets will likely be key to the company’s performance for the remainder of 2025.
Full presentation:
This article was generated with the support of AI and reviewed by an editor. For more information see our T&C.