Palantir a high-risk investment with ’a one-of-a-kind growth and margin model’

Introduction & Market Context
Snap Inc . (NYSE:SNAP) released its first quarter 2025 earnings presentation on April 29, revealing continued revenue growth and significantly improved financial metrics despite a challenging market reaction. The social media company reported a 14% year-over-year revenue increase to $1.36 billion, while substantially narrowing its net loss compared to the same period last year.
Despite these improvements, Snap’s stock fell approximately 12% in after-hours trading to $8.00, suggesting investors may have expected stronger results or guidance. This reaction comes as the company continues its push toward reaching 1 billion monthly active users while working to improve monetization across its platform.
Quarterly Performance Highlights
Snap’s Q1 2025 financial performance showed broad improvement across key metrics. Revenue reached $1.36 billion, representing a 14% year-over-year increase, while the company’s net loss improved significantly to $140 million from $305 million in Q1 2024 – a 54% reduction.
As shown in the following financial summary chart:
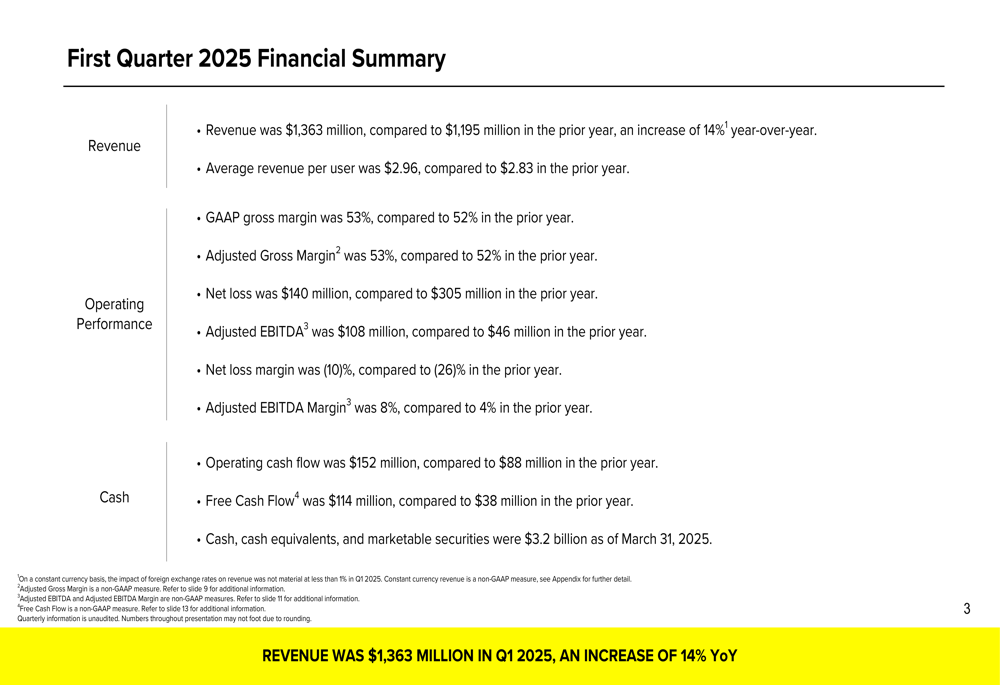
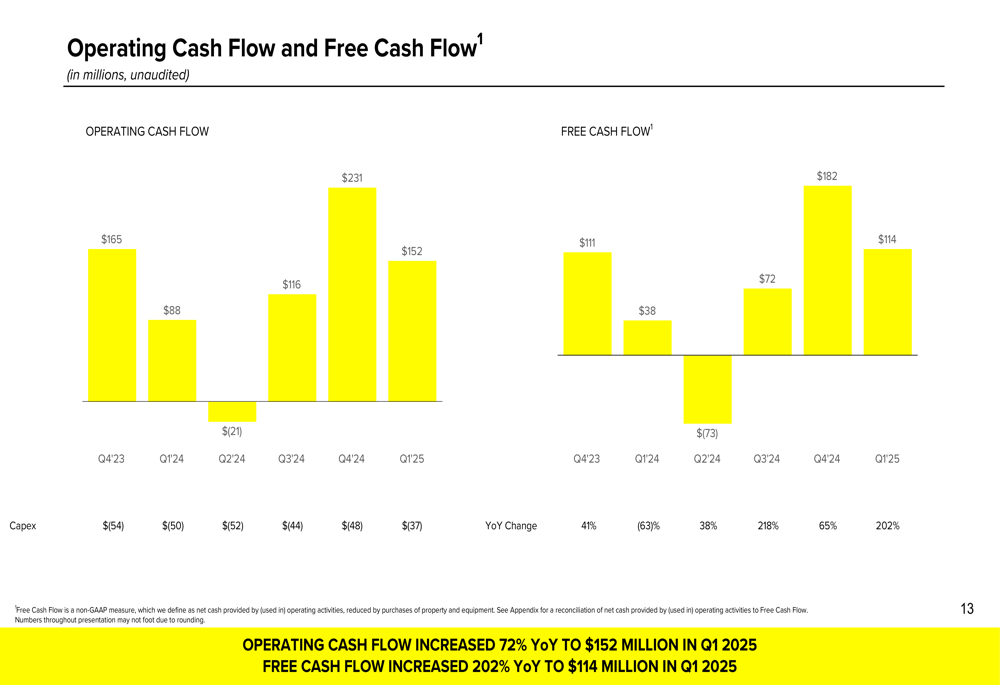
The company’s adjusted EBITDA more than doubled to $108 million (8% margin) compared to $46 million (4% margin) in the prior year. Snap also reported substantial cash flow improvements, with operating cash flow increasing 72% year-over-year to $152 million and free cash flow surging 202% to $114 million.
Cash generation has been a particular bright spot for Snap, as illustrated in this chart:
User Growth and Engagement
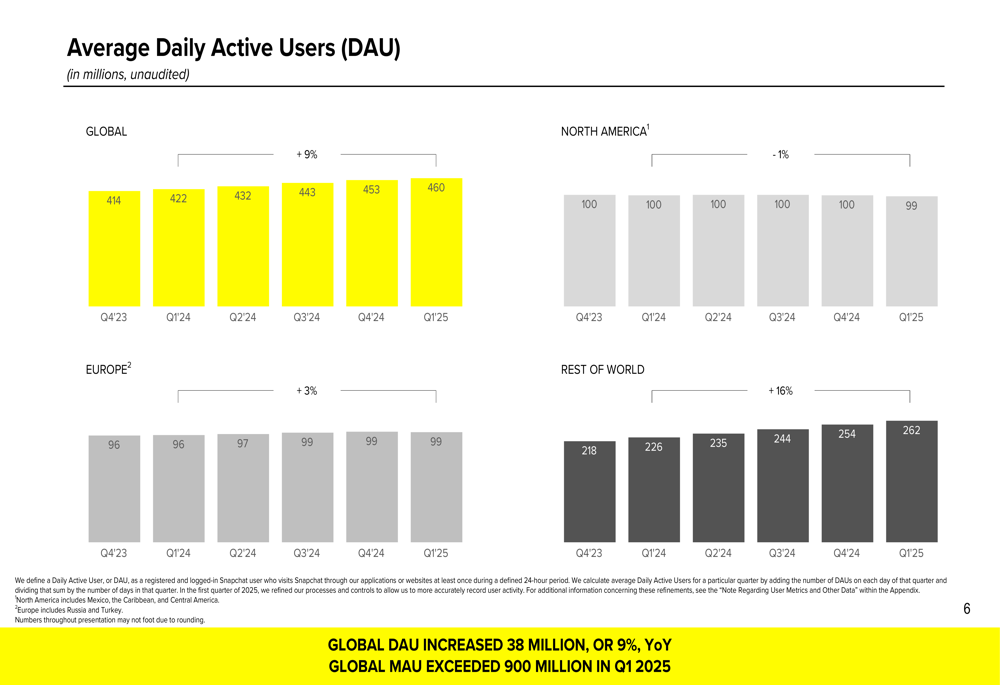
Snap continued to expand its user base, with daily active users (DAU) reaching 460 million in Q1 2025, a 9% year-over-year increase. The company also reported exceeding 900 million monthly active users, moving closer to its stated goal of reaching 1 billion MAU.
User growth was strongest in the Rest of World region at 16% year-over-year, while North America and Europe showed more modest growth of 1% and 3% respectively, as shown in the following chart:
The company highlighted several engagement metrics in its presentation, including Spotlight views doubling year-over-year and My AI daily active users growing more than 55% year-over-year in the U.S. Snap Star Spotlight posts also grew by over 125% compared to the prior year.
Revenue by Geography and ARPU
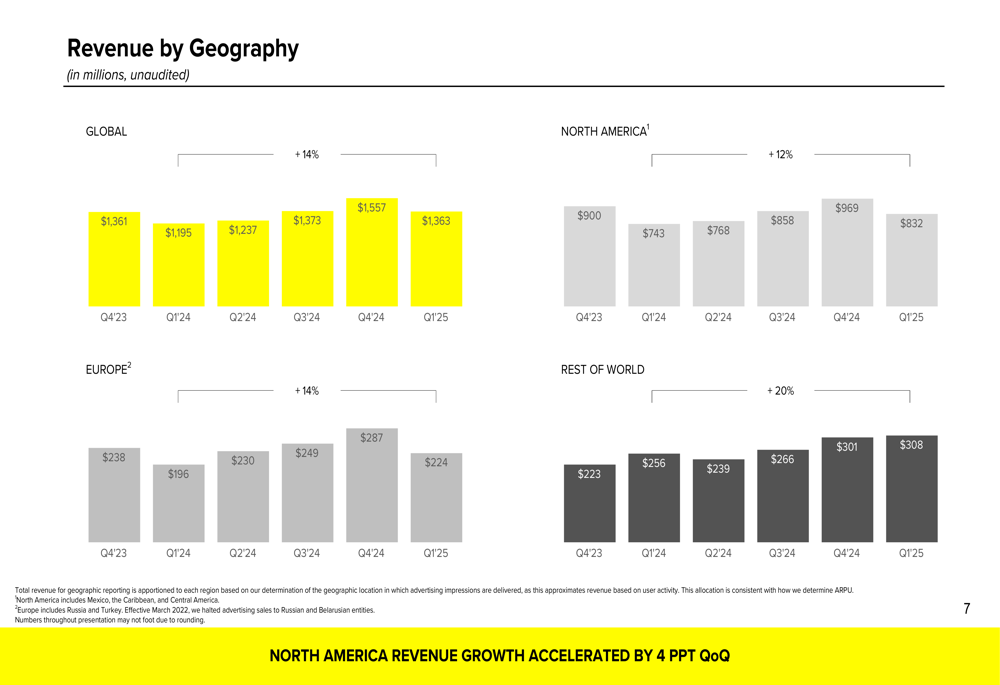
Snap’s revenue growth was distributed across all geographic regions, with North America growing 12% year-over-year to $832 million, Europe increasing 14% to $224 million, and Rest of World showing the strongest growth at 20% to $308 million.
The regional revenue breakdown is illustrated in this chart:
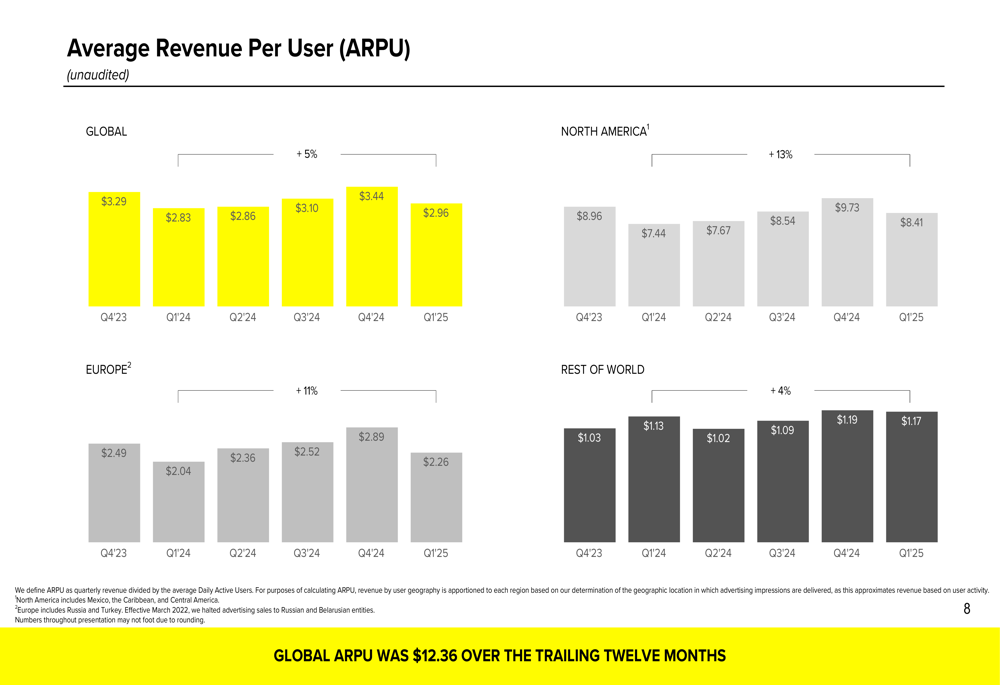
Average Revenue Per User (ARPU) increased 5% year-over-year to $2.96 globally. North America led with the highest ARPU at $8.41 (up 13% YoY), followed by Europe at $2.26 (up 11%) and Rest of World at $1.07 (up 4%).
The following chart shows ARPU trends by region:
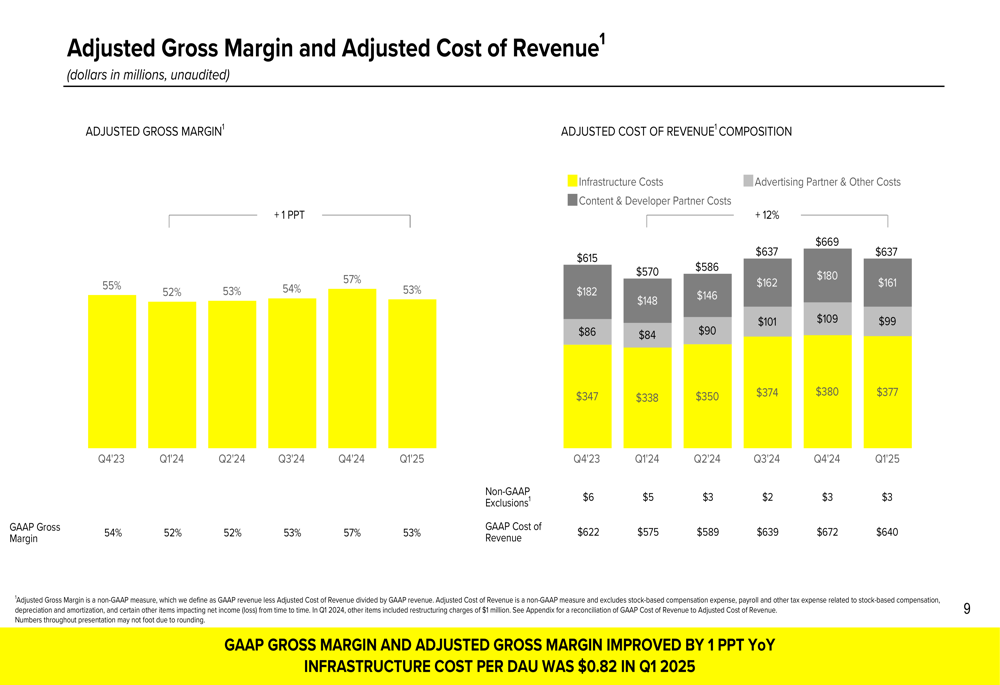
Profitability and Margin Improvements
Snap’s adjusted gross margin improved by 1 percentage point year-over-year to 53%. The company’s infrastructure cost per DAU was $0.82 in Q1 2025, with total infrastructure costs rising from $84 million in Q1 2024 to $99 million in Q1 2025.
The company’s adjusted operating expense margin improved by 3 percentage points year-over-year, with adjusted operating expenses totaling $607 million in Q1 2025 compared to $580 million in Q1 2024.
These margin improvements are reflected in the following chart:
Strategic Initiatives
Snap highlighted several strategic initiatives in its presentation, including significant growth in its advertising business with total active advertisers increasing by 60% year-over-year in Q1. The company also reported that its subscription service, Snapchat+, saw revenue increase by 75% year-over-year.
In the augmented reality (AR) space, Snap introduced several new features, including advanced AI video Lenses, an AI-powered tool for simplifying Lens creation, and new capabilities for its Spectacles AR glasses. Lens Studio downloads more than doubled year-over-year, and Lens Studio monthly active users reached an all-time high.
Capital Allocation and Liquidity
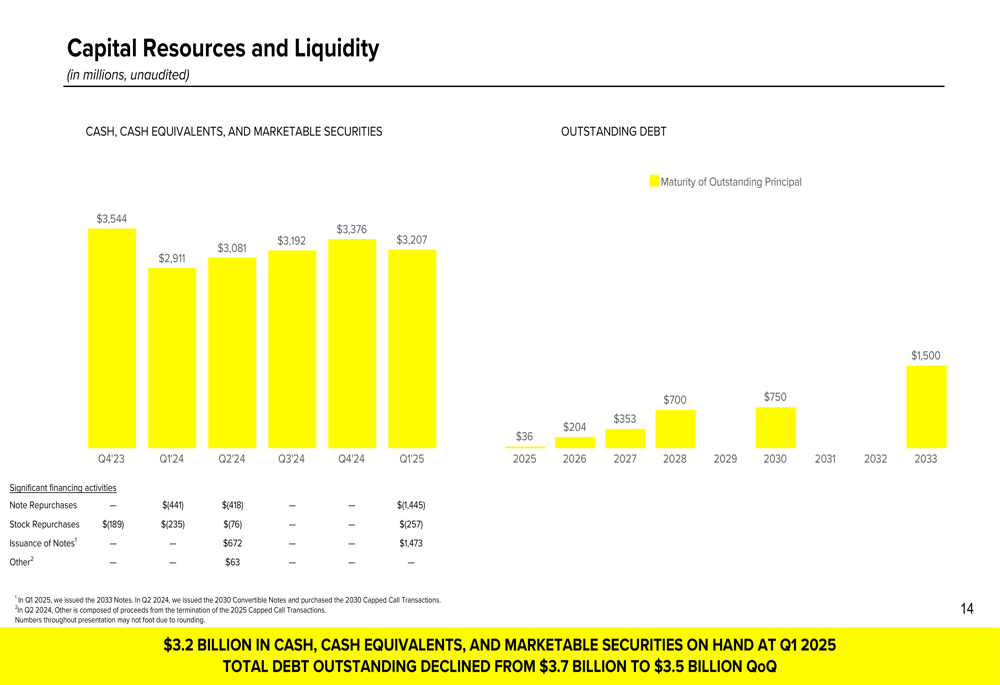
Snap ended Q1 2025 with $3.2 billion in cash, cash equivalents, and marketable securities. The company repurchased 27.3 million shares during the quarter at a cost of $257 million, demonstrating confidence in its long-term prospects despite ongoing challenges.
The company’s diluted net loss per share improved to $(0.09) in Q1 2025 from $(0.19) in Q1 2024. Snap’s total debt outstanding declined from $3.7 billion to $3.5 billion quarter-over-quarter.
The following chart illustrates Snap’s capital resources and debt maturity schedule:
Forward-Looking Statements
While Snap did not provide specific revenue guidance in the slides, the company’s focus on reaching 1 billion monthly active users suggests continued investment in user growth. The company’s improving financial metrics, particularly in cash flow and reduced losses, indicate progress toward sustainable profitability.
The significant after-hours stock decline, however, suggests that investors may have been looking for stronger results or more optimistic forward guidance. This reaction comes despite Snap’s improved financial performance and continued user growth, highlighting the market’s high expectations for social media companies in the current competitive landscape.
Full presentation:
This article was generated with the support of AI and reviewed by an editor. For more information see our T&C.