Navitas stock soars as company advances 800V tech for NVIDIA AI platforms

Introduction & Market Context
Southern First Bancshares Inc (NASDAQ:SFST) presented its second quarter 2025 investor presentation on July 22, showcasing significant earnings growth and margin expansion. The stock closed at $40.09 on July 21 and was trading up 0.87% to $40.44 in premarket activity following the presentation. The bank, which operates primarily in high-growth southeastern markets, has seen its shares trade between $29.14 and $45.91 over the past 52 weeks.
Quarterly Performance Highlights
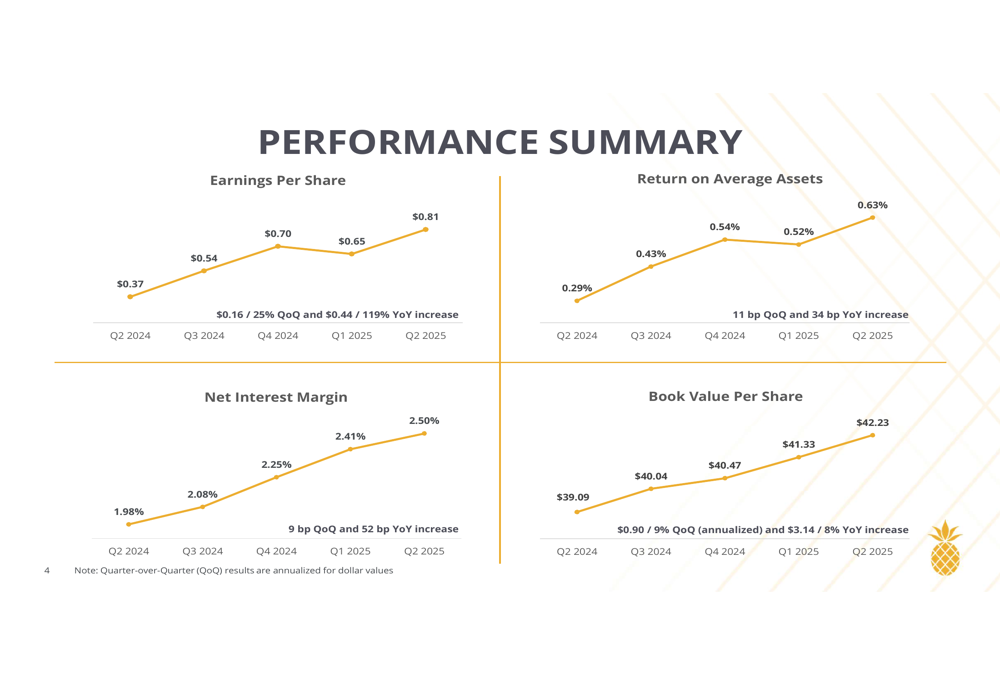
Southern First reported diluted earnings per share of $0.81 for Q2 2025, representing a substantial increase of 25% from the previous quarter and 119% year-over-year. The company’s return on average assets improved to 0.63%, up 11 basis points quarter-over-quarter and 34 basis points year-over-year.
The bank’s net interest margin continued its upward trajectory, reaching 2.50% in Q2 2025 compared to 2.41% in Q1 2025 and 1.98% in the same quarter last year. This 52 basis point year-over-year improvement has been a key driver of the bank’s enhanced profitability.
As shown in the following chart of quarterly performance metrics, Southern First has demonstrated consistent improvement across key indicators:
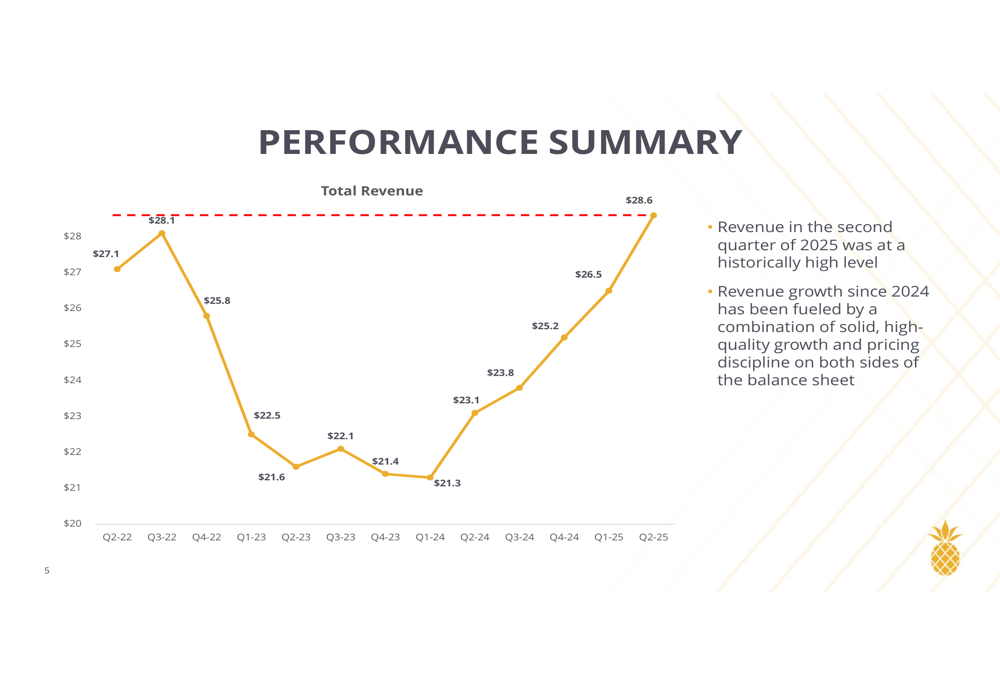
Total (EPA:TTEF) revenue reached $28.6 million in Q2 2025, representing a historically high level for the institution. The bank noted that revenue growth since 2024 has been fueled by "solid, high-quality growth and pricing discipline on both sides of the balance sheet."
Detailed Financial Analysis
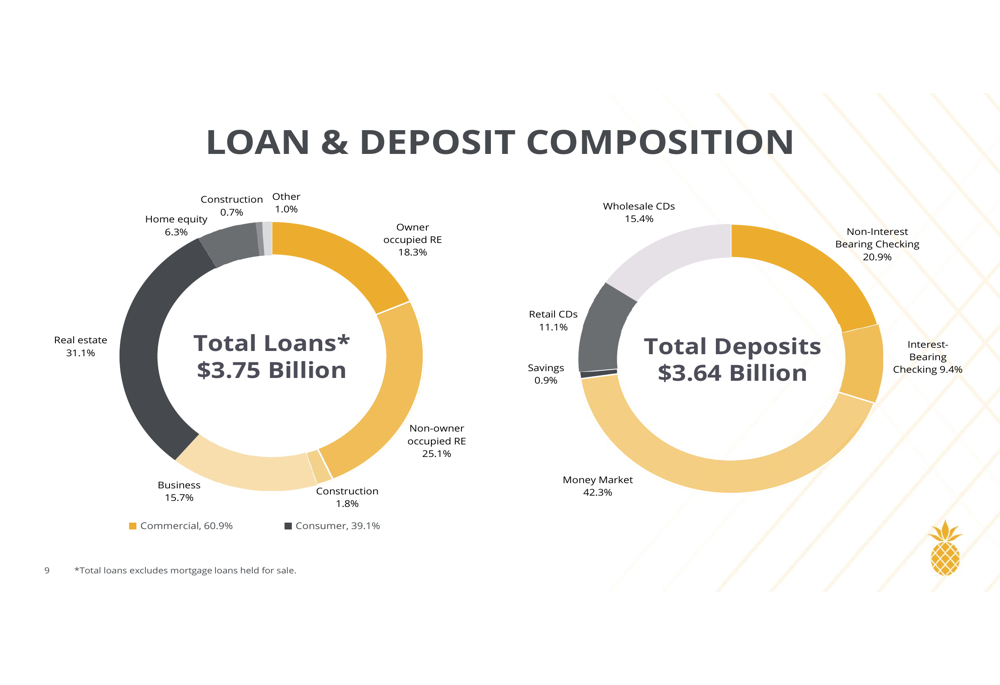
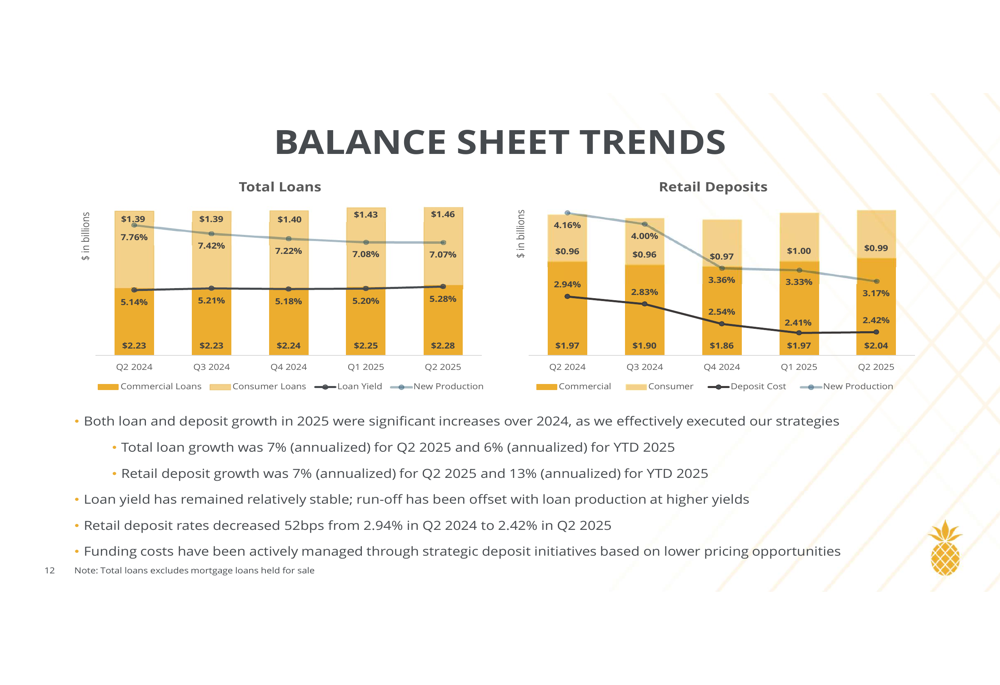
Southern First reported total assets of $4.3 billion as of Q2 2025, with total loans of $3.7 billion and total deposits of $3.6 billion. The bank achieved loan growth of 7% (annualized) from Q1 2025, while core deposits also grew at 7% (annualized) during the same period.
The bank’s loan portfolio remains well-diversified, with commercial loans comprising 60.9% of the total and consumer loans making up 39.1%. Within the commercial segment, non-owner occupied real estate represents the largest category at 25.1%, followed by owner-occupied real estate at 18.3%.
On the deposit side, money market accounts represent the largest funding source at 42.3% of total deposits, followed by non-interest bearing checking at 20.9%. Wholesale CDs account for 15.4% of deposits, with retail CDs at 11.1%.
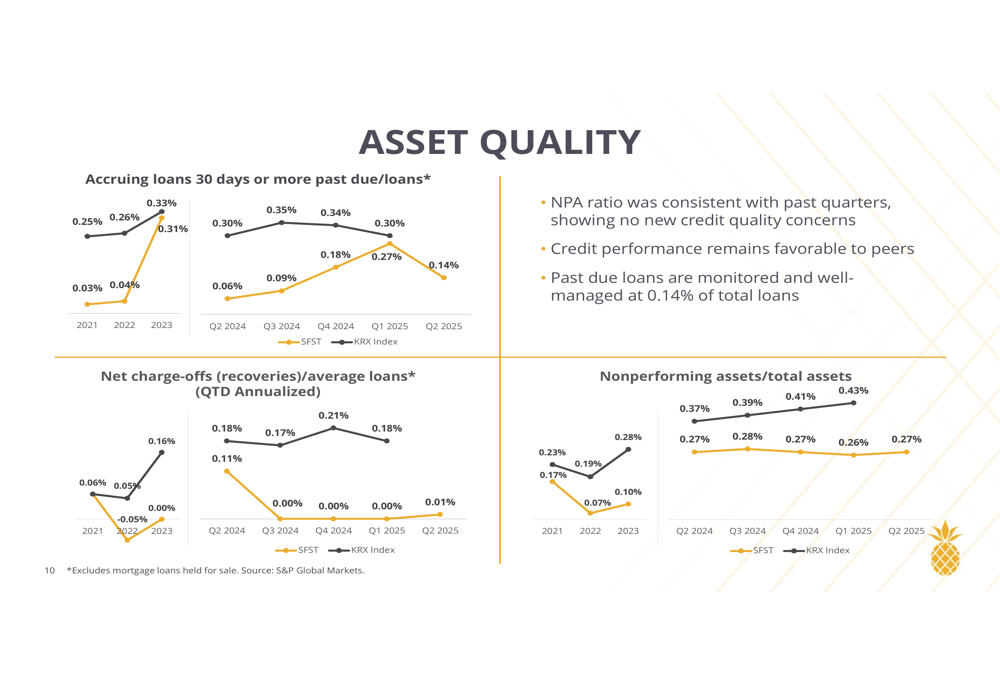
Asset quality metrics remain strong, with nonperforming assets to total assets at just 0.27% and past due loans to total loans at 0.14%. Net charge-offs were minimal at 0.01%, significantly outperforming industry peers.
The bank’s balance sheet is positioned favorably for the current interest rate environment. Loan yield has remained relatively stable at 7.07% in Q2 2025 compared to 7.08% in Q1 2025, while retail deposit costs have decreased significantly to 2.42% from 2.94% a year ago.
Strategic Initiatives
Southern First’s strategic focus on high-growth southeastern metropolitan markets appears to be paying dividends. The bank operates in markets with a weighted average projected population growth of 6.1%, substantially higher than the national average of 2.4%. Similarly, household income growth in these markets is projected at 7.7%, just below the national average of 8.8%.
The bank’s largest market by deposits is Greenville, SC, representing 48.72% of total deposits, followed by Charleston, SC at 19.96% and Atlanta, GA at 12.19%. Raleigh, NC, where the bank entered in 2016, shows the highest projected population growth at 7.4% and household income growth at 11.8%.
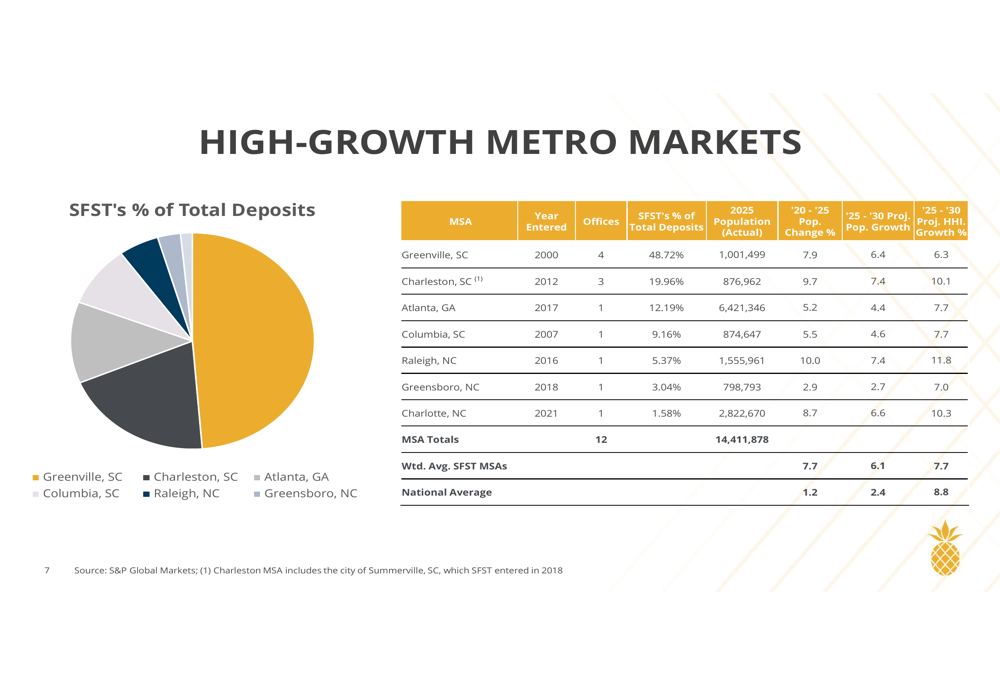
The bank maintains a branch-light footprint with just 12 banking offices across 8 markets, contributing to its efficient cost structure. This approach aligns with the company’s emphasis on "authentic relationship banking with 25 years of service excellence."
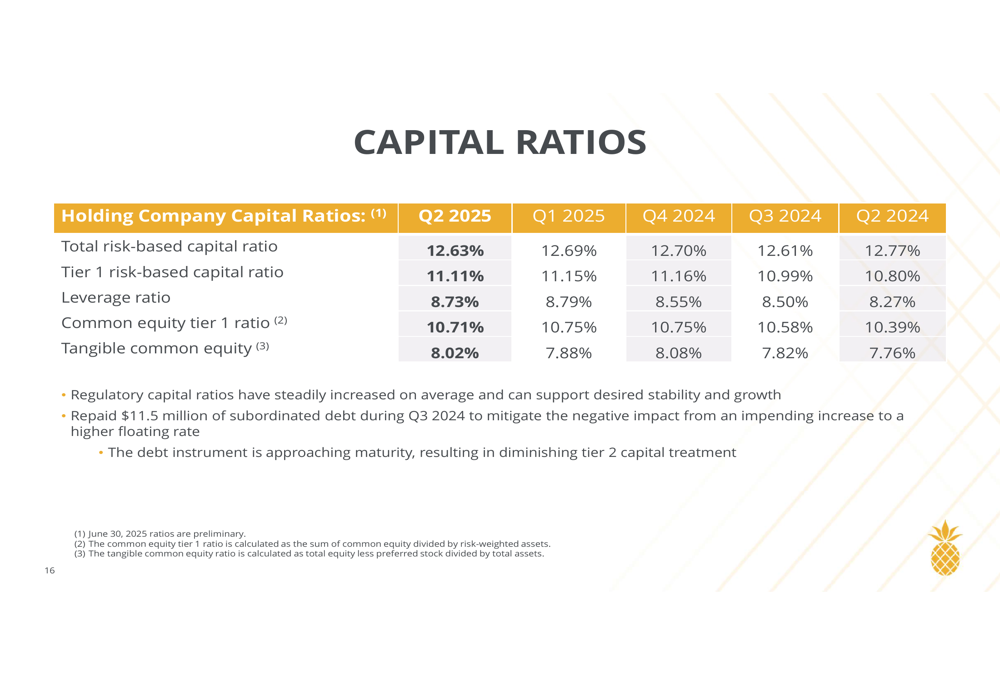
Southern First’s capital position remains solid, with a Tier 1 risk-based capital ratio of 11.11% and a tangible common equity ratio of 8.02% as of Q2 2025. These ratios have shown steady improvement compared to Q2 2024 levels of 10.80% and 7.76%, respectively.
Forward-Looking Statements
Looking ahead, Southern First highlighted several balance sheet repricing opportunities that could further enhance margins. Approximately $2.3 billion in deposits are expected to reprice through the remainder of 2025, while approximately $1.2 billion in assets will reprice during the same period.
Management emphasized its focus on "strengthening the balance sheet, balancing current earnings, executing prudent action, optimizing loan and deposit pricing, and reducing the loan-to-deposit ratio." The bank also remains committed to growing core deposits while maintaining its relationship banking approach and organic growth strategy.
The bank’s book value per common share reached $42.23 in Q2 2025, representing a 9% annualized increase from Q1 2025 and an 8% increase year-over-year. This consistent growth in tangible book value, combined with the bank’s improving profitability metrics, positions Southern First favorably as it continues to execute its strategic initiatives in high-growth markets.
Full presentation:
This article was generated with the support of AI and reviewed by an editor. For more information see our T&C.