Gold prices edge up amid Fed rate cut hopes; US-Russia talks awaited

Introduction & Market Context
SpartanNash Co (NASDAQ:SPTN) presented its first quarter 2025 financial results on May 29, highlighting record-breaking adjusted EBITDA and continued sales growth across its business segments. The grocery distributor and retailer, currently trading at $19.48 per share, reported solid performance metrics that align with the company’s long-term strategic transformation initiatives.
The presentation comes after SpartanNash beat Q4 2024 EPS expectations, which management had described as an "inflection point" for returning to growth. The Q1 results appear to validate this assessment, showing momentum in both wholesale and retail operations.
Quarterly Performance Highlights
SpartanNash reported net sales of $2.91 billion for Q1 2025, representing a 3.7% increase compared to the same period last year. The company achieved comparable store sales growth of 1.6% and generated $2.1 million in net earnings. Notably, SpartanNash delivered record-breaking adjusted EBITDA of $76.9 million and returned $8.0 million to shareholders during the quarter.
As shown in the following chart of quarterly highlights:
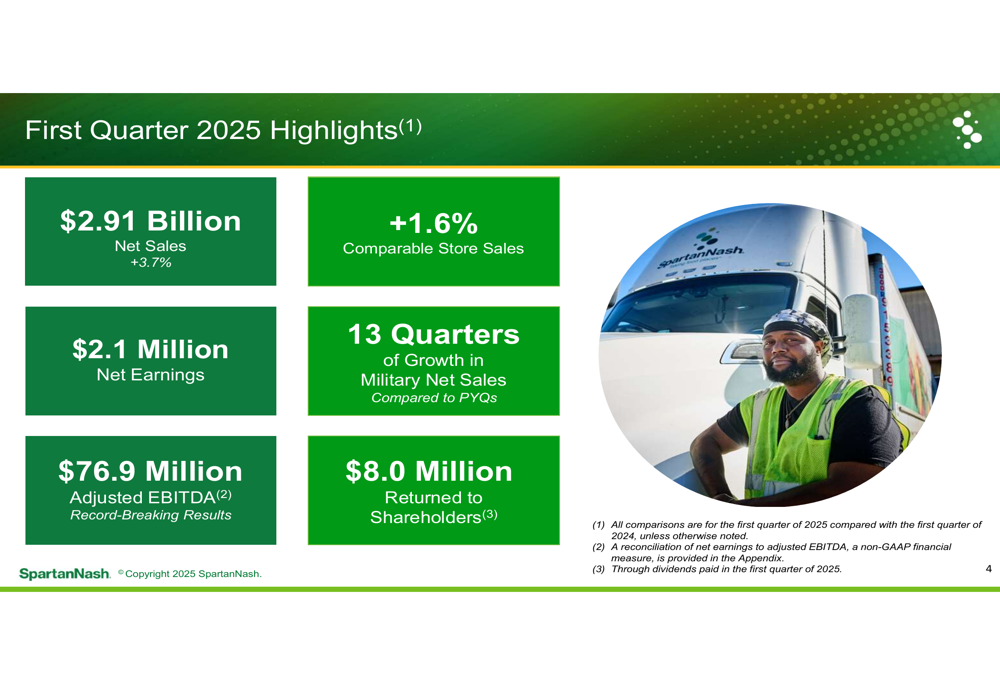
The company also highlighted its military business performance, marking 13 consecutive quarters of growth in military net sales compared to prior year quarters. This consistent performance in the military segment has become a reliable growth driver for SpartanNash.
Strategic Initiatives
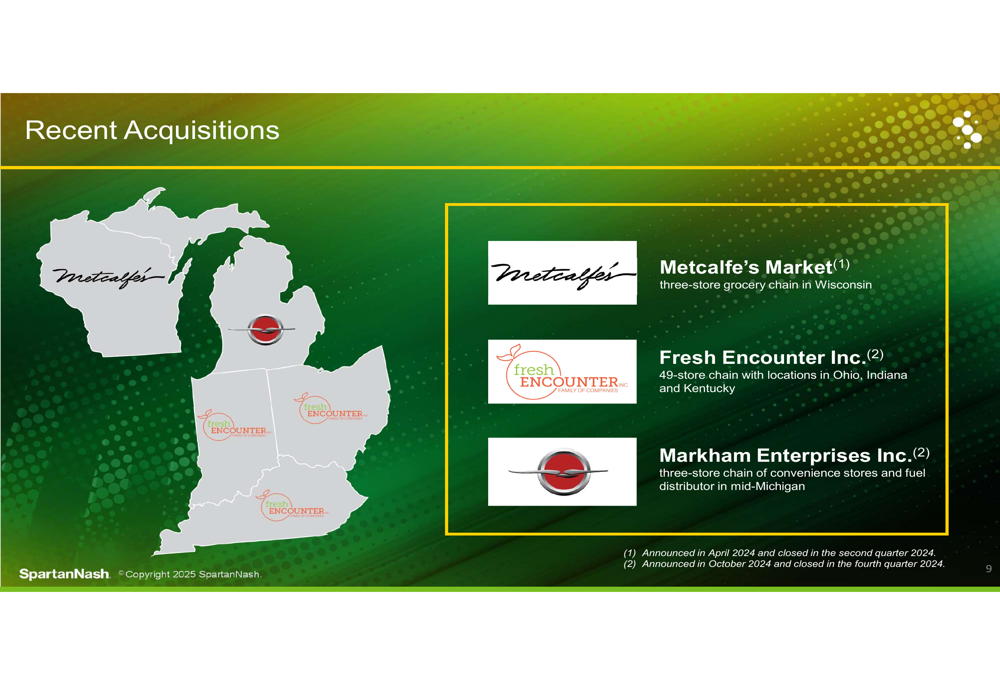
SpartanNash continues to execute its transformation plan through strategic acquisitions that expand its geographic footprint. The company recently completed three significant acquisitions: Metcalfe’s Market (a three-store grocery chain in Wisconsin), Fresh Encounter Inc. (a 49-store chain with locations in Ohio, Indiana, and Kentucky), and Markham Enterprises Inc. (a three-store chain of convenience stores and fuel distributor in mid-Michigan).
The following map illustrates the company’s recent acquisition activity and geographic expansion:
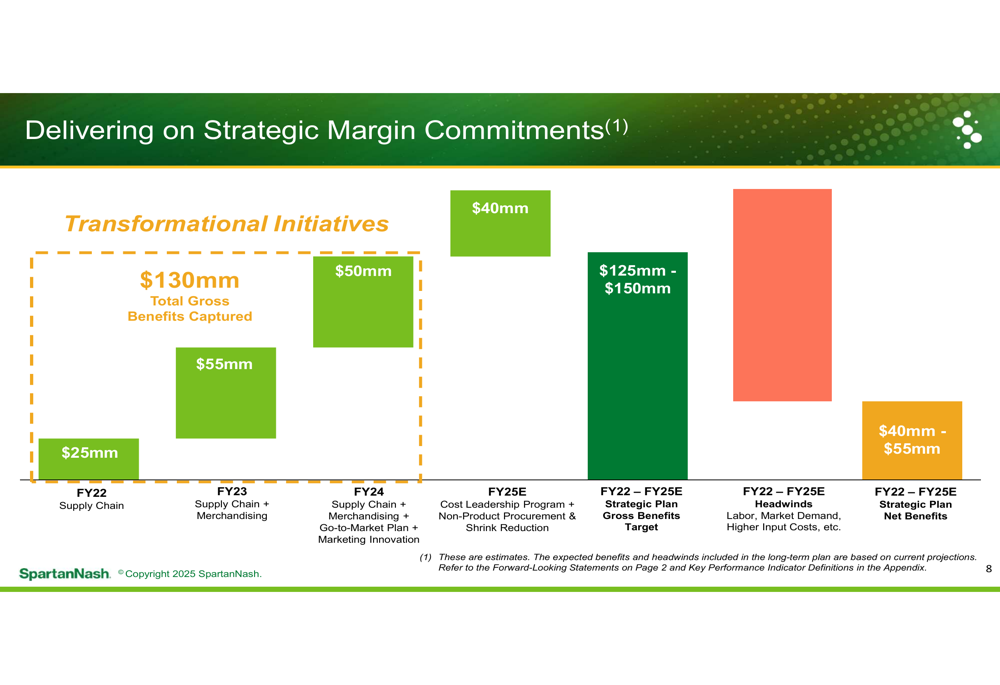
The company is also making significant progress on its margin improvement initiatives. SpartanNash has captured approximately $130 million in gross benefits through various transformation programs since FY2022, including supply chain optimization, merchandising improvements, and cost leadership initiatives.
The strategic margin commitments are illustrated in this waterfall chart:
Additionally, SpartanNash is enhancing its customer experience through several initiatives focused on digital engagement, personalization, and local partnerships. The company is leveraging data insights to create more engaging shopping experiences both online and in-store.
These shopper experience enhancements are visualized here:

Forward-Looking Statements
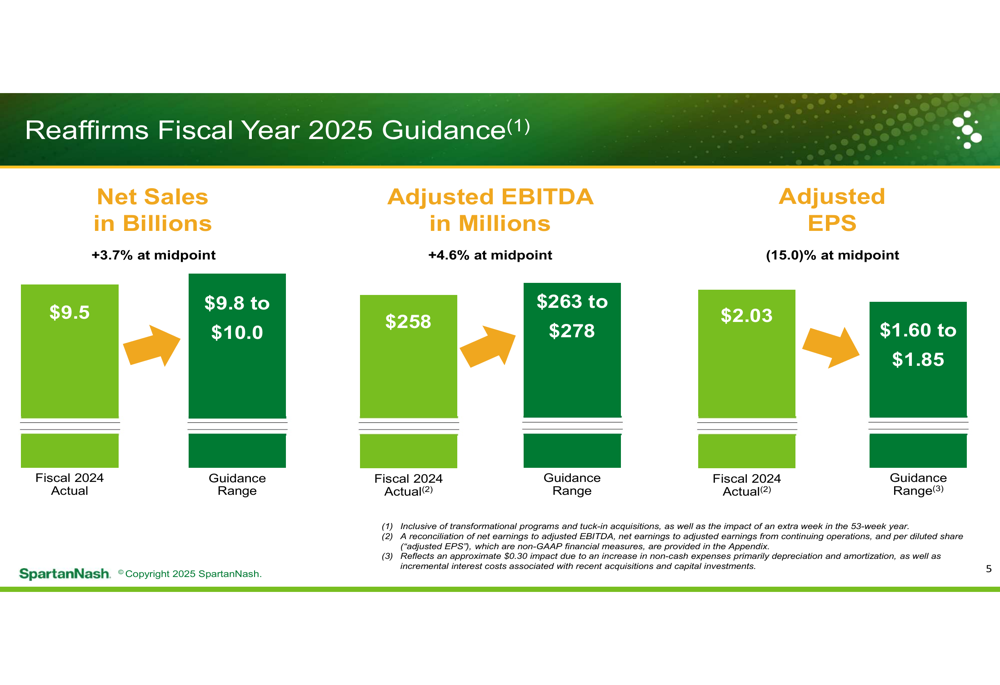
SpartanNash reaffirmed its fiscal year 2025 guidance, projecting net sales between $9.8 billion and $10.0 billion, representing 3.7% growth at the midpoint compared to FY2024. The company expects adjusted EBITDA between $263 million and $278 million (4.6% growth at midpoint) and adjusted EPS between $1.60 and $1.85 (15.0% growth at midpoint).
The guidance includes the impact of transformational programs, tuck-in acquisitions, and an extra week in the fiscal year, as illustrated in the following chart:
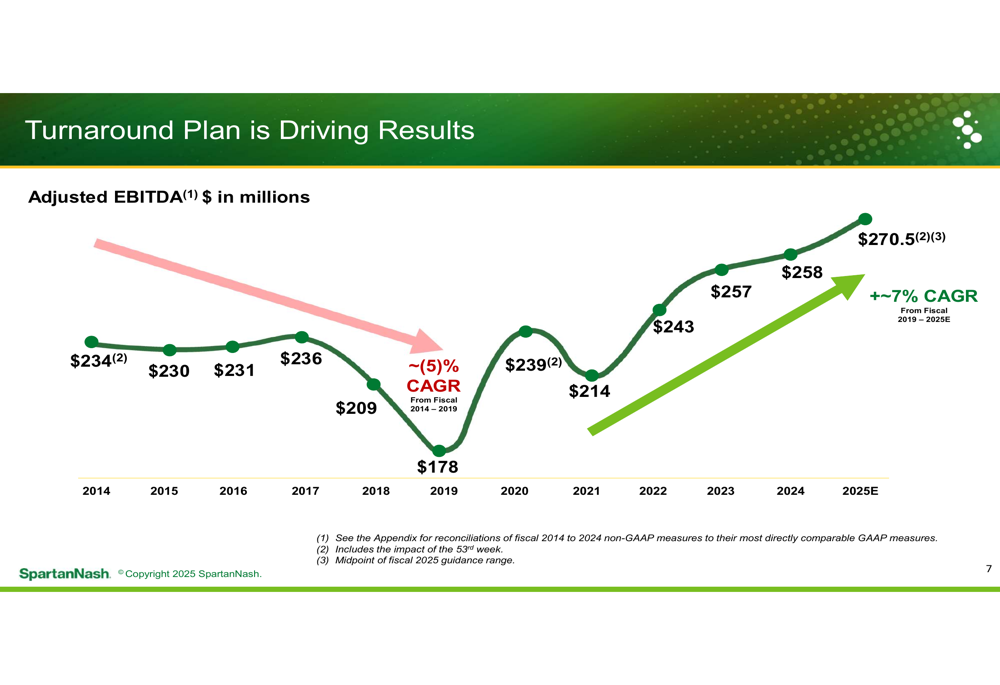
The company’s long-term adjusted EBITDA trend shows significant improvement since 2019, with a compound annual growth rate (CAGR) of approximately 7% from FY2019 to the FY2025 estimate, compared to a negative 5% CAGR from FY2014 to FY2019. This positive trajectory reflects the success of SpartanNash’s strategic initiatives.
The adjusted EBITDA growth trend is visualized here:
Financial Position
SpartanNash presented a balanced approach to capital allocation, with priorities including debt repayment (55%), capital expenditures and IT investments (15%), dividends and share repurchases (23%), and acquisitions (7%). The company has allocated over $1.046 billion in capital between FY2020 and Q1 2025.
The capital allocation breakdown is illustrated in this chart:
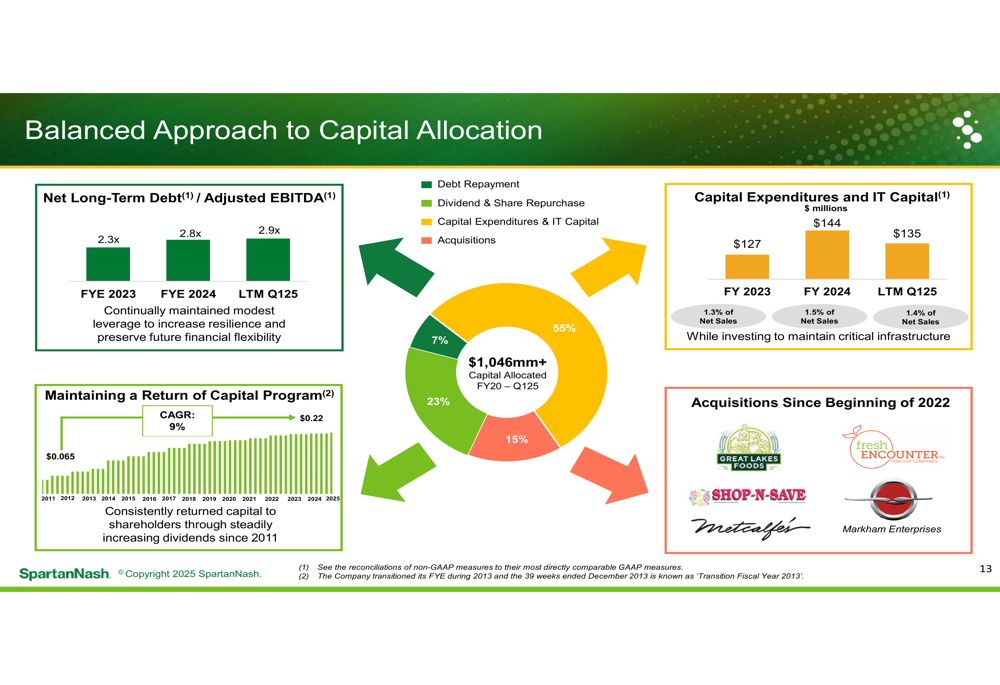
The company’s leverage ratio, measured as Net Long-Term Debt to Adjusted EBITDA, stands at 2.9x as of Q1 2025, up slightly from 2.8x at the end of FY2024 and 2.3x at the end of FY2023. This increase reflects the company’s recent acquisition activity, with total debt reaching $777 million as of April 19, 2025.
SpartanNash continues to return value to shareholders through its dividend program, which has shown a 9% CAGR, with the most recent quarterly dividend at $0.22 per share. This aligns with the information from the previous earnings report, which noted that the company had raised its dividend for 14 consecutive years.
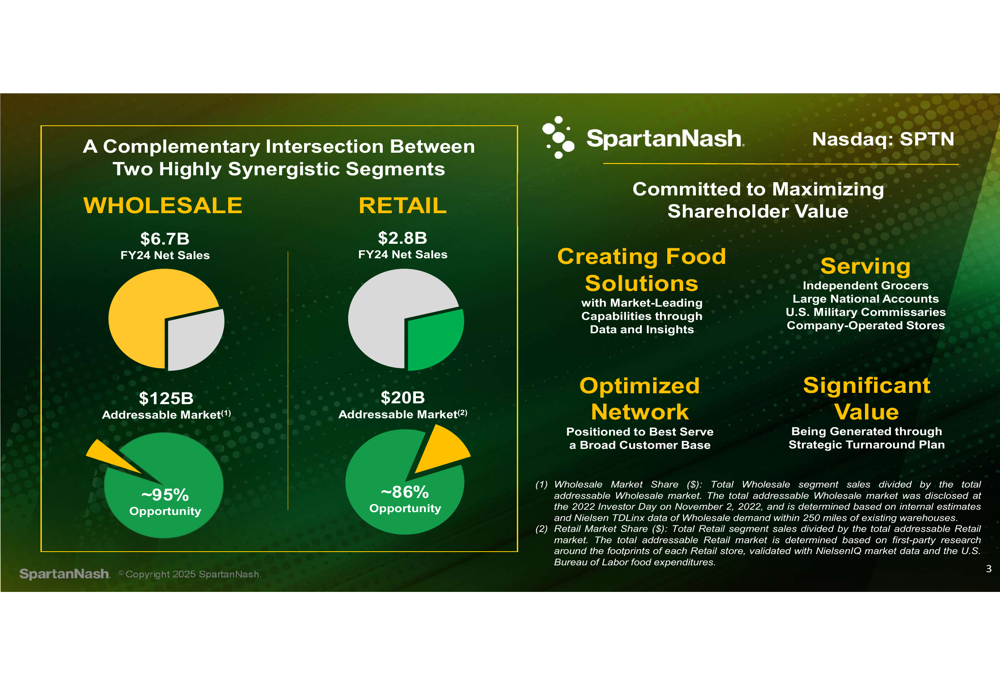
SpartanNash’s business model leverages the synergies between its wholesale and retail segments, with the wholesale segment representing $6.7 billion in FY2024 net sales and addressing a $125 billion market opportunity, while the retail segment generated $2.8 billion in FY2024 net sales within a $20 billion addressable market.
The company’s segment overview and addressable markets are shown here:
As SpartanNash continues to execute its strategic transformation plan, the Q1 2025 results demonstrate progress toward its long-term objectives of sustainable growth, margin expansion, and shareholder value creation.
Full presentation:
This article was generated with the support of AI and reviewed by an editor. For more information see our T&C.