One & One Green Technologies stock soars 100% after IPO debut

Introduction & Market Context
S&T Bancorp Inc (NASDAQ:STBA) released its first quarter 2025 earnings presentation on April 24, 2025, revealing solid performance with improved margins and continued growth in both loans and deposits. The Pennsylvania-based regional bank reported earnings per share of $0.87, slightly above the previous quarter’s $0.86, as the company continues to navigate a challenging interest rate environment.
The bank’s stock closed at $36.19 on the day of the announcement, down 1.51% from the previous session, but remains well above its 52-week low of $29.85. S&T Bancorp’s performance in Q1 2025 demonstrates the company’s ability to maintain profitability while positioning itself for future growth.
Quarterly Performance Highlights
S&T Bancorp reported net income of $33.4 million for Q1 2025, with a return on assets (ROA) of 1.41% and return on equity (ROE) of 9.67%. The bank’s return on tangible equity (ROTE) reached 13.29%, reflecting strong earnings generation relative to its capital base.
As shown in the following quarterly overview chart:
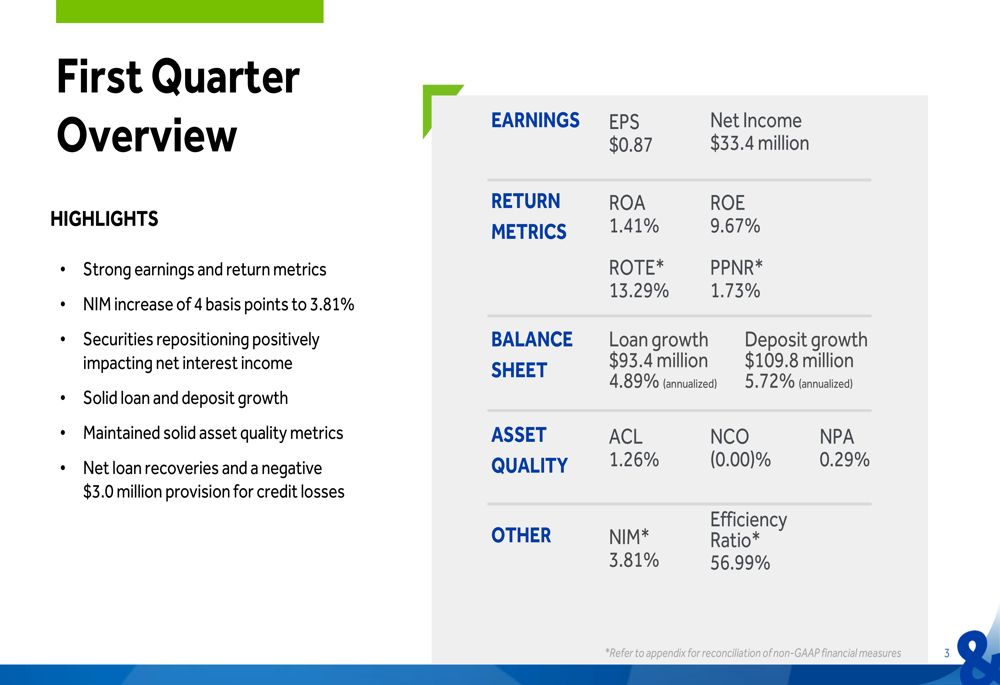
Key highlights from the quarter include a 4 basis point increase in net interest margin (NIM) to 3.81%, solid loan growth of $93.4 million (4.89% annualized), and deposit growth of $109.8 million (5.72% annualized). The bank also maintained strong asset quality metrics with a negative provision for credit losses of $3.0 million, reflecting net loan recoveries during the quarter.
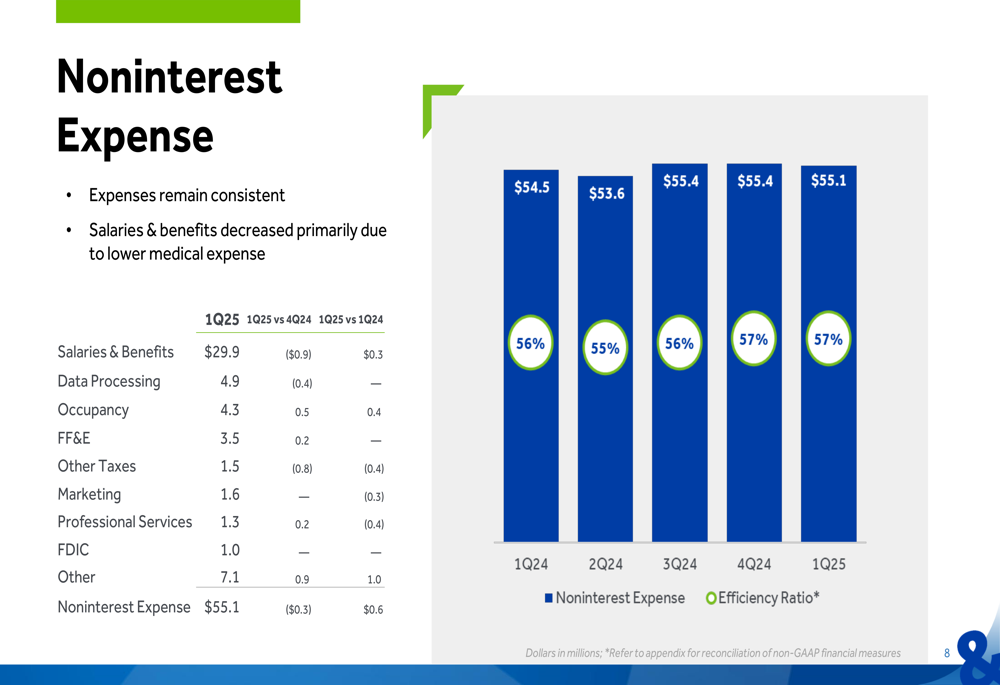
The efficiency ratio remained stable at 56.99%, indicating consistent operational discipline. This performance builds on the momentum from Q4 2024, when the company exceeded earnings expectations despite revenue challenges.
Balance Sheet and Asset Quality
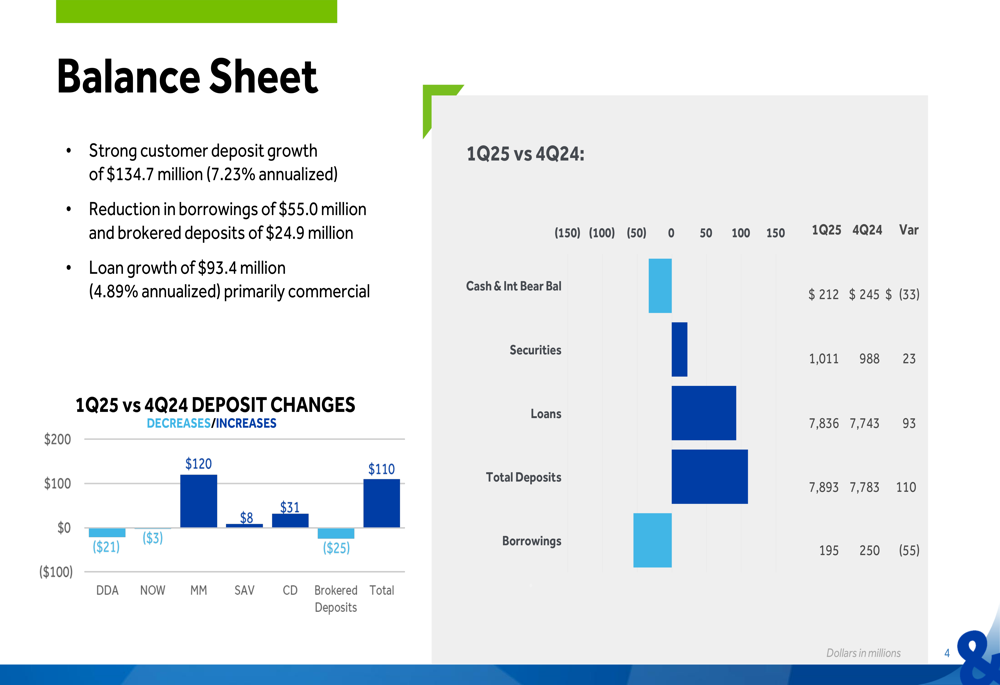
S&T Bancorp demonstrated strong customer deposit growth of $134.7 million (7.23% annualized) in Q1 2025, while simultaneously reducing higher-cost funding sources. The bank decreased borrowings by $55.0 million and reduced brokered deposits by $24.9 million, reflecting a strategic shift toward more stable and cost-effective funding.
The following chart illustrates the deposit composition changes:
On the asset quality front, S&T Bancorp continued to show improvement. The allowance for credit losses (ACL) decreased by 5 basis points to 1.26% compared to 1.31% at the end of 2024, primarily due to a $4.2 million decline in specific reserves. Nonperforming assets (NPAs) decreased 7 basis points to 0.29% of total portfolio loans plus other real estate owned (OREO).
The trend in asset quality metrics is illustrated in the following chart:
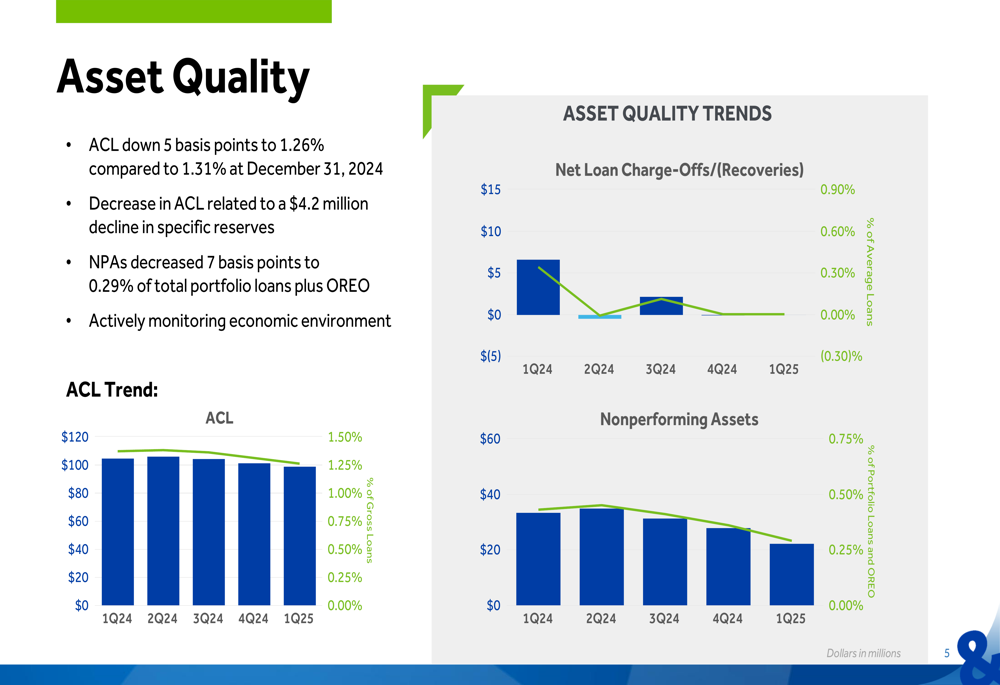
This continued improvement in asset quality metrics provides S&T Bancorp with additional flexibility in capital allocation and reflects the bank’s prudent risk management practices.
Net Interest Income and Margin
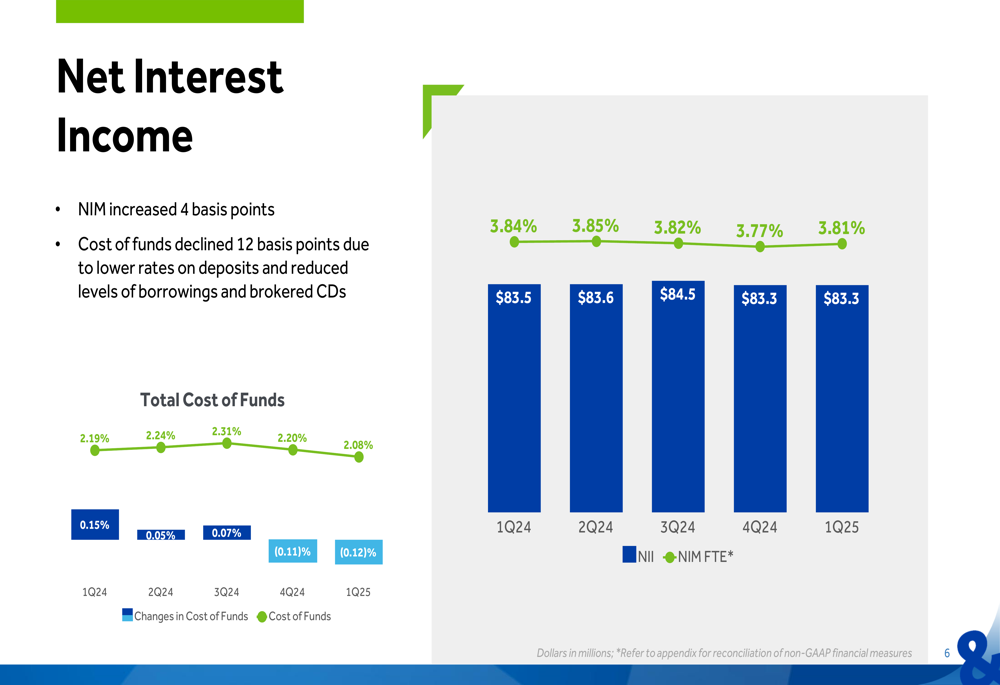
One of the most significant developments in Q1 2025 was the improvement in S&T Bancorp’s net interest margin, which increased 4 basis points to 3.81%. This improvement was driven by a 12 basis point decline in the cost of funds, which fell to 2.08% due to lower rates on deposits and reduced levels of borrowings and brokered CDs.
The following chart shows the trend in cost of funds and net interest income:
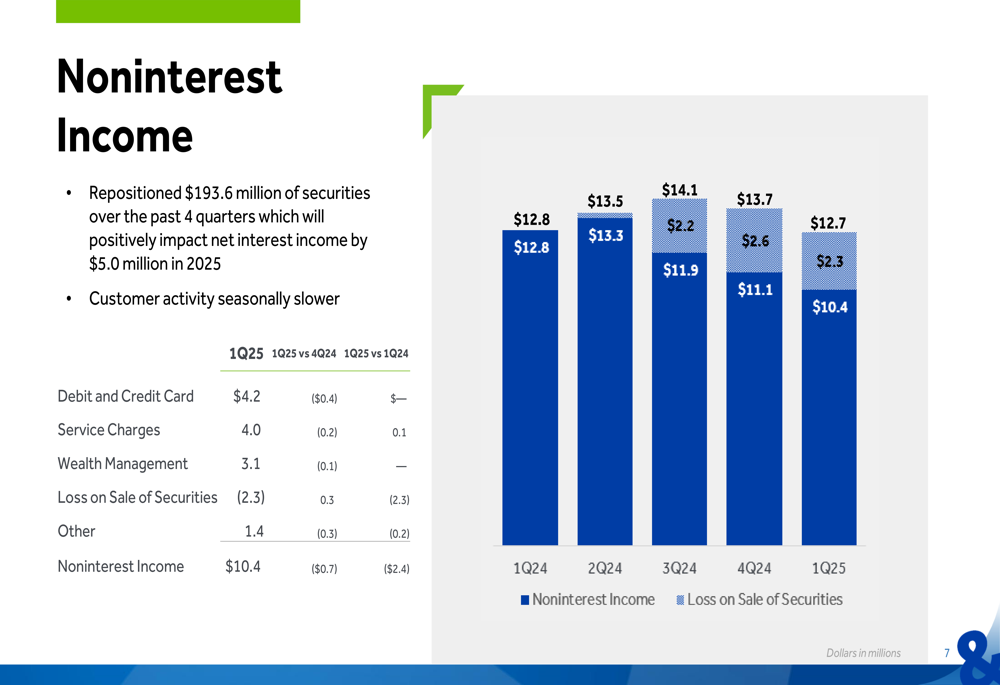
The bank has been actively repositioning its securities portfolio, having repositioned $193.6 million of securities over the past four quarters. Management expects this strategy to positively impact net interest income by $5.0 million in 2025, helping to offset some of the pressure on margins from the competitive rate environment.
The noninterest income segment showed some seasonal weakness, with total noninterest income of $10.4 million, down $0.7 million from the previous quarter. This included a $2.3 million loss on sale of securities, which was part of the strategic repositioning effort.
Noninterest expenses remained well-controlled at $55.1 million, a slight decrease of $0.3 million from the previous quarter. Salaries and benefits decreased by $0.9 million, primarily due to lower medical expenses.
Capital Position and Outlook
S&T Bancorp maintained strong capital levels in Q1 2025, with all regulatory capital ratios well above the "well-capitalized" thresholds. The tangible common equity to tangible assets (TCE/TA) ratio improved to 11.16% from 10.82% in the previous quarter, driven by lower accumulated other comprehensive income (AOCI) losses and strong earnings.
The following chart illustrates the trend in the TCE/TA ratio:
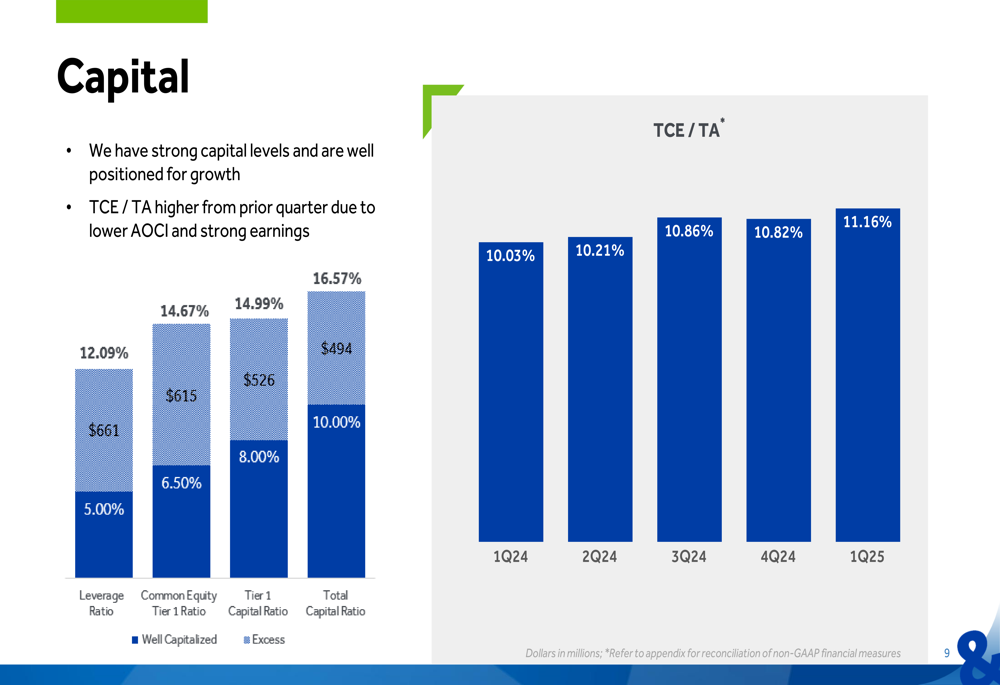
The bank’s strong capital position provides a solid foundation for continued organic growth and potentially for strategic opportunities. This aligns with management’s previous guidance from Q4 2024, which projected mid-single-digit loan growth in the first half of 2025 and high mid-single-digit growth for the full year.
The Q1 2025 results suggest S&T Bancorp is on track to meet these projections, with annualized loan growth of 4.89% in the first quarter. The improvement in net interest margin to 3.81% also aligns with the company’s goal of stabilizing margins, which they previously indicated would be around 3.70%.
Overall, S&T Bancorp’s Q1 2025 performance demonstrates the bank’s ability to execute on its strategic initiatives while maintaining strong profitability and asset quality metrics in a challenging operating environment. The focus on core deposit growth, disciplined expense management, and strategic balance sheet optimization positions the bank well for continued success throughout 2025.
Full presentation:
This article was generated with the support of AI and reviewed by an editor. For more information see our T&C.