Apple iPhone17: Could Google be the real winner?

Introduction & Market Context
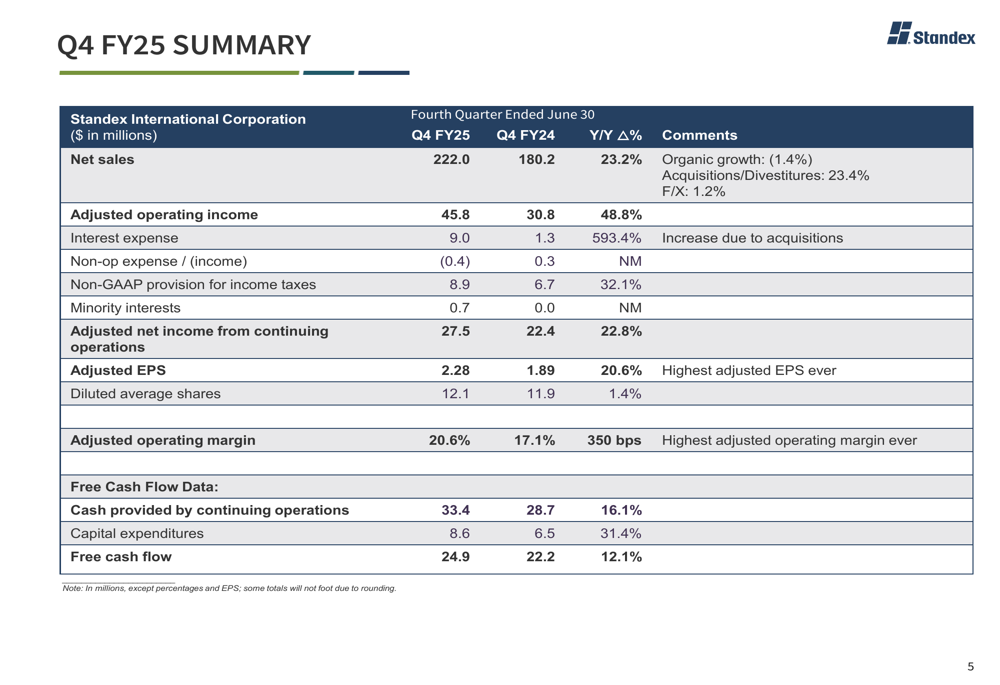
Standex International Corporation (NYSE:SXI) presented its fourth quarter and fiscal year 2025 results on August 1, 2025, showcasing strong performance primarily driven by strategic acquisitions. The company reported quarterly revenue of $222 million, representing a 23.2% year-over-year increase and exceeding analyst expectations of $214.44 million. Following the announcement, Standex shares rose 5.25% to $164.74, reflecting investor confidence in the company’s growth strategy.
The industrial manufacturer reported adjusted earnings per share of $2.28, surpassing market forecasts of $2.10 and marking a 20.6% increase from the previous year. This performance comes as Standex continues its transformation toward higher-growth markets while maintaining a disciplined acquisition strategy.
As shown in the following summary of key messages from the quarter:
Quarterly Performance Highlights
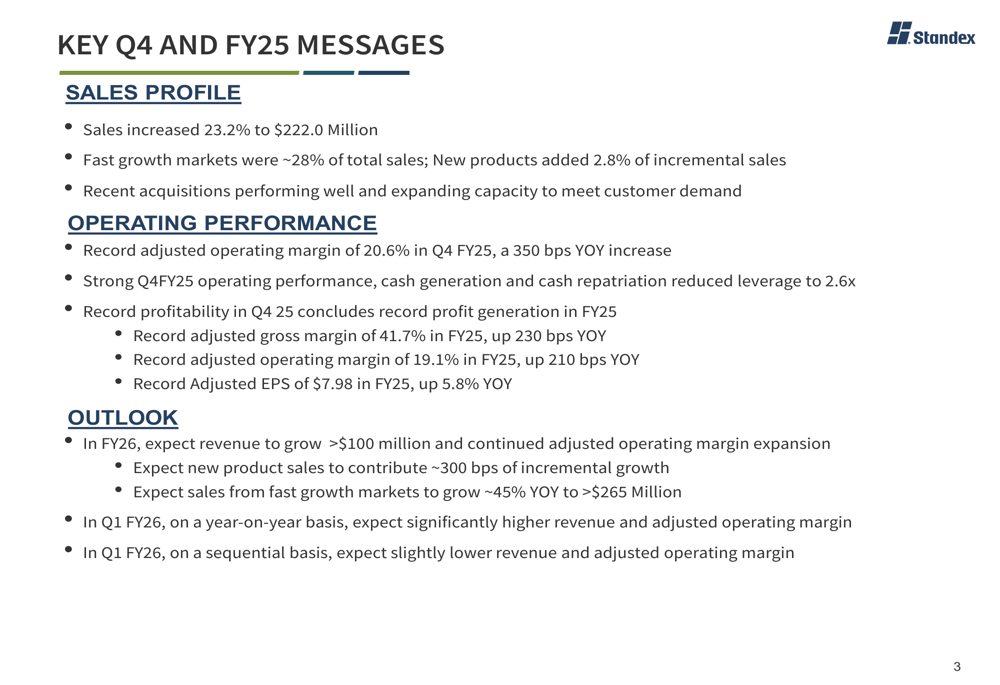
Standex achieved record profitability in Q4 FY25, with adjusted operating margin reaching 20.6%, a significant 350 basis point improvement year-over-year. While acquisitions contributed 23.4% to overall growth, organic sales declined slightly by 1.4%, partially offset by favorable currency effects of 1.2%.
The company generated $33.4 million in cash from operations during the quarter, resulting in free cash flow of $24.9 million. This strong cash generation supported Standex’s strategic initiatives while maintaining financial discipline.
The following slide provides a comprehensive breakdown of Q4 FY25 financial results:
Segment Performance Analysis
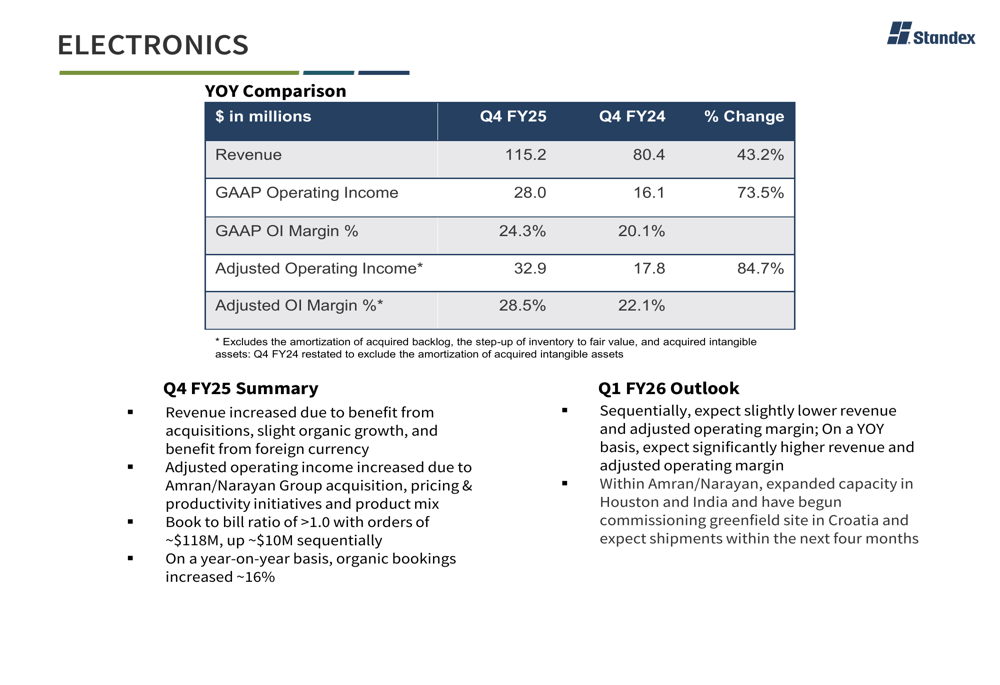
The Electronics segment emerged as the standout performer, with revenue increasing 43.2% year-over-year to $115.2 million, primarily driven by acquisitions (41.0% contribution). Adjusted operating income for this segment surged 84.7% to $32.9 million, resulting in an impressive 28.5% operating margin. Management expects slightly lower sequential performance in Q1 FY26 but anticipates significantly higher year-over-year results.
The Engineering Technologies segment also showed strong growth, with revenue up 26.8% to $32.0 million and adjusted operating income increasing 11.8% to $5.9 million. This growth was primarily organic, reflecting increased demand in the aerospace and defense sectors.
Other segments showed mixed results, with Scientific revenue growing 2.3% to $17.9 million but experiencing a 16.1% decline in adjusted operating income. Engraving revenue remained relatively flat with a 0.6% increase to $33.0 million, while Specialty Solutions saw a slight 1.2% revenue decline to $23.9 million.
The following image illustrates the performance of the Electronics segment, which now represents over 50% of the company’s total revenue:
Strategic Growth Initiatives
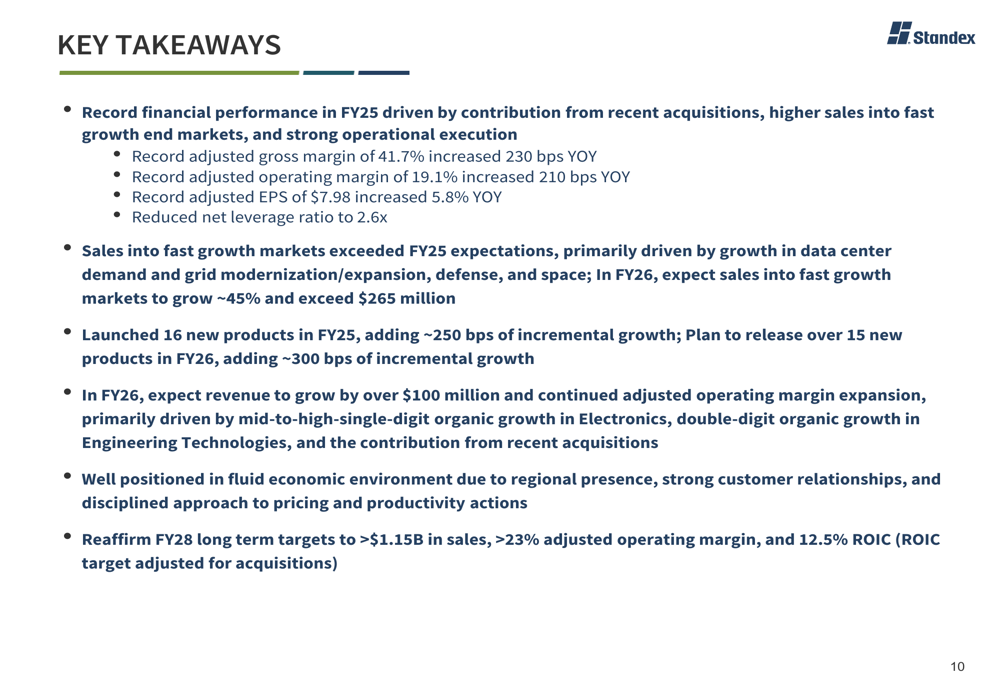
Standex outlined several key growth drivers expected to fuel future performance. The company launched 16 new products in FY25, contributing approximately 250 basis points of incremental growth, and plans to release over 15 new products in FY26, which are expected to add around 300 basis points to growth.
The company’s focus on fast-growth markets continues to gain momentum, with these markets now representing approximately 28% of total sales. Management expects fast-growth market sales to increase by approximately 45% in FY26, exceeding $265 million.
Recent acquisitions, including AMRAN and McSTARLITE, are performing well and strengthening Standex’s market position, particularly in Europe. These strategic initiatives are illustrated in the following slide:
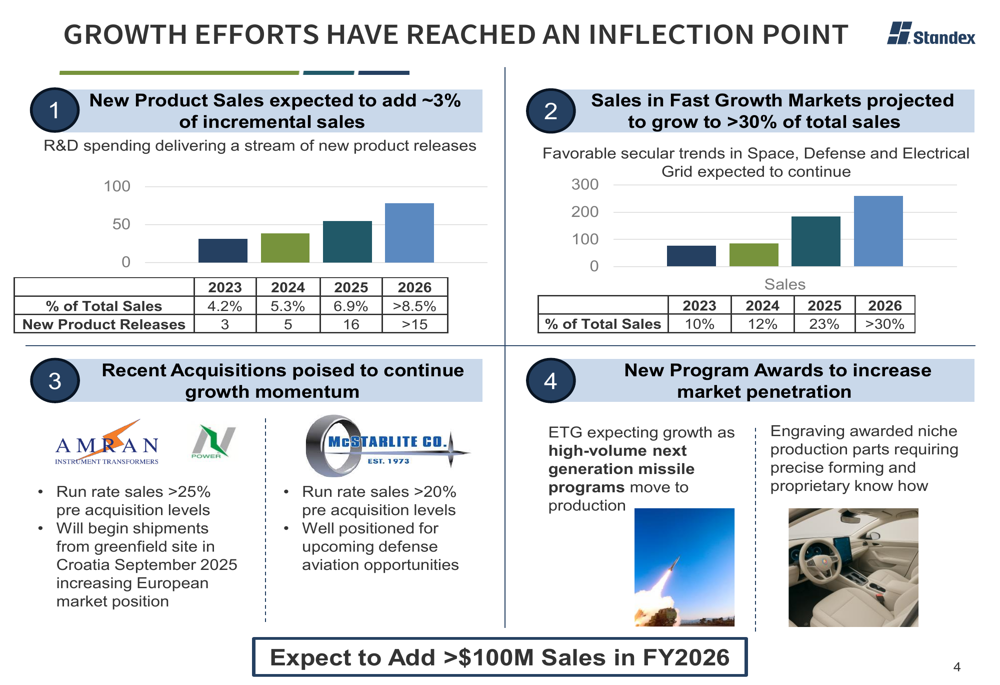
The company’s growth strategy appears to be at an inflection point, with management expecting to add over $100 million in sales during FY26. This growth will be driven by a combination of new product introductions, expansion in fast-growth markets, contribution from recent acquisitions, and new program awards, particularly in the missile programs within the Engineering Technologies segment.
Financial Position & Outlook
Standex’s balance sheet remains solid despite recent acquisition activity. As of June 30, 2025, the company reported total debt of $552.5 million and cash of $104.5 million, resulting in net debt of $448.0 million. The net debt to adjusted EBITDA ratio stood at 2.6x, and the net debt to capital ratio was 38.6%.
Looking ahead, management reaffirmed its long-term FY28 targets of achieving over $1.15 billion in sales, an adjusted operating margin exceeding 23%, and a return on invested capital of 12.5% (adjusted for acquisitions). For FY26, the company expects revenue to grow by over $100 million with continued margin expansion.
The following key takeaways summarize Standex’s performance and outlook:
For Q1 FY26, Standex anticipates sequential performance to be slightly lower in the Electronics segment but expects improvement in Engineering Technologies. The Scientific segment is projected to see sequential improvement, while Engraving and Specialty Solutions are expected to maintain similar revenue levels with slightly higher margins.
Standex’s transformation strategy appears to be yielding results, with CEO David Dunbar noting in the earnings call that "We are a different company than we were even a year ago." The company’s strategic focus on high-growth markets, new product development, and disciplined acquisitions positions it well for continued growth despite challenging macroeconomic conditions.
Full presentation:
This article was generated with the support of AI and reviewed by an editor. For more information see our T&C.