Street Calls of the Week

Introduction & Market Context
Stantec Inc (NYSE:STN) released its second quarter 2025 results on August 14, 2025, showcasing solid performance across all regions and business lines. The global design and consulting firm reported significant growth in key financial metrics while continuing its strategic expansion through acquisitions.
The company’s stock closed at $109.18 on August 13, 2025, near its 52-week high of $113.50, reflecting investor confidence in Stantec’s business model and growth trajectory. After-hours trading showed a slight increase of 0.41%, suggesting positive market reception to the upcoming results.
Quarterly Performance Highlights
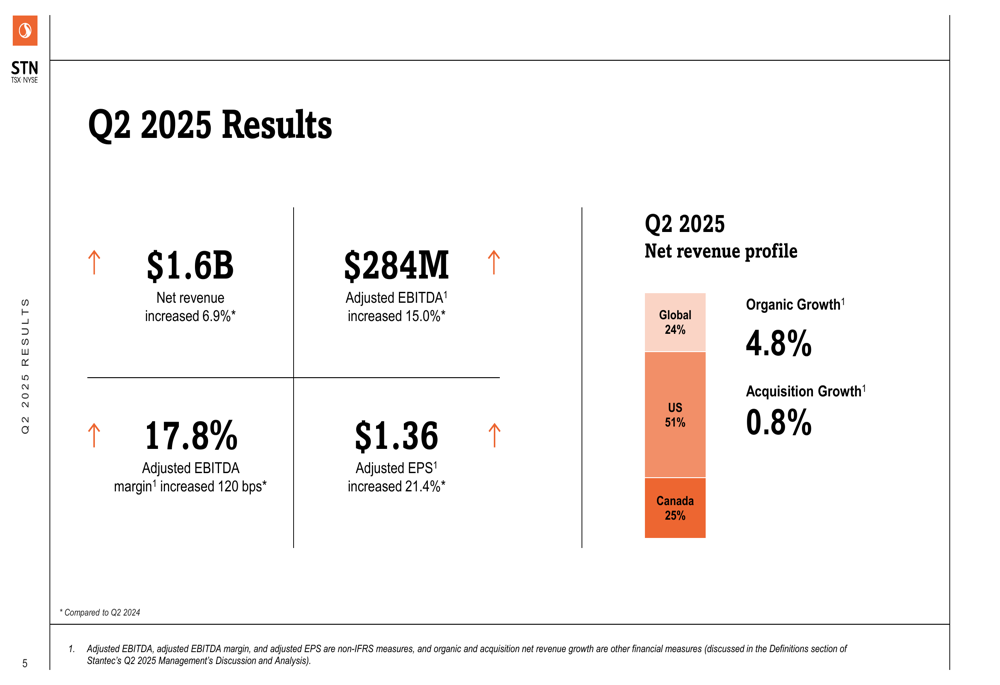
Stantec delivered strong financial results in Q2 2025, with net revenue reaching $1.6 billion, representing a 6.9% increase compared to the same period last year. This growth was driven by a combination of organic expansion (4.8%) and acquisition activity (0.8%).
The company’s profitability metrics showed even more impressive gains, with adjusted EBITDA climbing 15.0% to $284 million and adjusted EBITDA margin expanding 120 basis points to 17.8%. Adjusted earnings per share grew 21.4% to $1.36, outpacing revenue growth and indicating improved operational efficiency.
As shown in the following comprehensive financial results chart:
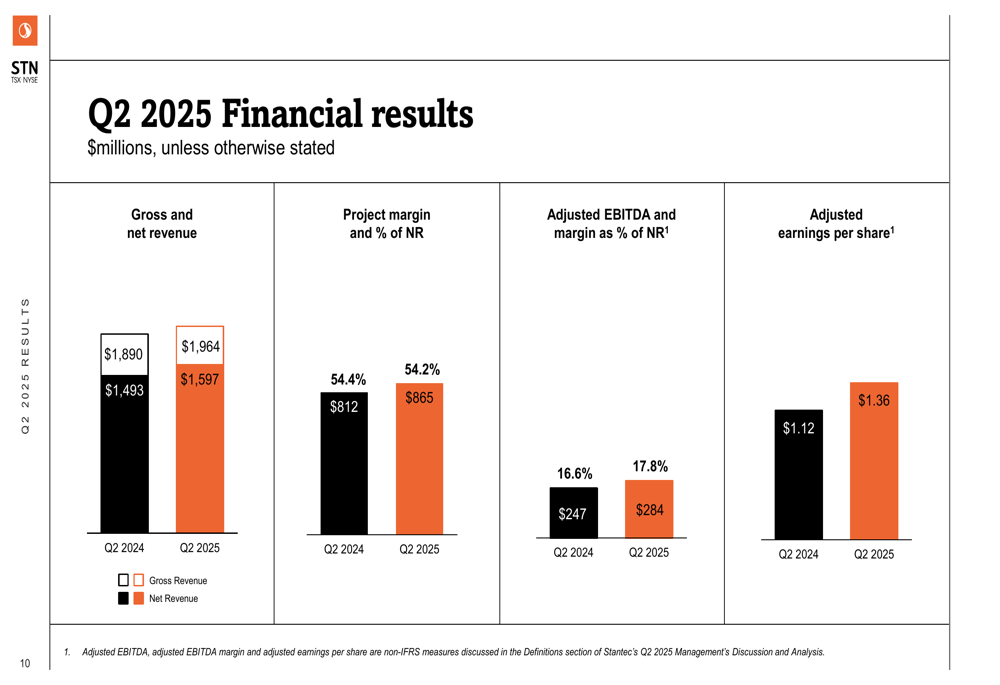
The company’s project margin remained relatively stable at 54.2% of net revenue (compared to 54.4% in Q2 2024), while the absolute value increased from $812 million to $865 million, reflecting Stantec’s ability to maintain pricing discipline while growing its business.
Regional Performance Analysis
Stantec’s revenue profile is well-diversified geographically, with 51% coming from the United States, 25% from Canada, and 24% from Global operations. All regions contributed to the company’s growth in Q2 2025.
The U.S. segment saw net revenue increase by 5.7% to $820 million, with organic growth of 4.4%. Key drivers included the Buildings sector (mission critical, science and technology, and civic projects), Environmental Services (energy transition, mining, and infrastructure), and Water (public sector water supply and wastewater treatment projects).
Canadian operations delivered 6.2% revenue growth to $394 million, entirely organic. The Water segment was particularly strong, with wastewater solutions contributing to over 30% organic growth. Infrastructure projects in Alberta land development and eastern Canada transit/rail, along with Quebec airport projects, also supported growth in the region.
Global operations posted the strongest growth at 10.5%, reaching $383 million in net revenue. This included 4.3% organic growth and 3.6% from acquisitions. The company’s industry-leading Water business delivered double-digit organic growth internationally, while projects in Chile and Peru drove double-digit growth in Energy & Resources, and German Infrastructure projects also saw double-digit organic growth.
The following overview illustrates Stantec’s key financial metrics and regional revenue breakdown:
Strategic Acquisitions and Growth
Stantec continues to execute its growth strategy through strategic acquisitions. During the quarter and shortly after, the company completed three significant acquisitions:
1. Page acquisition (closed July 31, 2025) - A 1,400-person US-based architecture and engineering firm headquartered in Washington, DC
2. Cosgroves (acquired June 27, 2025) - A 90-person firm in New Zealand, expanding Stantec’s buildings engineering capabilities in the region
3. Ryan Hanley (acquired April 8, 2025) - A 150-person engineering and environmental consultancy firm in Ireland, strengthening the company’s offering in the Irish water sector
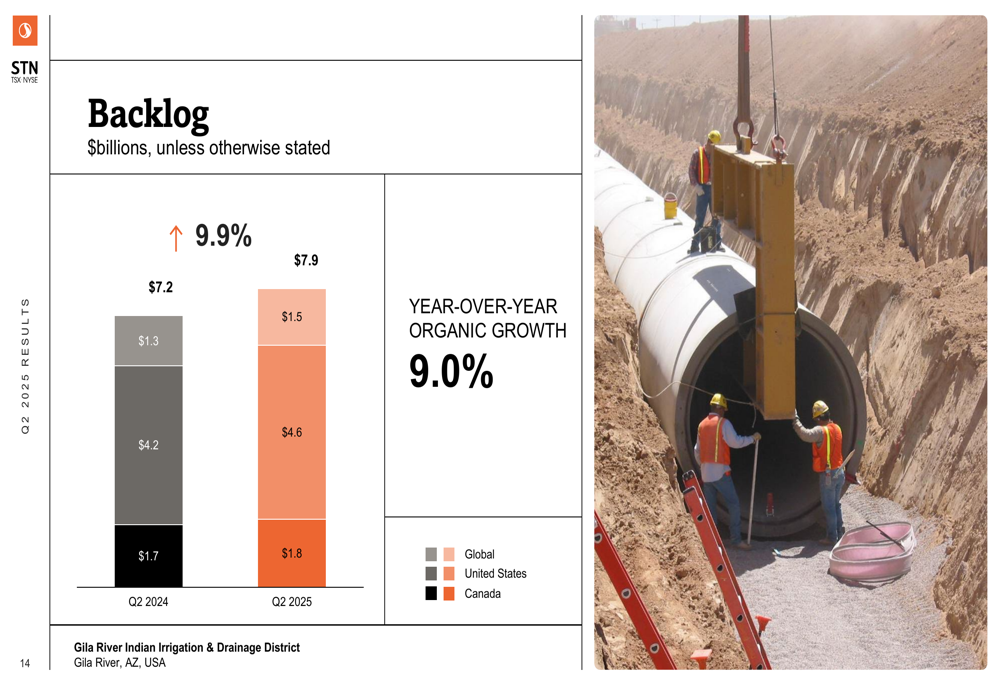
With these acquisitions, Stantec’s global team has grown to over 34,000 employees, enhancing its capabilities and geographic reach. The company’s backlog also reflects this growth trajectory, increasing by 9.9% year-over-year to $7.9 billion, with 9.0% organic growth.
The following chart illustrates the company’s growing backlog:
Stantec also secured several major project awards in the quarter, including a US$150 million contract supporting the US Navy’s Shipyard Infrastructure Optimization Program, a four-year framework with Transport for Greater Manchester, and a collaboration with Google on a Water Replenishment Project in Taiwan.
Financial Position and Capital Structure
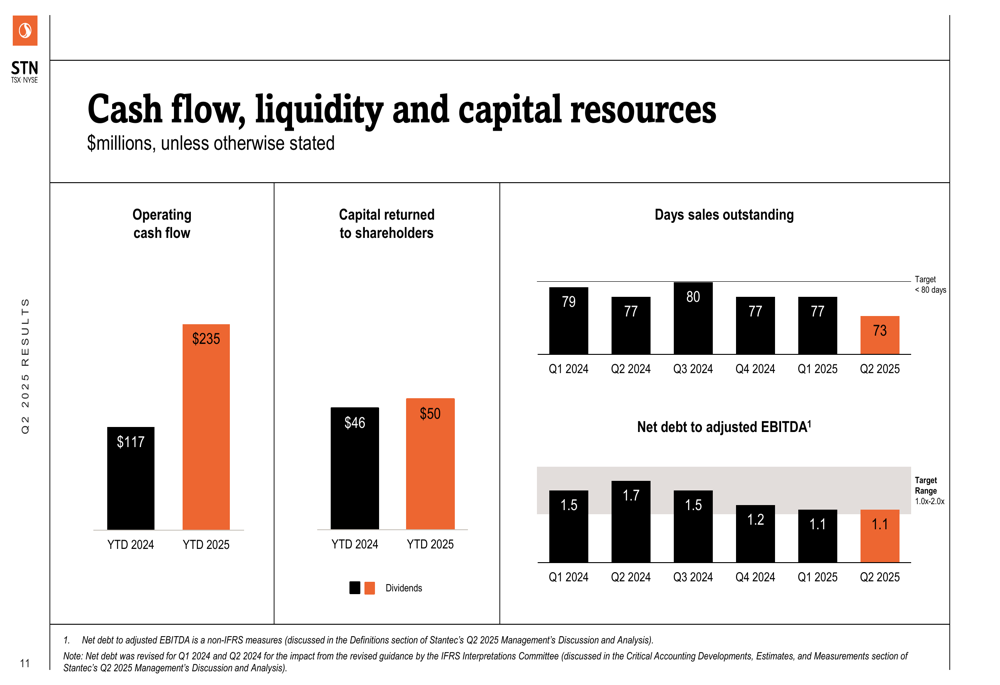
Stantec’s financial position strengthened considerably in Q2 2025. Operating cash flow for the year-to-date period reached $235 million, more than doubling from $117 million in the same period of 2024. The company returned $50 million to shareholders, up from $46 million in the prior year.
Days sales outstanding improved to 73 days, down from 77 days in Q2 2024, reflecting enhanced working capital management. The net debt to adjusted EBITDA ratio decreased significantly to 1.1, compared to 1.7 a year earlier, indicating a stronger balance sheet and increased financial flexibility.
As shown in the following cash flow and liquidity metrics:
The company also revised its capital structure during the quarter, successfully issuing $425 million in senior unsecured notes with a 7-year term. Additionally, Stantec increased its unsecured revolving credit facility to $1.2 billion (previously $800 million) and extended the maturity date to 2030, providing enhanced financial flexibility to support future growth initiatives.
Revised 2025 Outlook
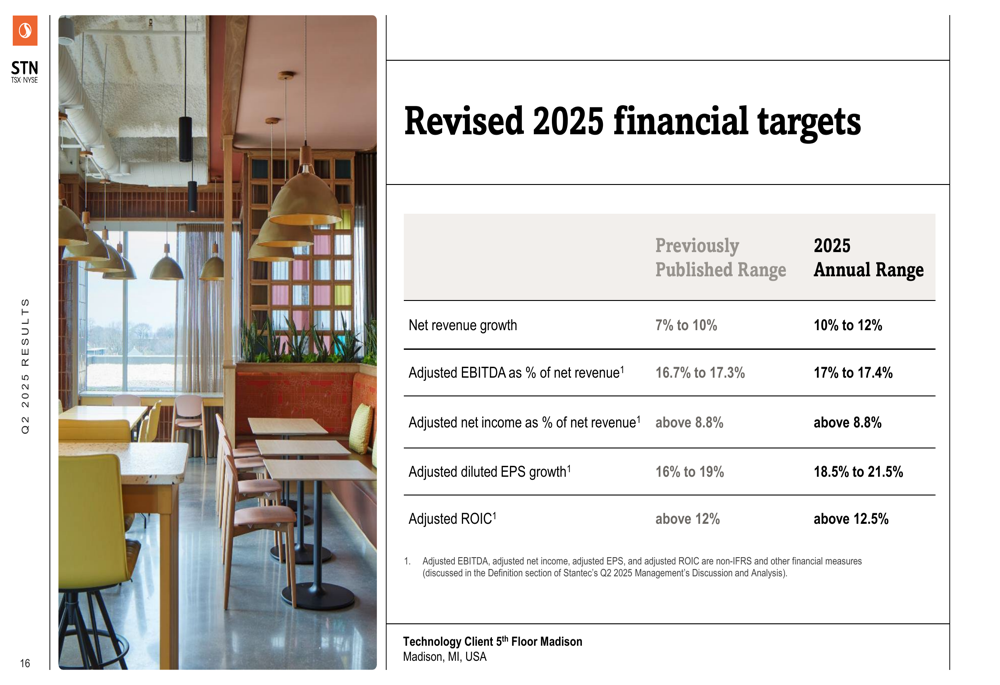
Based on strong performance in the first half of the year and positive momentum across its business segments, Stantec raised its financial targets for 2025:
- Net revenue growth: 10% to 12% (previously 7% to 10%)
- Adjusted EBITDA margin: 17% to 17.4% (previously 16.7% to 17.3%)
- Adjusted net income margin: above 8.8%
- Adjusted diluted EPS growth: 18.5% to 21.5% (previously 16% to 19%)
- Adjusted ROIC: above 12.5% (previously above 12%)
The following chart details the company’s revised financial targets for 2025:
These upward revisions reflect management’s confidence in Stantec’s business model, market positioning, and growth opportunities across its key sectors and geographies.
Conclusion
Stantec’s Q2 2025 results demonstrate the company’s ability to deliver strong organic growth while successfully integrating strategic acquisitions. The improved financial performance, strengthened balance sheet, and growing backlog position the company well for continued success in the remainder of 2025 and beyond.
The upward revision of full-year financial targets underscores management’s confidence in the company’s growth trajectory and operational execution. With a diversified geographic footprint, strong presence in high-growth sectors like water infrastructure and environmental services, and enhanced financial flexibility, Stantec appears well-positioned to capitalize on global infrastructure and sustainability trends.
Full presentation:
This article was generated with the support of AI and reviewed by an editor. For more information see our T&C.