Gold prices steady, holding sharp gains in wake of soft U.S. jobs data

Introduction & Market Context
Starwood Property Trust (NYSE:STWD) released its Q1 2025 supplemental presentation, highlighting the company’s continued focus on diversification and balance sheet strength amid evolving market conditions. The commercial mortgage REIT reported distributable earnings of $0.45 per diluted share, slightly below the previous quarter’s $0.48, while maintaining its consistent $0.48 quarterly dividend.
The company’s shares traded at $19.04 as of May 8, 2025, up 0.58% on the day, but showing some weakness in pre-market trading on May 9, down 1% to $18.85. The stock has been trading in a range between $16.59 and $21.17 over the past 52 weeks.
Quarterly Performance Highlights
Starwood reported GAAP earnings of $0.33 per diluted share and distributable earnings of $0.45 per diluted share for Q1 2025. The company deployed $2.3 billion across its business lines during the quarter, including $1.4 billion in commercial lending and a record $0.7 billion in infrastructure lending.
As shown in the following comprehensive quarterly highlights:
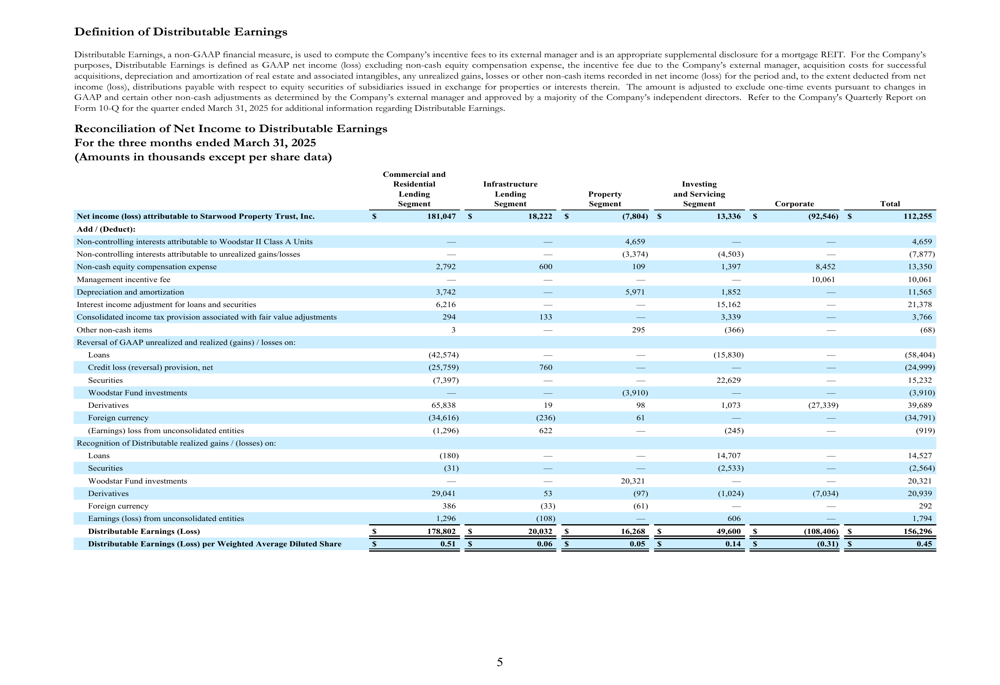
The company maintained its undepreciated book value per share at $19.76, while GAAP book value per share stood at $18.87. The GAAP book value reflects a $1.99 per share cumulative reduction for CECL reserves and property impairments.
Starwood continued to demonstrate its financial flexibility by issuing $500 million of 6.50% senior unsecured sustainability notes due 2030, which were swapped to S + 2.61%. This issuance helped extend the company’s average debt maturity to 3.7 years.
Portfolio Diversification
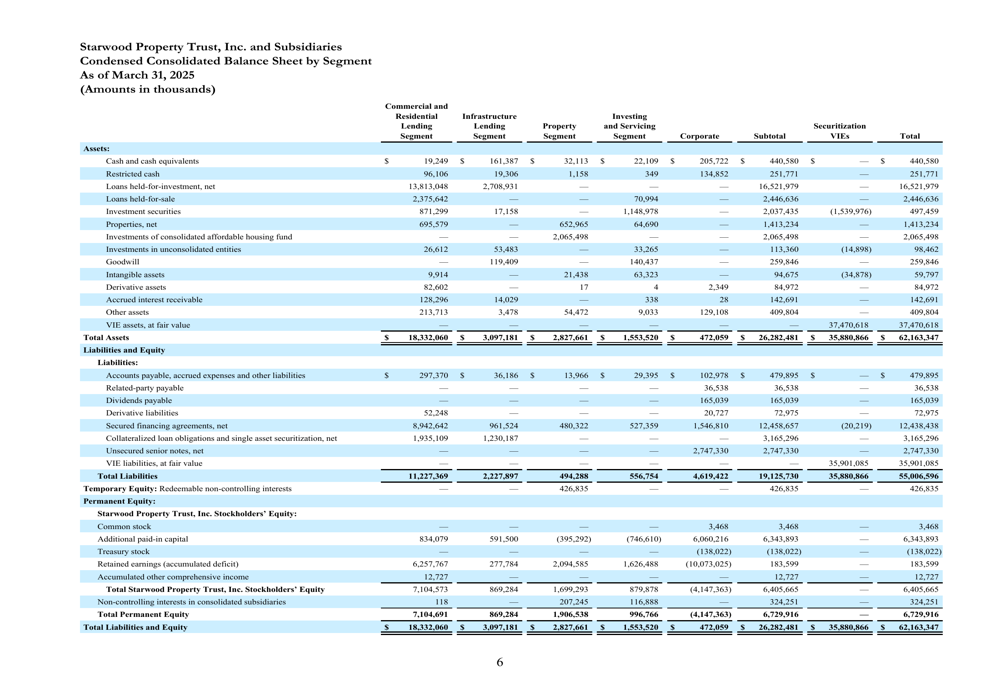
A key strength of Starwood’s business model is its diversified portfolio across multiple asset classes and geographies. The company’s total assets of $26.3 billion are strategically allocated to minimize concentration risk, with commercial loans representing the largest segment at 55%.
The following asset allocation chart illustrates how Starwood has limited its exposure to potentially challenging sectors like U.S. office, which represents only 9% of the total asset base:
Geographically, Starwood’s commercial portfolio demonstrates significant diversification across U.S. regions and international markets. This geographic spread helps insulate the company from localized market downturns.
The commercial portfolio’s geographic diversification is clearly visualized in this map:

Commercial and Infrastructure Lending Activity
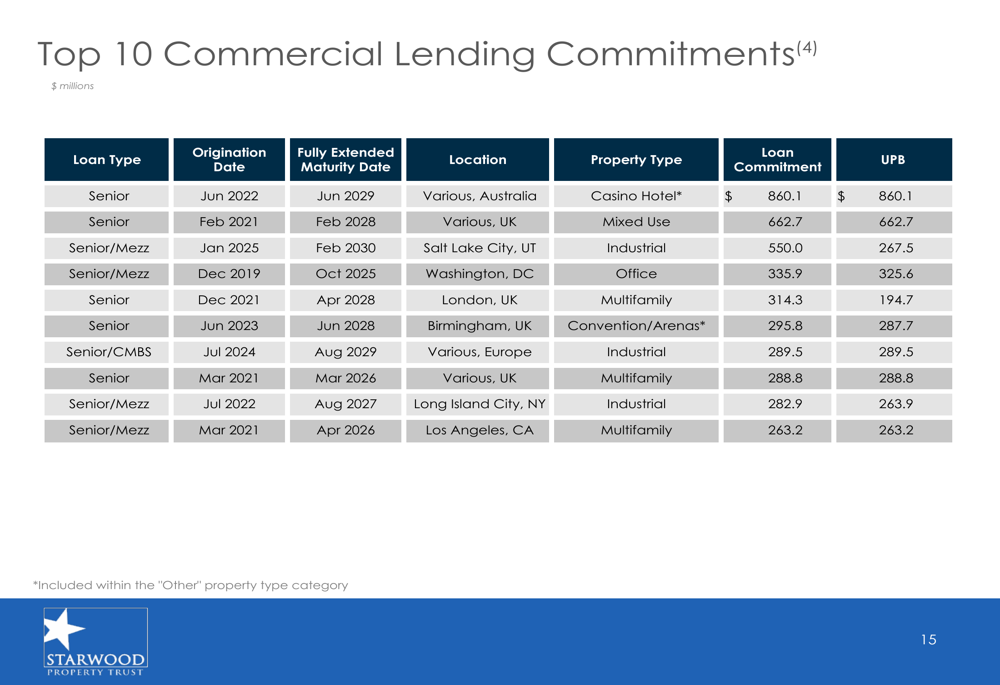
Starwood’s commercial lending segment originated $1.4 billion in loans during Q1, with an additional $0.9 billion subsequent to quarter end. The portfolio maintains a weighted average risk rating of 2.9 on a scale of 1-5 (with 5 being the highest risk).
The risk profile of the commercial lending portfolio is detailed in the following chart:
While the majority of the portfolio remains in good standing, there are some credit concerns to monitor. The presentation reveals six loans rated 5 (highest risk) totaling $1.8 billion, representing about 12% of the total commercial lending portfolio. During the quarter, the company foreclosed on one previously 5-rated loan and saw a non-accrual loan repaid for a $1 million distributable earnings gain.
The infrastructure lending segment achieved record performance with $677 million in new commitments ($601 million funded) during Q1. This segment continues to grow in importance within Starwood’s diversified business model.
The infrastructure portfolio shows significant sector and geographic diversification:
Balance Sheet and Liquidity
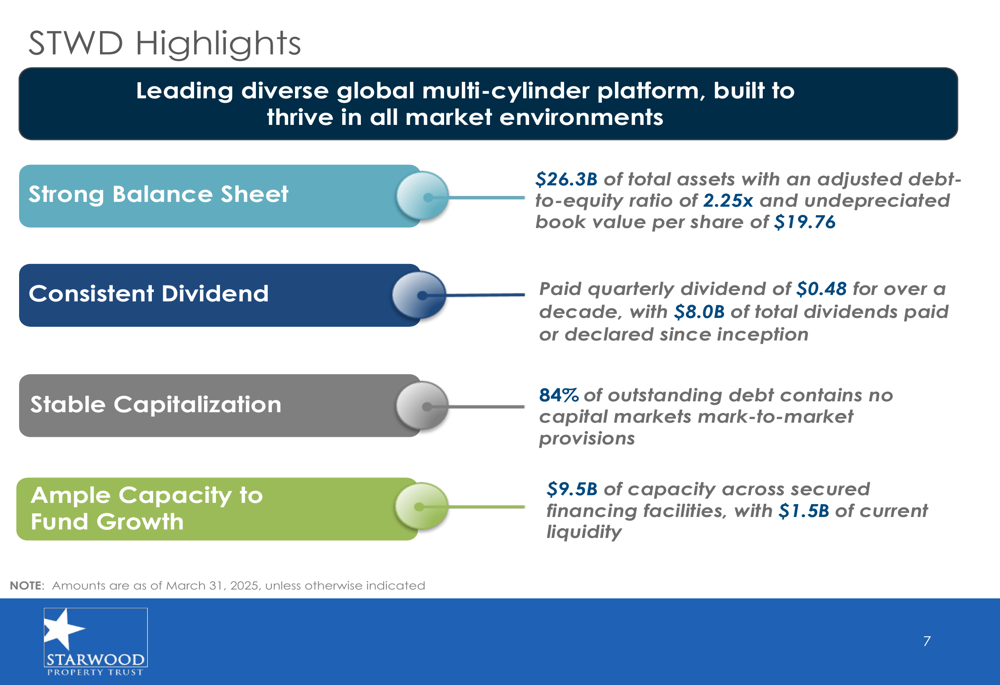
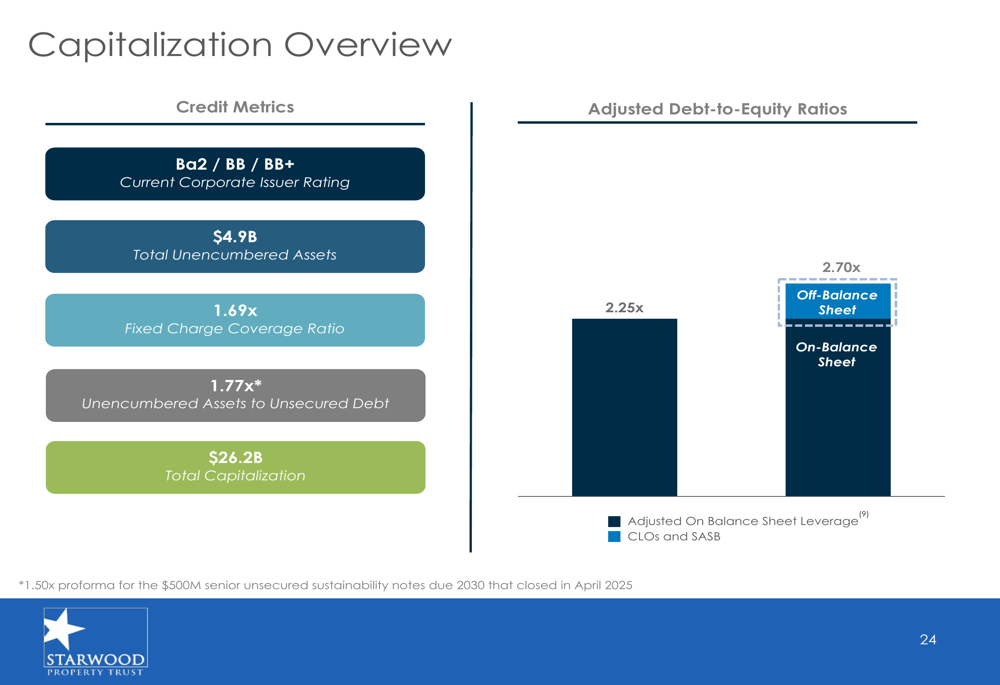
Starwood maintains a strong balance sheet with an adjusted debt-to-equity ratio of 2.25x. The company has positioned itself defensively with 84% of its consolidated debt containing no capital markets mark-to-market provisions, providing stability during periods of market volatility.
The following capitalization overview highlights Starwood’s credit metrics and leverage ratios:

The company’s debt structure is designed to minimize market risk, as illustrated in this breakdown:
Starwood reported robust liquidity of $1.5 billion as of May 2, 2025, consisting of cash and approved undrawn debt capacity. This strong liquidity position, combined with $9.5 billion of capacity across secured financing facilities, provides ample resources for continued investment activity.
The company’s financial capacity is detailed in the following chart:
Property Segment Performance
Starwood’s property segment continues to perform well, with its Woodstar Fund portfolio increasing to 99% occupancy. However, the company reported unrealized fair value decreases of $16 million ($13 million, net of 20.6% non-controlling interests) in the Woodstar Fund investments.
The property investment portfolio maintains strong occupancy rates across segments:
Forward Outlook
Looking ahead, Starwood appears well-positioned to navigate market challenges through its diversified business model and strong balance sheet. The company’s record activity in infrastructure lending aligns with statements from its Q4 2024 earnings call, where management indicated plans to explore expansion into infrastructure and energy lending.
The company’s strategy of maintaining diversification across multiple cylinders should continue to provide resilience in varying market environments. With $1.5 billion in current liquidity and significant financing capacity, Starwood has ample resources to pursue attractive investment opportunities across its business segments.
While the commercial real estate market continues to face headwinds, particularly in the office sector, Starwood’s limited exposure to U.S. office properties (9% of total assets) and its diversified approach to lending and property ownership help mitigate these risks. The company’s consistent dividend payment history, now spanning over a decade, underscores management’s commitment to delivering shareholder value through various market cycles.
Full presentation:
This article was generated with the support of AI and reviewed by an editor. For more information see our T&C.