These are top 10 stocks traded on the Robinhood UK platform in July

Introduction & Market Context
Stoneridge, Inc. (NYSE:SRI) released its first quarter 2025 financial results on May 1, 2025, highlighting operational improvements amid continued challenges. The automotive and commercial vehicle supplier reported sales of $217.9 million, with notable progress in gross margin expansion and positive free cash flow generation, despite posting an operating loss for the quarter.
The company’s presentation comes as Stoneridge’s stock trades near its 52-week low of $3.54, closing at $3.94 on April 30, 2025, reflecting ongoing investor concerns about the company’s profitability and market conditions. The automotive components sector continues to face headwinds from production volatility and supply chain disruptions.
Quarterly Performance Highlights
Stoneridge reported a significant improvement in gross margin, which expanded by 210 basis points compared to Q4 2024. The company achieved $4.9 million in free cash flow, representing a $1.5 million improvement versus the same period last year.
As shown in the following summary of Q1 2025 achievements:
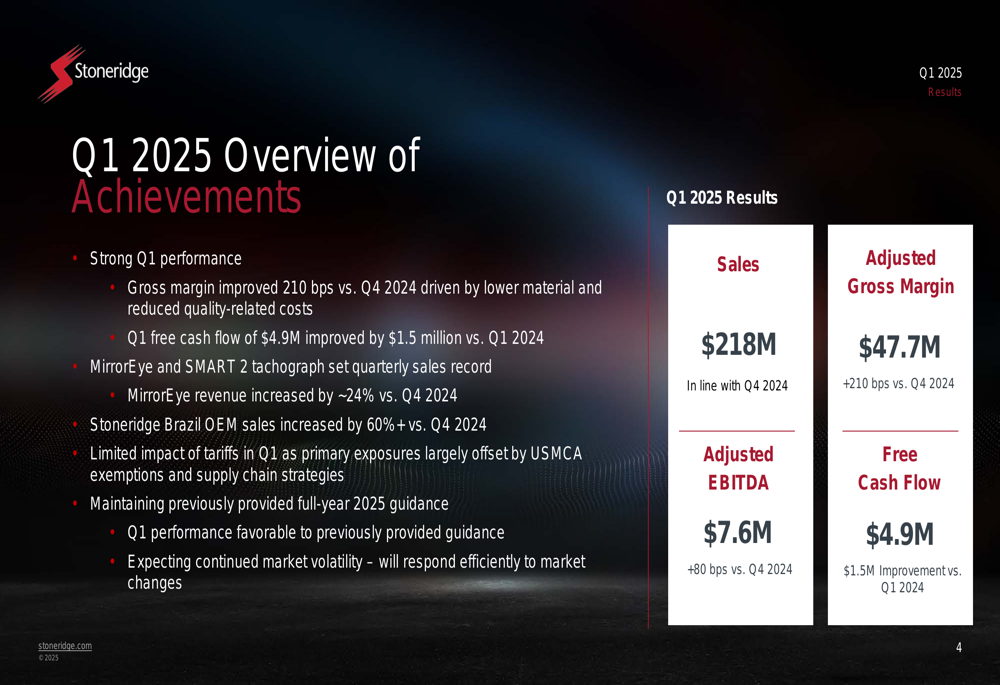
Key product lines showed strong momentum, with MirrorEye and SMART 2 both setting quarterly sales records. The company’s OEM sales increased by more than 60%, demonstrating traction in key markets despite broader industry challenges.
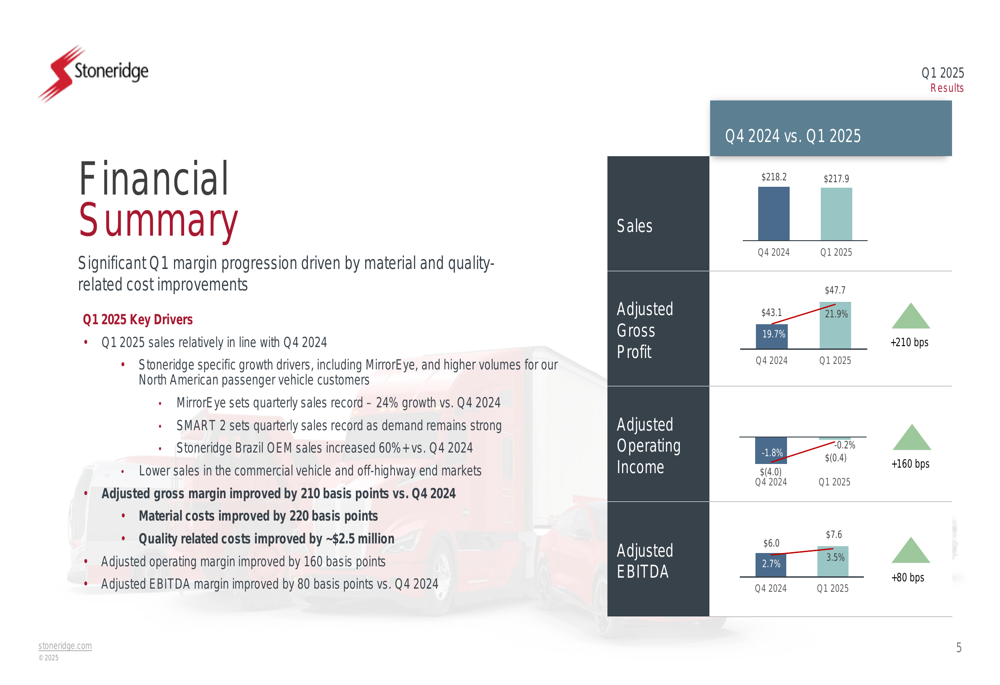
The financial summary highlights the sequential improvement from Q4 2024 to Q1 2025, with color-coded indicators showing positive trends in gross profit and operating income margins:
Detailed Financial Analysis
Stoneridge reported Q1 2025 sales of $217.9 million, with an adjusted gross profit margin of 21.9%, up from 19.8% in Q4 2024. While the company still reported an adjusted operating loss margin of -0.2%, this represents a substantial improvement from the -1.9% reported in the previous quarter.
The company’s adjusted EBITDA for Q1 2025 was $7.6 million, resulting in a 3.5% margin. Free cash flow reached $4.9 million, demonstrating the company’s focus on working capital management and operational efficiency.
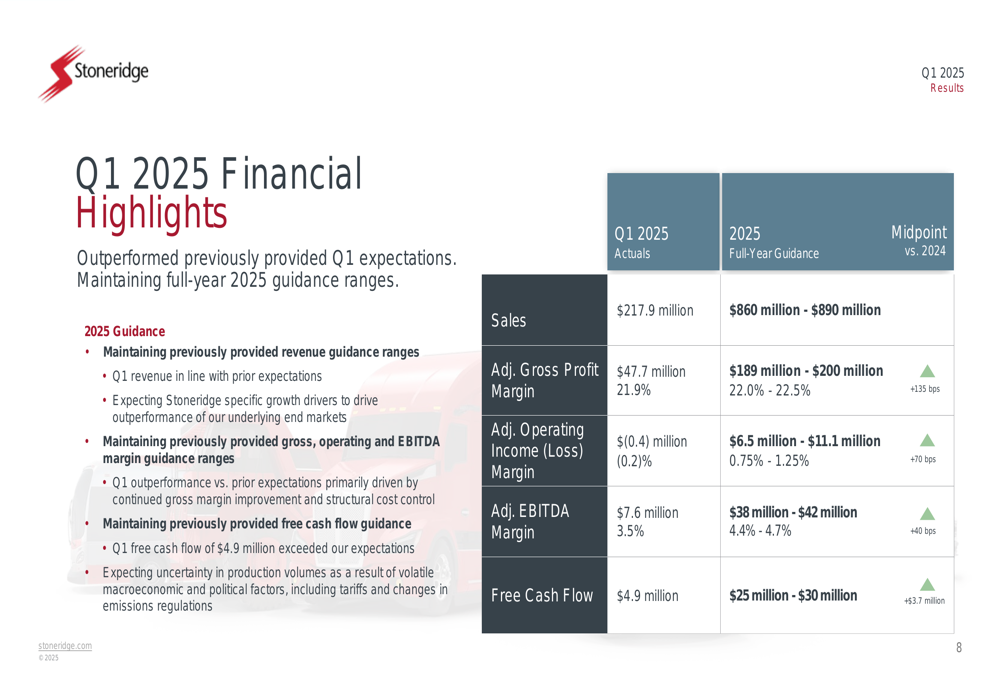
The following chart compares Q1 2025 actual results against full-year guidance:
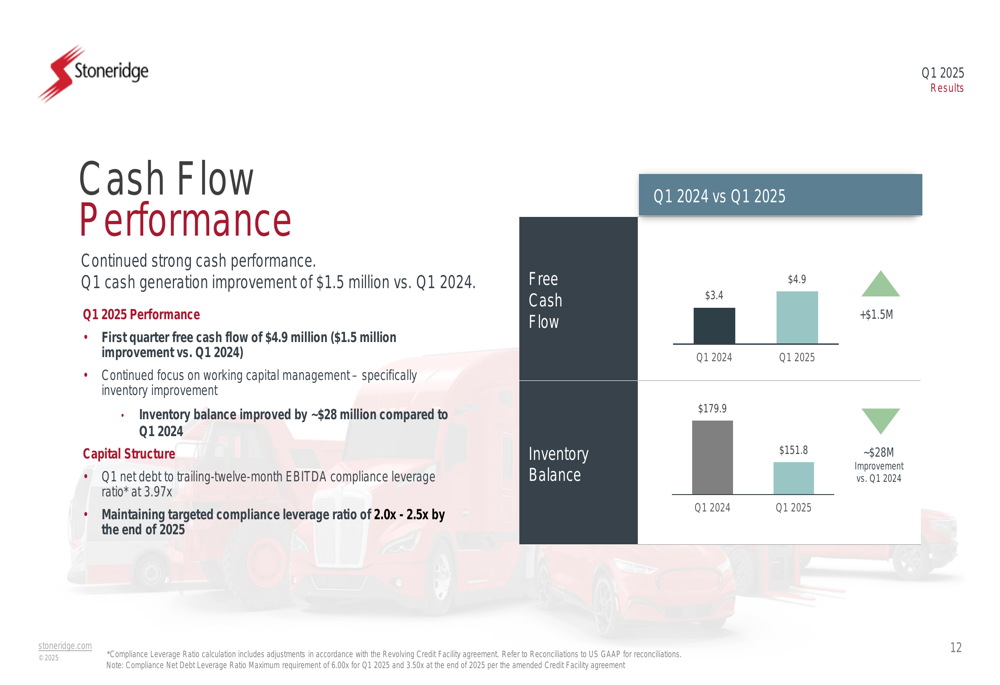
Stoneridge’s balance sheet shows a net debt to trailing-twelve-month EBITDA compliance leverage ratio of 3.97x, which remains within the maximum requirement of 6.00x. Total (EPA:TTEF) debt stood at $203.2 million against cash and cash equivalents of $79.1 million.
The company’s cash flow performance showed improvement year-over-year:
Strategic Initiatives & Segment Performance
Stoneridge’s Electronics segment, which includes the company’s MirrorEye camera-monitor system, showed continued momentum with a 130 basis point improvement in adjusted operating margin. This segment, which represents the largest portion of the company’s business with $140.5 million in quarterly sales, is central to Stoneridge’s growth strategy.
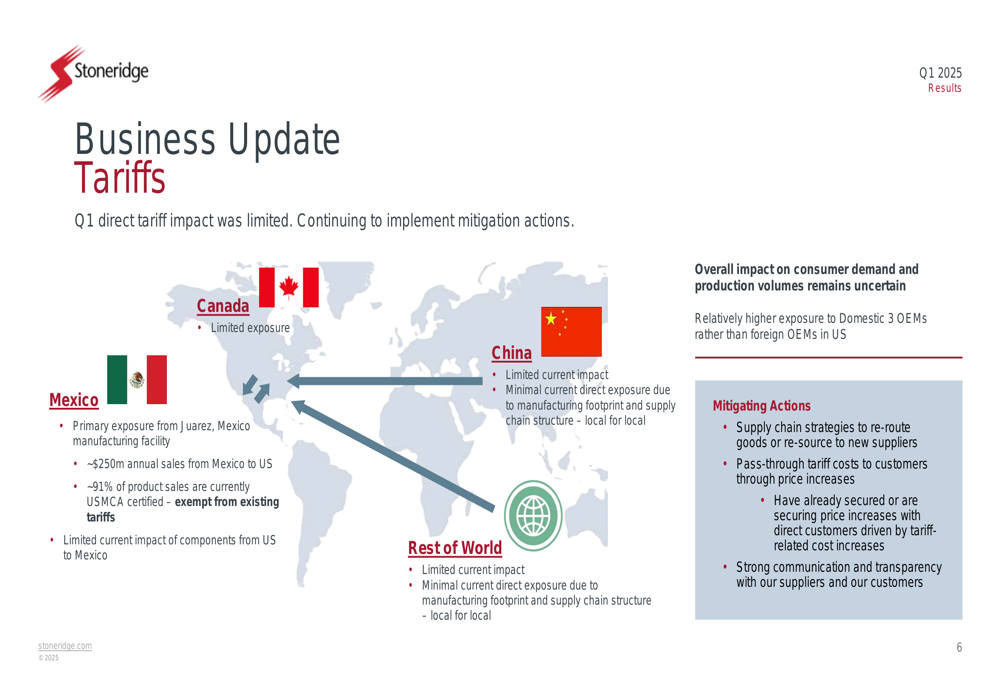
The company provided a detailed update on tariff exposure and mitigation strategies, highlighting limited direct impact in Q1. Stoneridge’s primary exposure comes from its operations in Juarez, Mexico, which account for approximately $250 million in annual sales from Mexico to the US. The company noted that about 91% of these product sales are USMCA certified.
The Control Devices segment showed significant improvement with a 470 basis point increase in adjusted operating income margin compared to Q4 2024. Sales increased by 10.6% sequentially to $63.0 million, though the company expects continued volatility in end-markets to drive a sales decline in 2025 compared to 2024.
Stoneridge Brazil demonstrated strong performance with a 320 basis point improvement in adjusted operating margin. The segment’s local OEM business grew by more than 60%, contributing to the overall positive momentum.
Forward-Looking Statements
Stoneridge maintained its full-year 2025 guidance, projecting sales between $860-890 million, adjusted gross profit margin of 22.0-22.5%, adjusted operating income margin of 0.75-1.25%, adjusted EBITDA margin of 4.4-4.7%, and free cash flow of $25-30 million.
The company’s Q1 2025 summary highlights the key drivers behind its performance improvement, including better material costs, reduced quality-related costs, and continued focus on structural cost reduction:
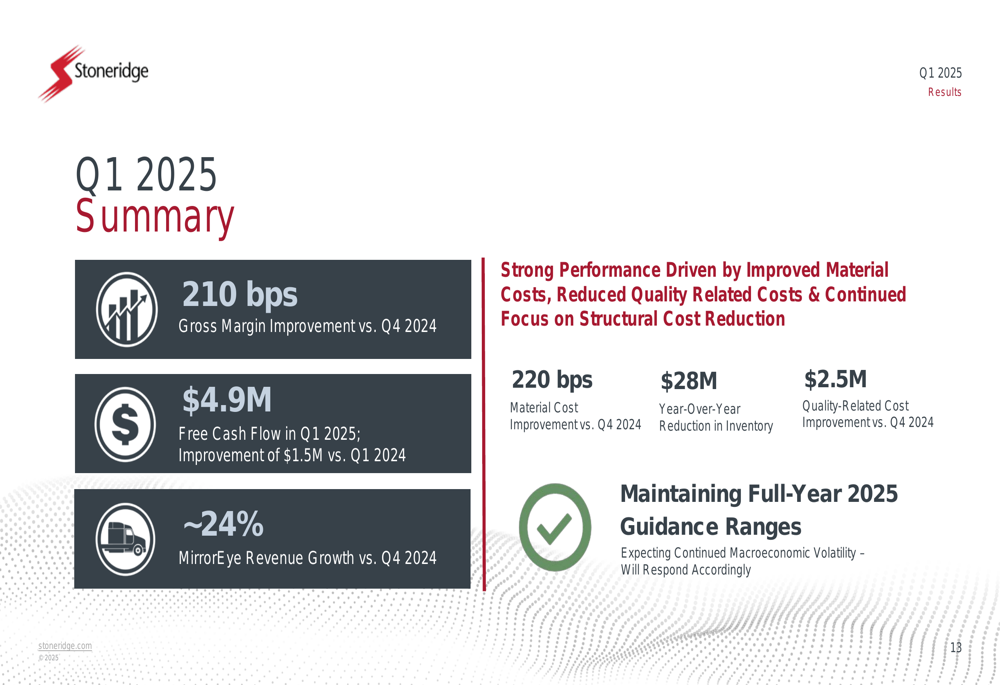
Management emphasized the company’s focus on operational improvements and cash generation while navigating challenging market conditions. The maintained guidance suggests confidence in the company’s ability to continue its recovery trajectory through 2025, despite ongoing market volatility.
While Stoneridge shows signs of operational improvement, the company still faces challenges in achieving consistent profitability. The negative operating margin, albeit improved, indicates that further cost optimization and revenue growth will be necessary to return to sustained profitability. Investors will likely focus on whether the company can maintain its margin improvement trajectory and achieve its full-year guidance in subsequent quarters.
Full presentation:
This article was generated with the support of AI and reviewed by an editor. For more information see our T&C.