Street Calls of the Week

Introduction & Market Context
Sun Life Financial Inc (NYSE:SLF) released its Q1 2025 results on May 9, showcasing strong underlying performance across its diversified business segments. The global financial services organization reported underlying net income of $1.045 billion, a 24% increase year-over-year, while reported net income reached $928 million. Despite these positive results, the stock faced pressure in premarket trading, down 4.95% to $56.97.
The company’s Q1 performance marks a potential recovery from its Q4 2024 results, which saw earnings per share of $1.68 miss analyst forecasts of $1.76 and triggered an 8.17% stock decline. However, investors appear cautious about Sun Life’s growth trajectory despite the improved quarterly numbers.
Quarterly Performance Highlights
Sun Life’s Q1 2025 results demonstrated strength across its three main business segments: Asset Management & Wealth, Group - Health & Protection, and Individual - Protection, which contributed $487 million, $330 million, and $325 million to underlying net income, respectively.
As shown in the following breakdown of Q1 2025 results:
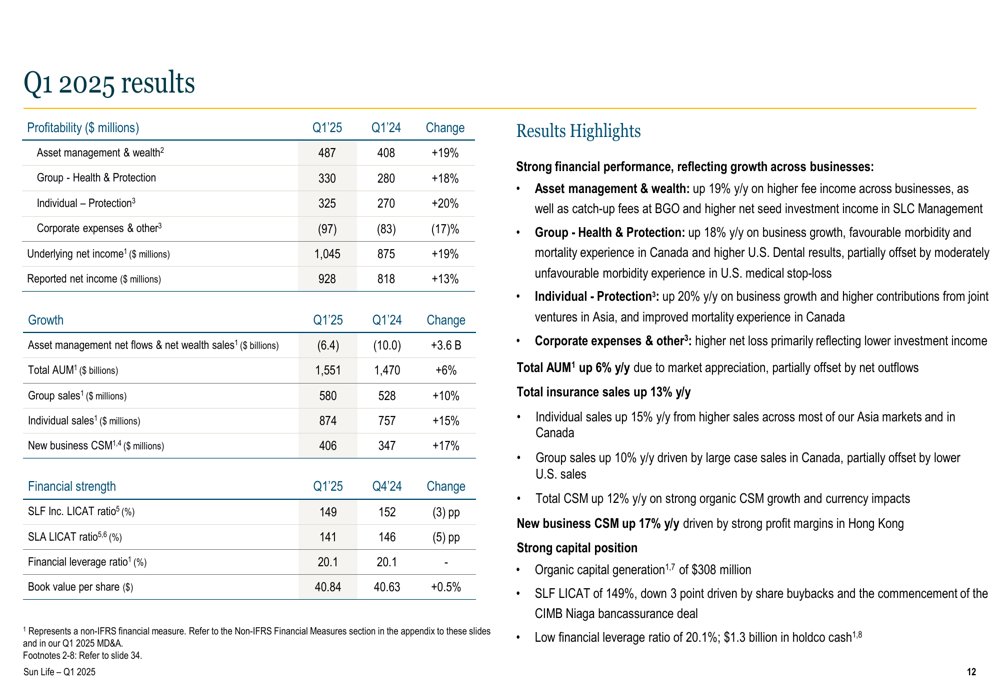
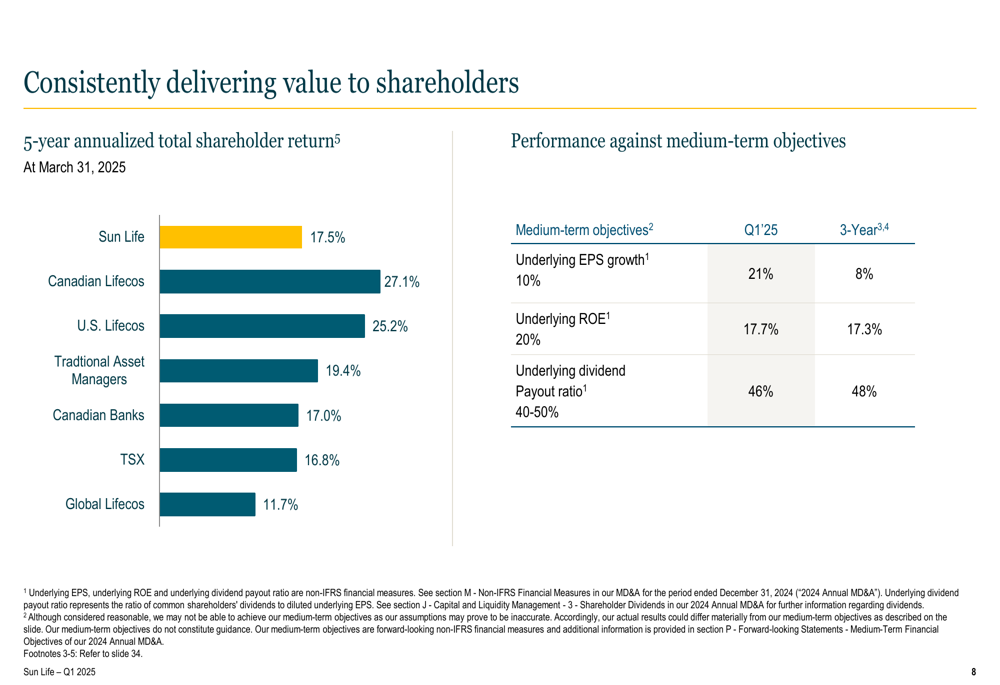
The company’s underlying earnings per share growth reached 21% in Q1, significantly exceeding its medium-term objective of 10%. Underlying return on equity stood at 17.7%, approaching but still below the company’s 20% target. The underlying dividend payout ratio was 46%, well within the 40-50% objective range.
Sun Life’s total assets under management reached $1.55 trillion, though the company experienced net outflows of $6.4 billion in its asset management and wealth businesses. The company maintained a strong capital position with a Sun Life Financial Inc. LICAT ratio of 149% and a financial leverage ratio of 20.1%.
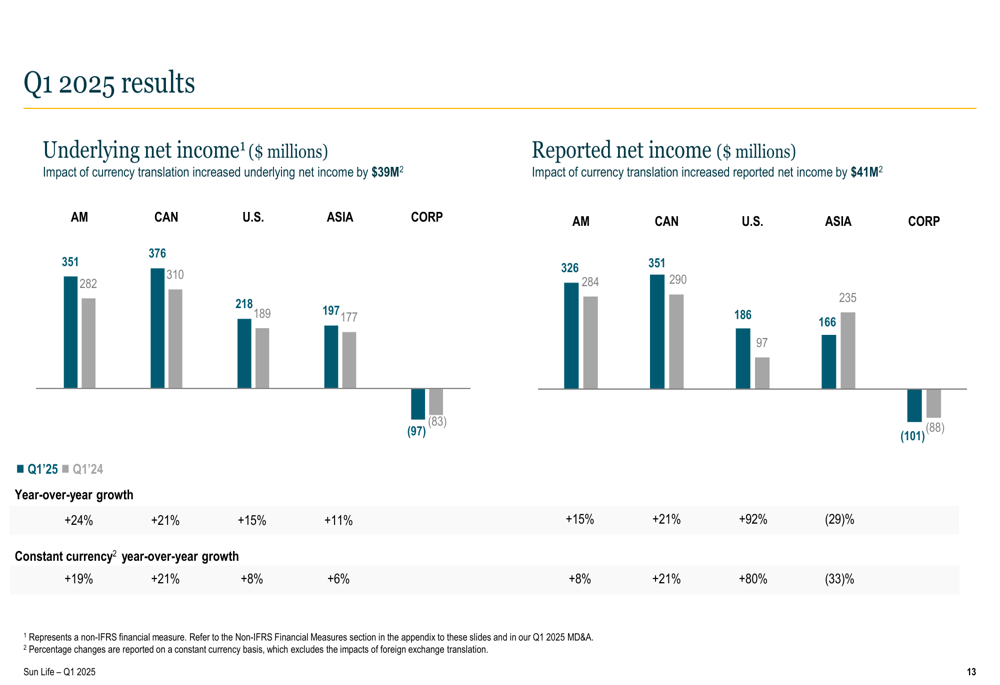
Income results by business segment showed solid growth across all regions:
Strategic Initiatives
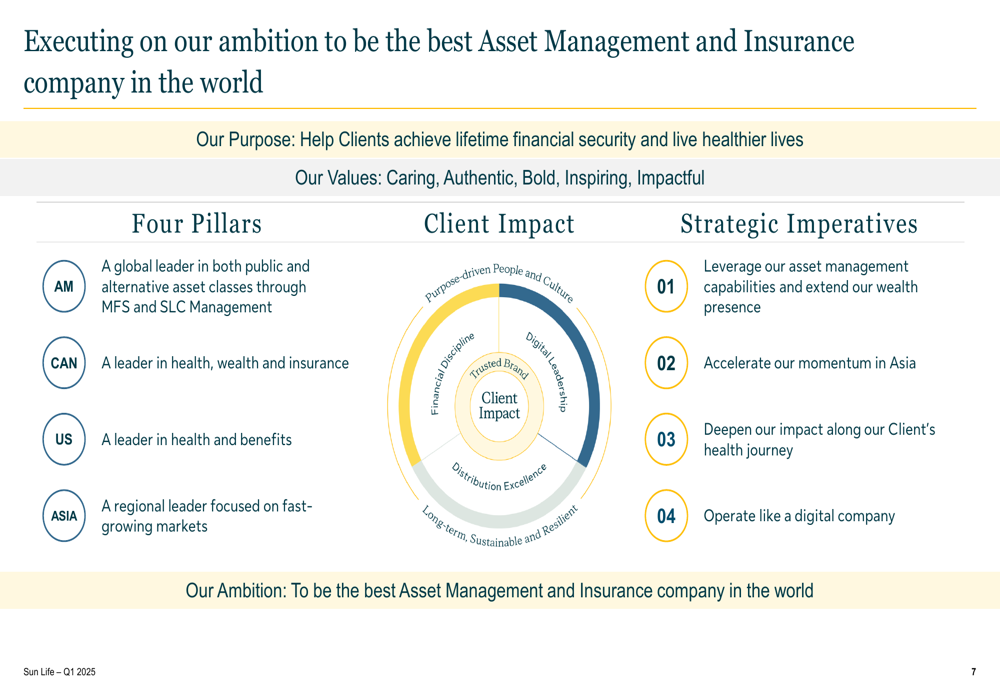
Sun Life continues to advance its strategic ambition "to be the best Asset Management and Insurance company in the world" through four key imperatives: leveraging asset management capabilities, accelerating momentum in Asia, deepening impact along clients’ health journeys, and operating as a digital company.
The company’s strategic framework is illustrated in this diagram:
Digital transformation remains a priority, with several initiatives highlighted in the presentation. These include utilizing generative AI to enhance the client-advisor experience in Canada, launching Interac verification services, and developing new digital capabilities in the U.S. through partnerships with Workday (NASDAQ:WDAY) Wellness and the launch of an Integrated Absence & Short-Term Disability portal.
Competitive Industry Position
Sun Life’s five-year annualized total shareholder return of 17.5% (as of March 31, 2025) outperformed the TSX (16.8%) and Global Lifecos (11.7%), but lagged behind Canadian Lifecos (27.1%), U.S. Lifecos (25.2%), and Traditional Asset Managers (19.4%).
The company’s performance against industry benchmarks is detailed in this chart:
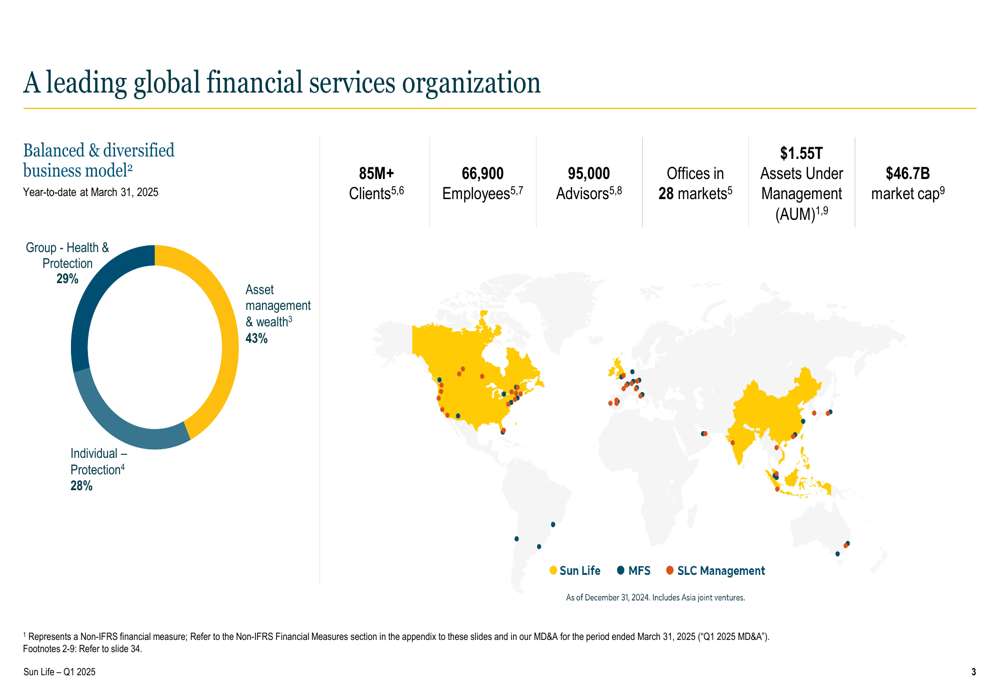
Sun Life operates as a leading global financial services organization with 85 million clients, 66,900 employees, and 95,000 advisors across 28 markets. Its balanced business model is distributed across Asset Management & Wealth (43%), Individual Protection (28%), and Group Health & Protection (29%).
The company’s global footprint and business diversification are illustrated here:
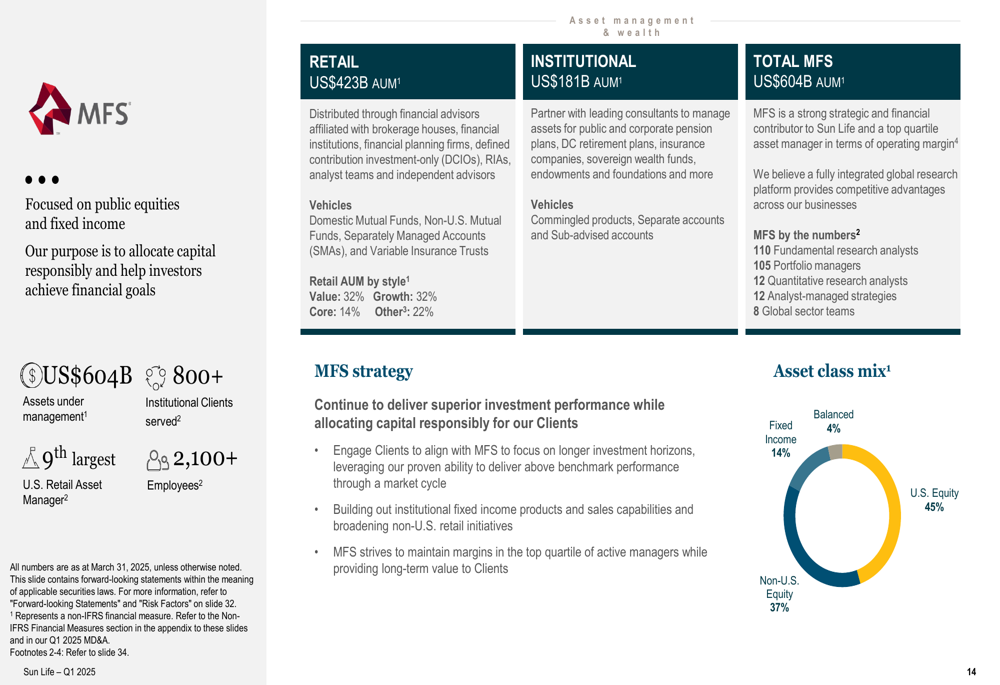
In asset management, Sun Life operates through MFS Investment Management with $604 billion in assets under management, focusing primarily on equities (82% of assets) and serving over 800 institutional clients.
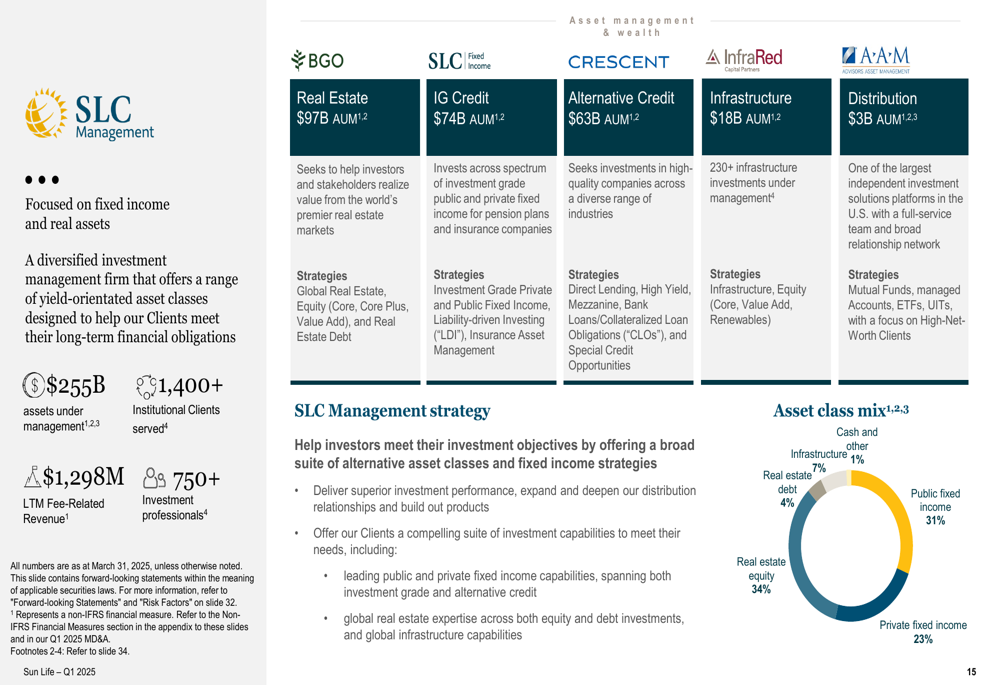
The company’s SLC Management platform manages $255 billion in assets across fixed income, real estate, alternative credit, and infrastructure investments:
Forward-Looking Statements
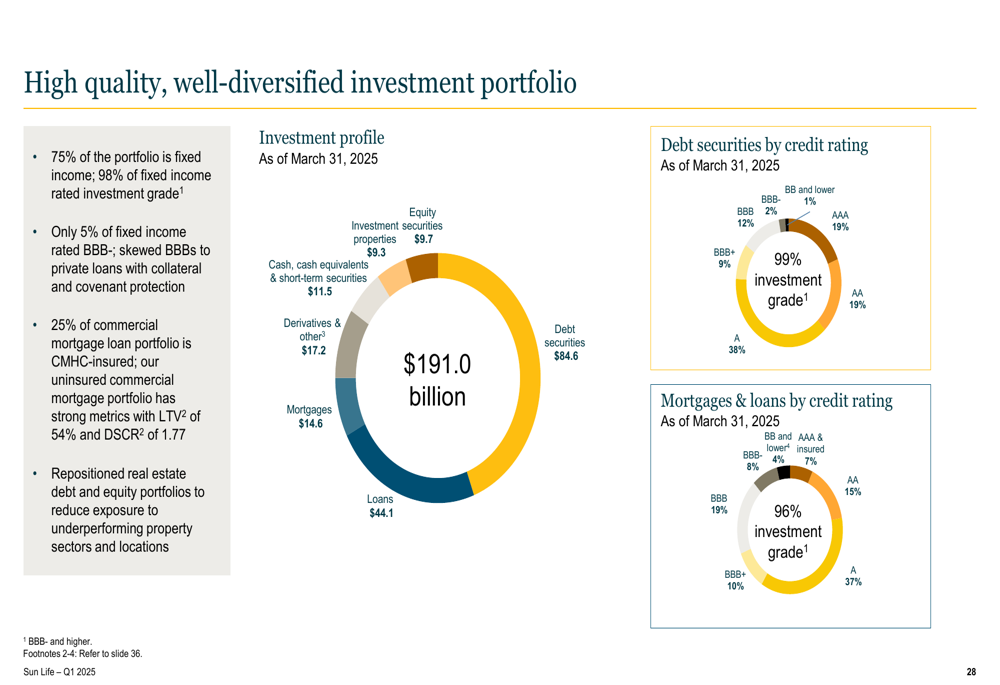
Sun Life’s investment portfolio remains well-diversified and high-quality, with a significant allocation to debt securities (52%), mortgages (14%), and investment properties (7%). The company’s mortgage portfolio is primarily focused on multi-family residential properties (32%) and industrial facilities (22%), with strong credit quality.
The investment profile breakdown is shown here:
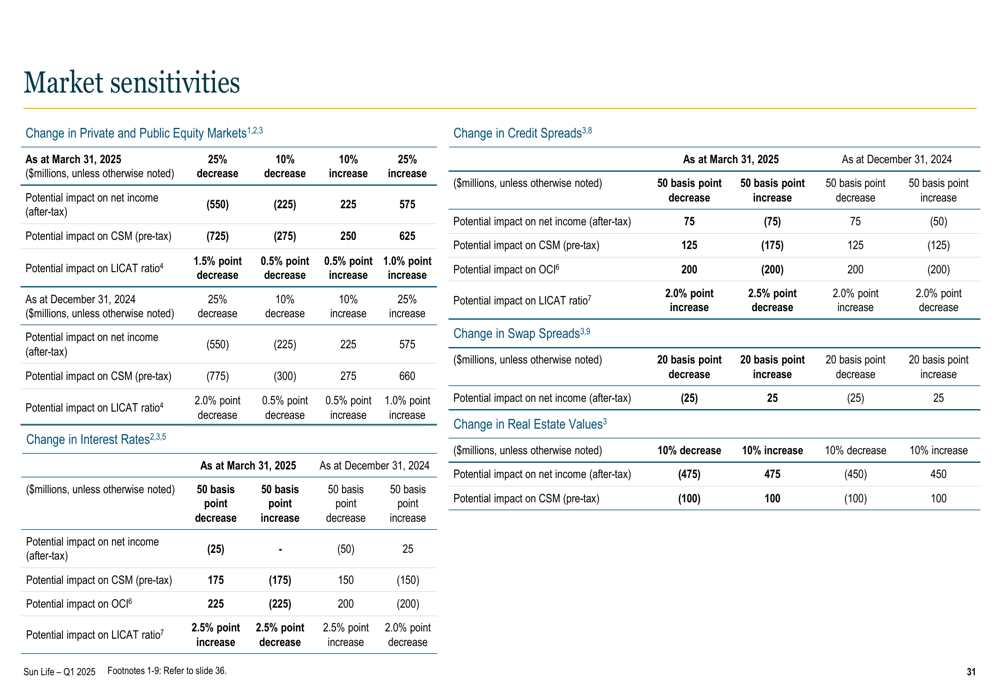
Looking ahead, Sun Life faces potential market sensitivities, particularly to equity markets, credit spreads, and interest rates. The company’s presentation included detailed sensitivity analyses to help investors understand potential impacts from market movements.
While Sun Life’s Q1 2025 results showed strong underlying performance, the market reaction suggests investors may be concerned about the sustainability of growth, particularly given the net outflows in asset management. The company continues to focus on its medium-term objectives of 10% underlying EPS growth, 20% underlying ROE, and a 40-50% underlying dividend payout ratio, though challenges remain in fully achieving these targets in the current economic environment.
Full presentation:
This article was generated with the support of AI and reviewed by an editor. For more information see our T&C.