Bitcoin price today: falls to 2-week low below $113k ahead of Fed Jackson Hole

Suncor Energy Inc (NYSE:SU) released its Q1 2025 investor presentation on May 6, highlighting record operational performance, strengthened financial position, and enhanced shareholder returns. The Canadian integrated energy company’s stock closed at $35.12 on the presentation date, with a market capitalization of $69 billion.
Executive Summary
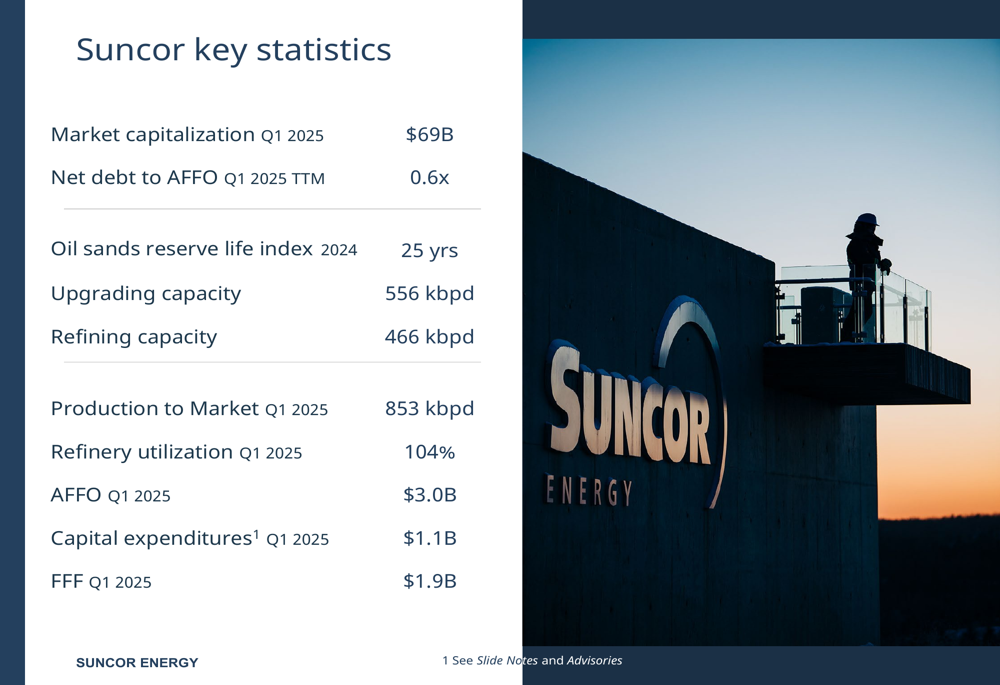
Suncor reported strong Q1 2025 results with adjusted funds from operations (AFFO) of $3.0 billion and free funds flow of $1.9 billion. The company achieved a production to market rate of 853,000 barrels per day (kbpd) and exceptional refinery utilization of 104%, demonstrating operational excellence across its integrated asset base.
Having reached its net debt target of $8 billion ahead of schedule in Q3 2024, Suncor has shifted to returning 100% of excess funds to shareholders through share buybacks, while maintaining its commitment to dividend growth of 3-5% annually.
As shown in the following key statistics overview, Suncor has established a resilient financial position with a net debt to AFFO ratio of 0.6x:
Operational Performance Highlights
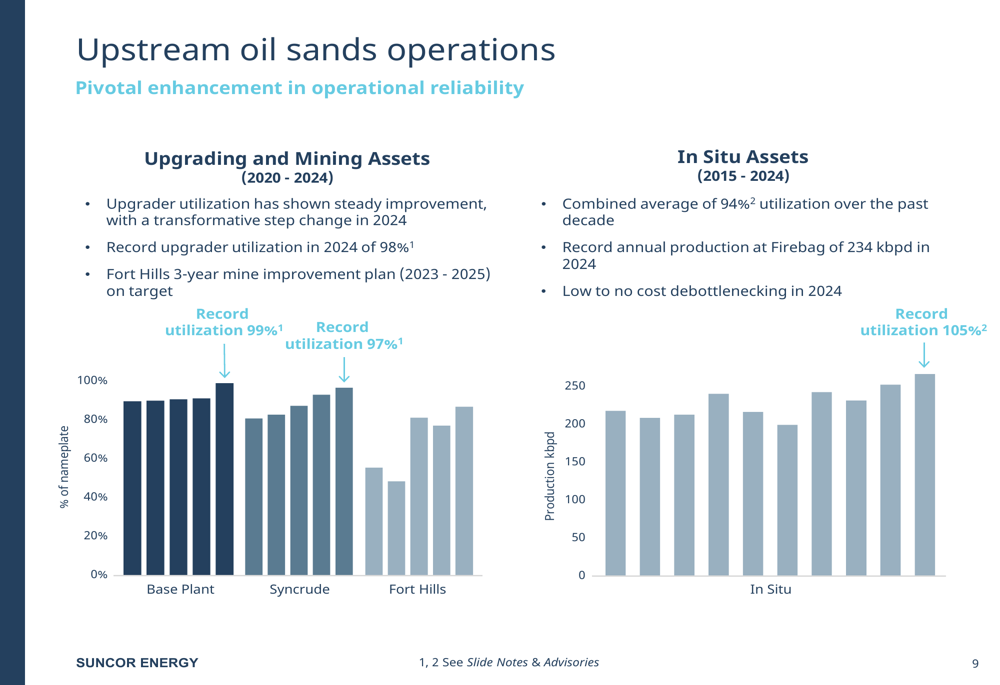
Suncor’s integrated operations have delivered record performance across both upstream and downstream segments. The company’s upgrader utilization reached a record 98% in 2024, representing what the company calls a "transformative step change" in operational reliability. Fort Hills operations are on target with a three-year mine improvement plan (2023-2025), while Firebag achieved record annual production of 234 kbpd in 2024.
The following chart illustrates Suncor’s significant improvements in upgrading and mining asset utilization:
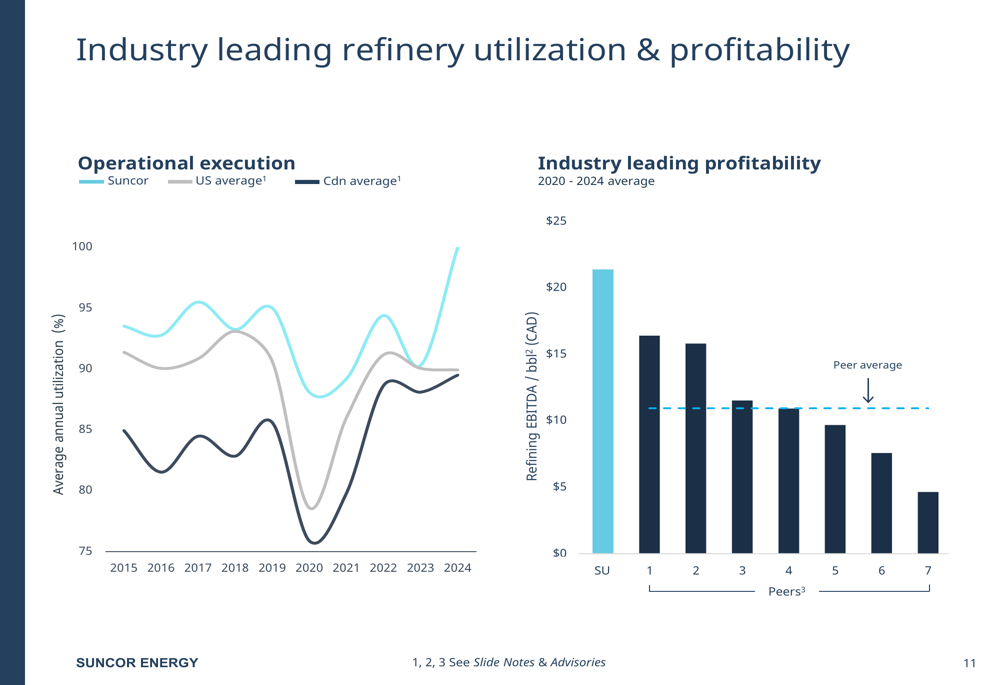
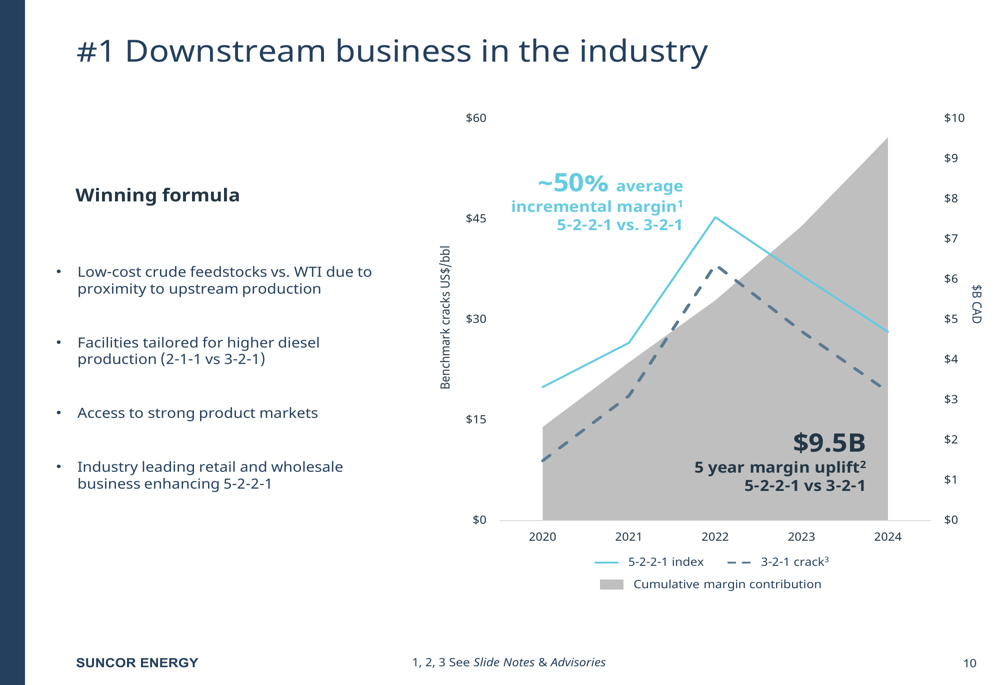
In the downstream segment, Suncor has maintained industry-leading refinery utilization consistently above both U.S. and Canadian averages. The company’s refineries are strategically positioned to benefit from low-cost crude feedstocks due to proximity to upstream production, with facilities tailored for higher diesel production.
The following chart demonstrates Suncor’s superior refinery utilization compared to industry averages:
Financial Discipline and Shareholder Returns
Suncor has demonstrated strong financial discipline, achieving its net debt target of $8 billion in Q3 2024, ahead of schedule. This milestone enabled the company to shift to returning 100% of excess funds to shareholders in Q4 2024.
The company has a well-structured debt maturity profile and maintains investment grade credit ratings (A Low from DBRS, Baa1 from Moody’s, and BBB+ from Fitch). Over the past decade, Suncor has returned more than 70% of its average market capitalization to shareholders.
As illustrated in the following chart, Suncor has maintained strong cash returns and a resilient balance sheet:
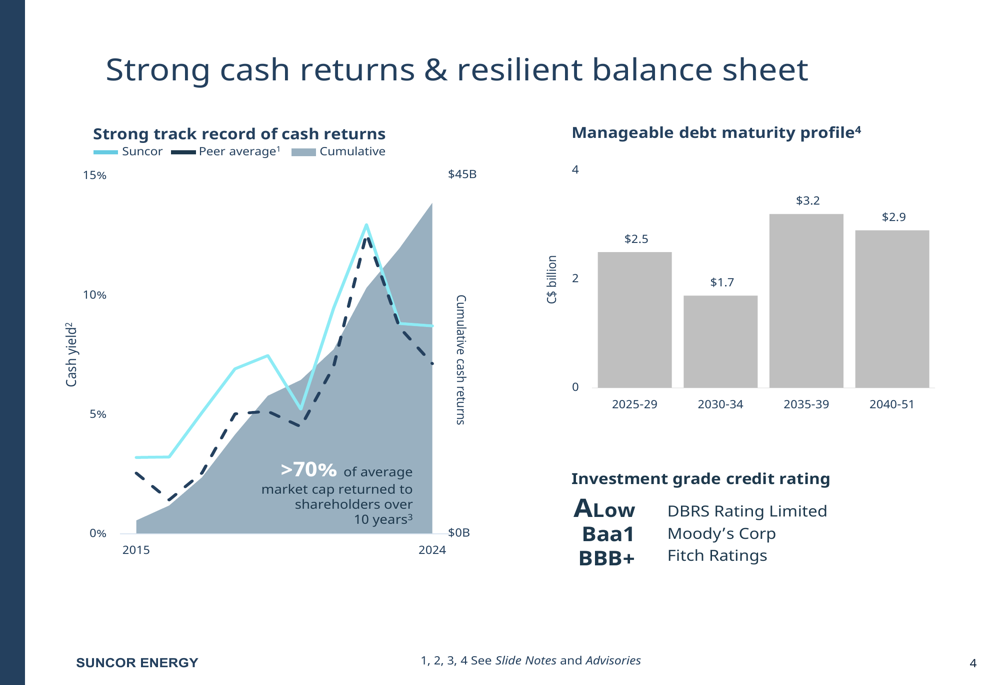
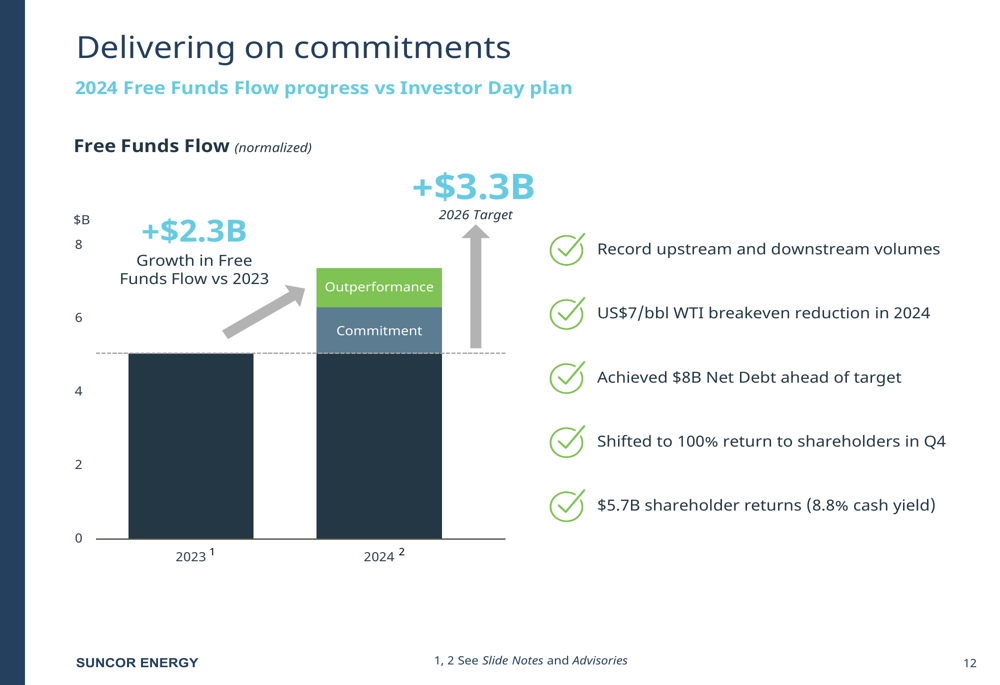
In 2024, Suncor returned $5.7 billion to shareholders, representing an 8.8% cash yield. The company’s shareholder return strategy includes reliable dividend growth (targeting 3-5% annual growth) and share buybacks with excess funds.
The following slide details how Suncor is delivering on its commitments, including a $3.3 billion increase in free funds flow in 2024:
Strategic Positioning and Competitive Advantages
Suncor’s strategic advantage stems from its integrated business model and high-quality asset base. The company holds approximately 7 billion barrels of 2P reserves with no exploration risk and a low corporate decline rate of approximately 5%.
The company’s oil sands assets are interconnected by pipelines, allowing for operational flexibility and optimization. This integrated footprint enables Suncor to maximize margins and maintain high upgrader utilization (above 90%).
In the downstream segment, Suncor claims a leading position with its custom 5-2-2-1 index average incremental margin approximately 50% better than the standard 3-2-1 crack spread. This has resulted in a five-year margin uplift of $9.5 billion.
The following chart illustrates Suncor’s downstream business advantage:
Forward-Looking Guidance
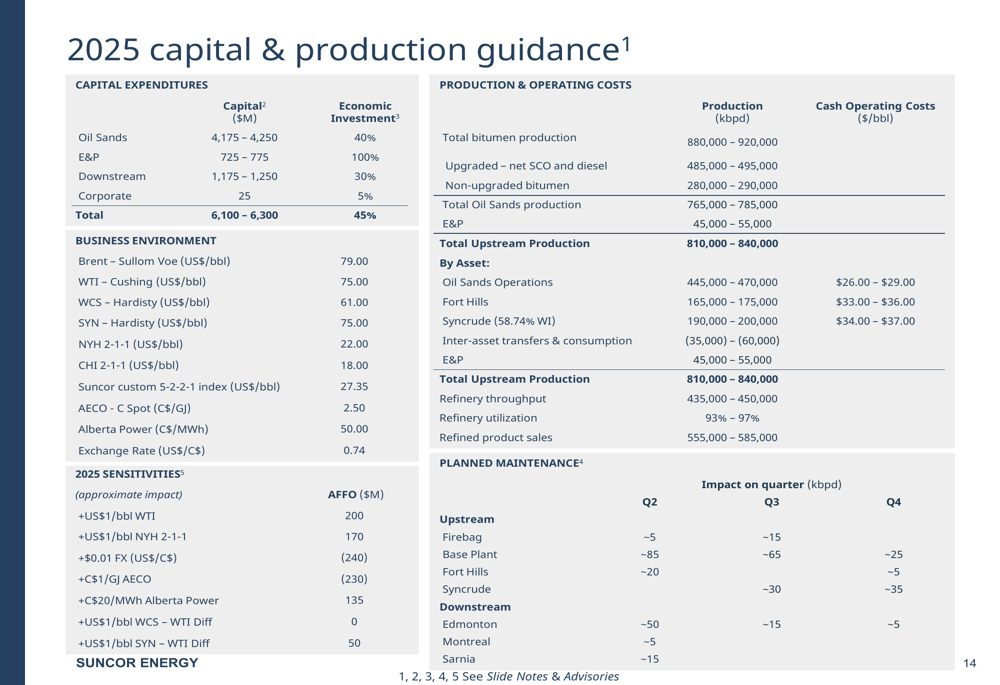
For 2025, Suncor has outlined a capital budget of approximately $6.1-6.3 billion, split between economic investment capital ($2.625-2.725 billion) and asset sustainment and maintenance ($3.475-3.575 billion).
The company’s production guidance for 2025 projects total bitumen production of 880,000-920,000 barrels per day. Suncor’s business environment assumptions include WTI crude at $75.00 per barrel and a WTI sensitivity of +$200 million AFFO for each $1/bbl increase.
The following slide provides a comprehensive overview of Suncor’s 2025 capital and production guidance:
Suncor continues to focus on operational excellence, cost discipline, and shareholder returns. The company’s integrated business model, combined with its high-quality asset base and strategic positioning, provides a solid foundation for sustainable long-term performance in varying market conditions.
Full presentation:
This article was generated with the support of AI and reviewed by an editor. For more information see our T&C.