These are top 10 stocks traded on the Robinhood UK platform in July

T. Rowe Price Group (NASDAQ:TROW) released its Q1 2025 earnings presentation on May 2, 2025, revealing sequential improvements in key financial metrics compared to the previous quarter, despite continued net outflows and year-over-year declines in profitability.
Quarterly Performance Highlights
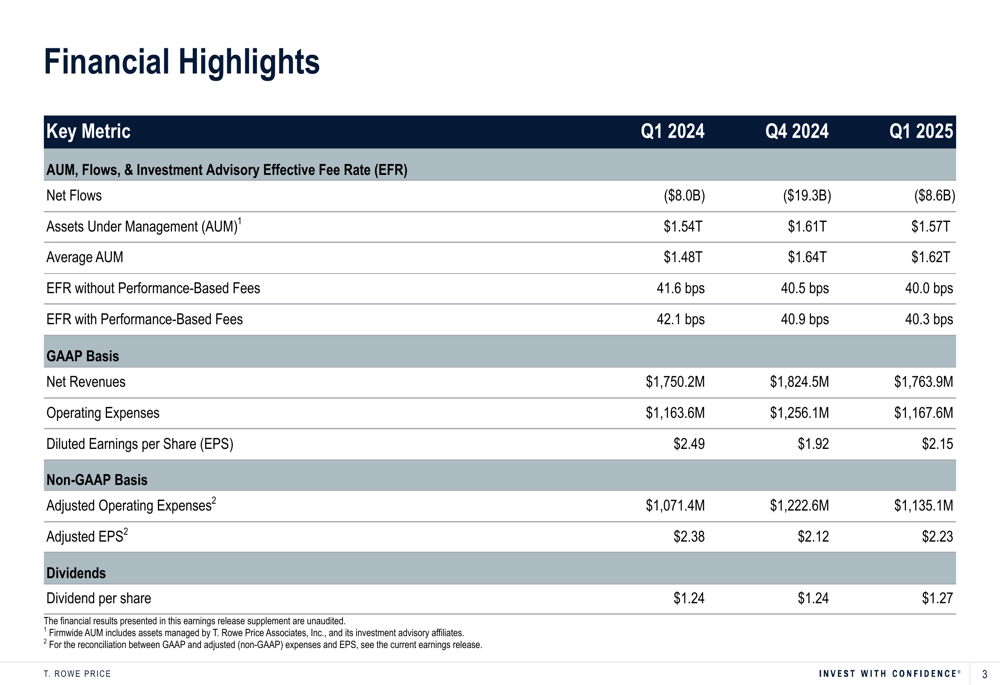
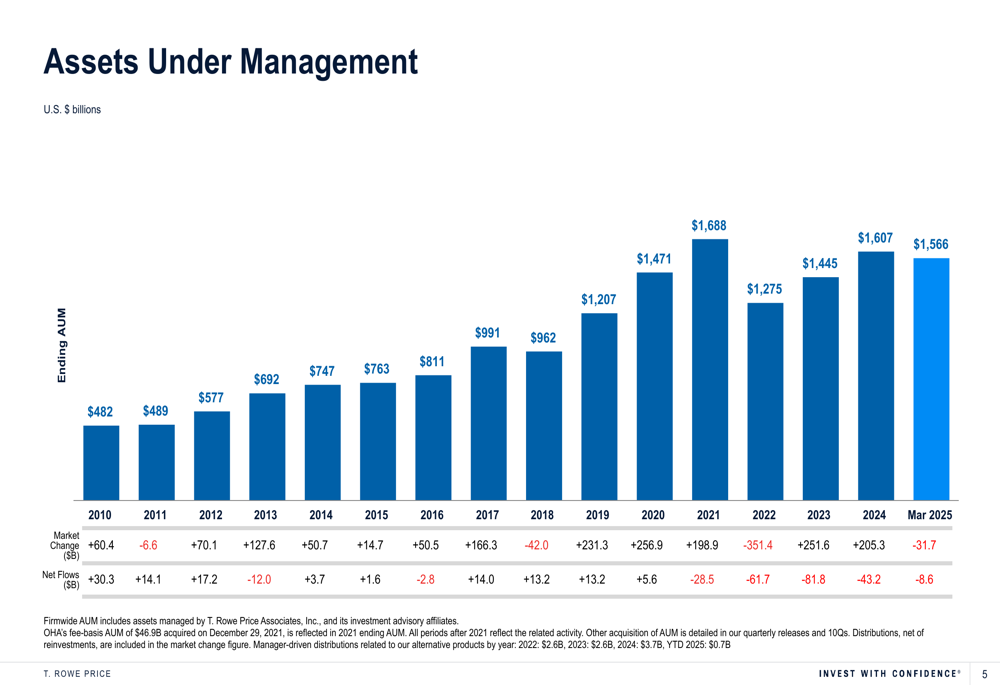
T. Rowe Price reported assets under management (AUM) of $1.57 trillion as of March 31, 2025, representing a 2.5% decrease from $1.61 trillion at the end of Q4 2024, but a 1.9% increase from $1.54 trillion in Q1 2024. The firm experienced net outflows of $8.6 billion during the quarter, which, while concerning, marked an improvement from the $19.3 billion in outflows during Q4 2024.
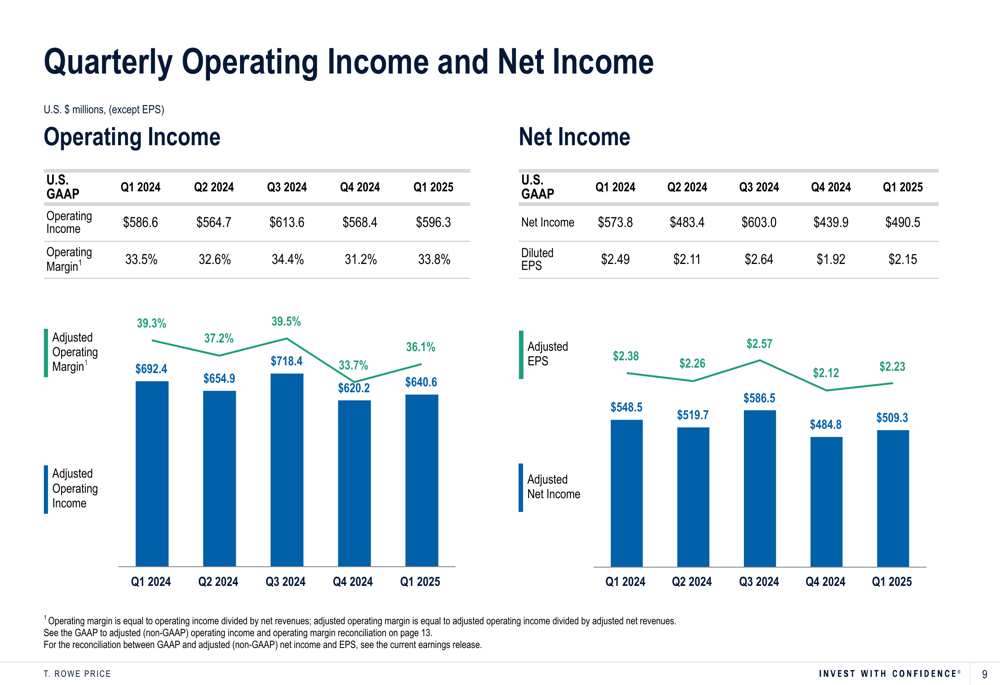
The company’s Q1 2025 GAAP earnings per share (EPS) came in at $2.15, up 12% from $1.92 in Q4 2024 but down 13.7% from $2.49 in the same quarter last year. On an adjusted basis, EPS was $2.23, representing a 5.2% increase from Q4 2024’s $2.12, but a 6.3% decline from $2.38 in Q1 2024.
As shown in the following comprehensive financial overview from the company’s presentation:
Detailed Financial Analysis
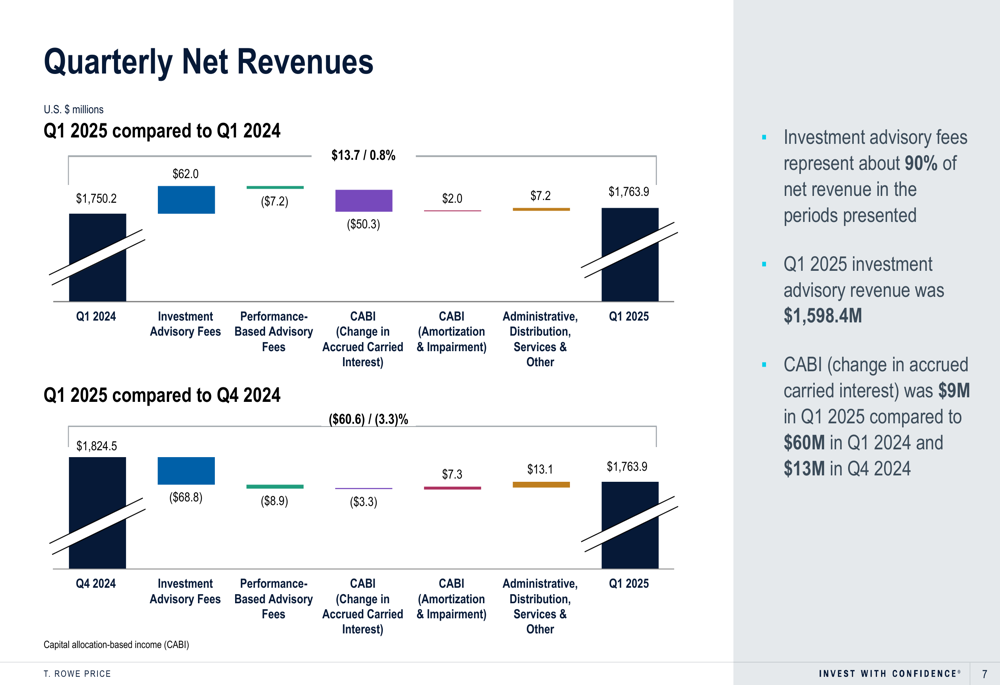
T. Rowe Price generated net revenues of $1.76 billion in Q1 2025, a 3.3% decrease from $1.82 billion in Q4 2024 and a modest 0.8% increase from $1.75 billion in Q1 2024. Investment advisory fees, which represent approximately 90% of the company’s revenue, totaled $1.60 billion for the quarter.
Operating margins showed improvement sequentially, with GAAP operating margin rising to 33.8% from 31.2% in Q4 2024, though still slightly above the 33.5% reported in Q1 2024. Similarly, adjusted operating margin increased to 36.1% from 33.7% in the previous quarter but remained below the 39.3% achieved in Q1 2024.
The following chart illustrates the components contributing to changes in quarterly net revenues:
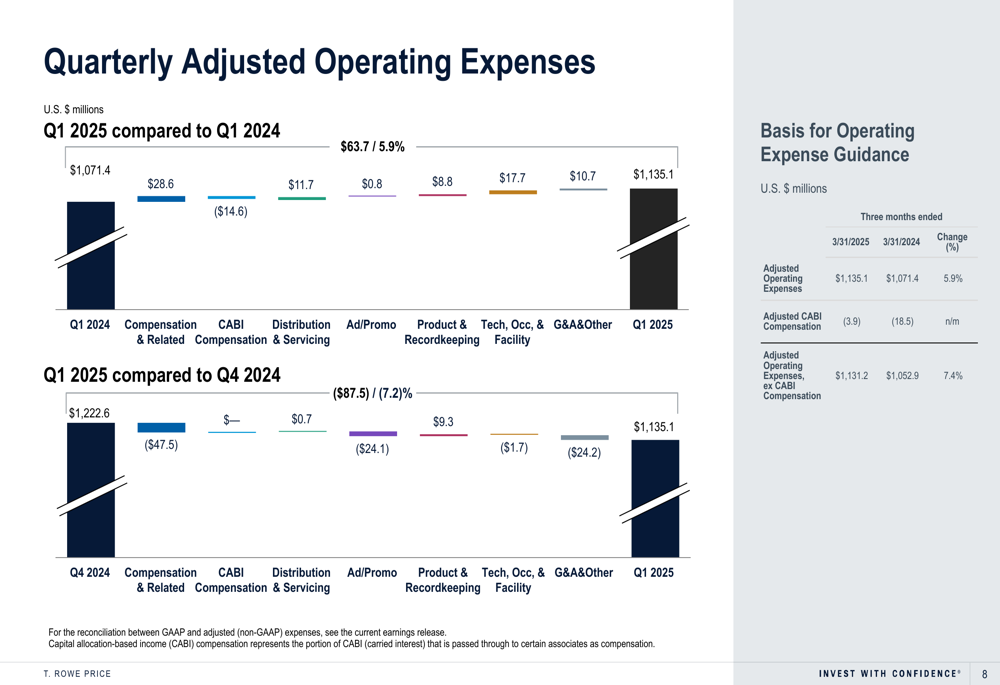
On the expense side, adjusted operating expenses totaled $1.14 billion in Q1 2025, a 7.2% decrease from $1.22 billion in Q4 2024 but a 6% increase from $1.07 billion in Q1 2024. The sequential decrease was primarily driven by lower compensation and related costs, advertising and promotion expenses, and technology, occupancy, and facility costs.
The breakdown of operating expenses and their changes is shown in this chart:
Investment Performance and AUM Trends
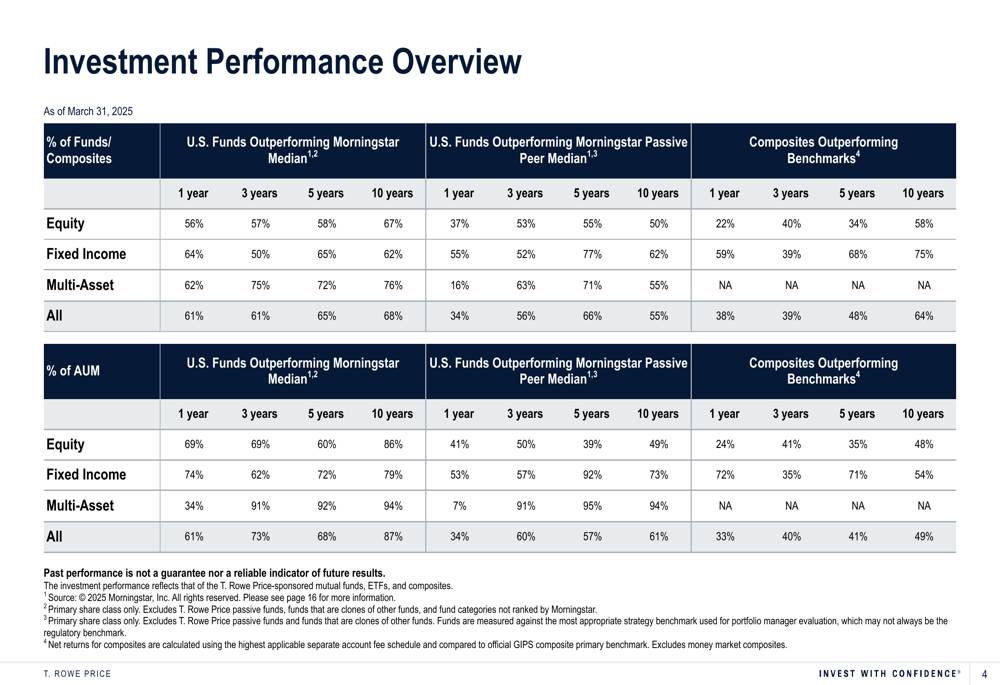
T. Rowe Price’s investment performance showed mixed results across different time periods. For U.S. funds, 56% outperformed their Morningstar median over a one-year period, with this figure improving to 67% over a ten-year horizon. When measured by AUM, the performance looks stronger, with 69% of AUM outperforming the Morningstar median over one year and 86% over ten years.
However, when compared to passive peer medians, the performance was less impressive, with only 37% of funds and 41% of AUM outperforming over a one-year period.
The detailed investment performance metrics are presented in this overview:
Looking at the longer-term AUM trend, T. Rowe Price has shown significant growth over the past decade, more than tripling from $482 billion in 2010 to $1.57 trillion in March 2025, despite some volatility in recent years:
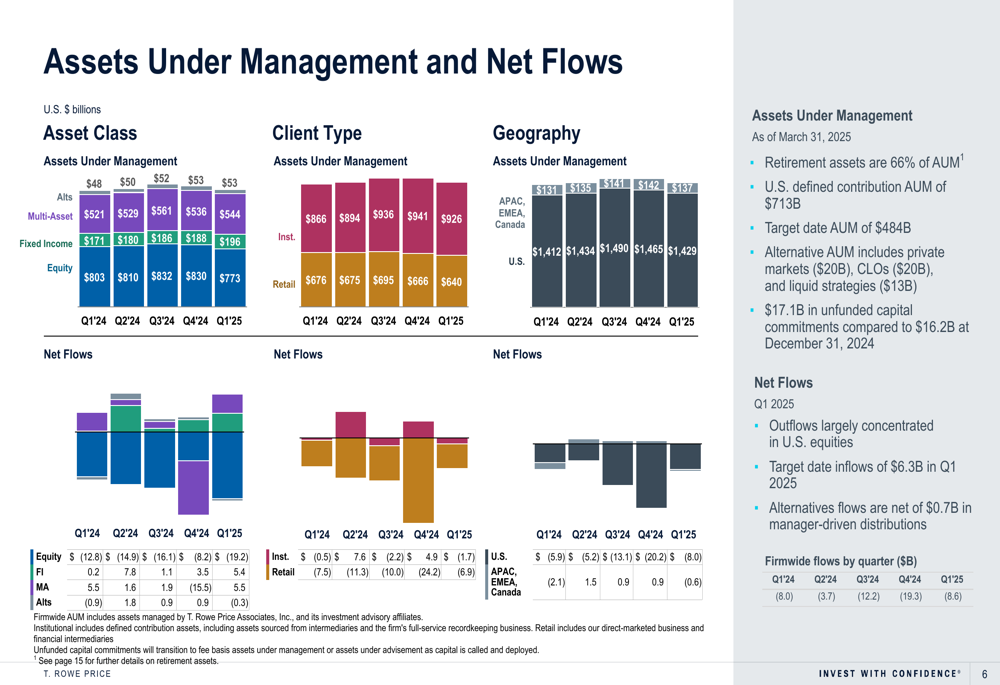
Breaking down the AUM by asset class, client type, and geography provides further insights into the company’s business composition. As of Q1 2025, equity strategies accounted for $773 billion (49.4% of total AUM), multi-asset strategies for $544 billion (34.7%), fixed income for $196 billion (12.5%), and alternatives for $53 billion (3.4%). Institutional clients represented 59.1% of AUM at $926 billion, while retail clients accounted for 40.9% at $640 billion. Geographically, the U.S. market dominated with 91.2% of AUM ($1.43 trillion).
The following chart details these breakdowns and their recent trends:
Capital Management and Outlook
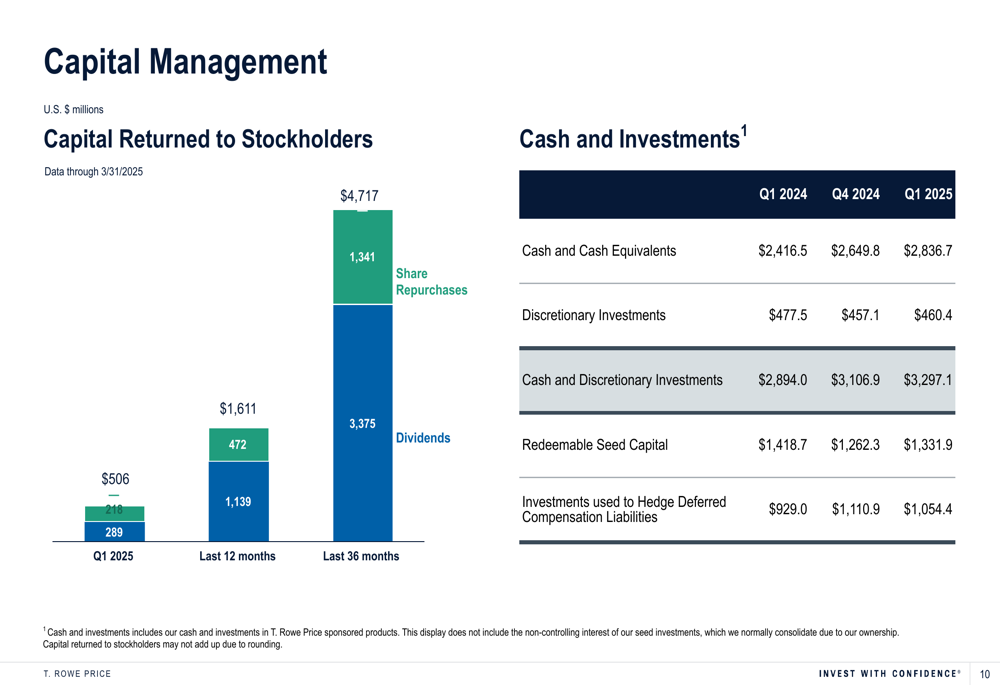
T. Rowe Price maintained its strong financial position, increasing its quarterly dividend to $1.27 per share, up from $1.24 in both Q1 and Q4 2024. The company’s cash and discretionary investments grew to $3.30 billion as of March 31, 2025, compared to $3.11 billion at the end of 2024 and $2.89 billion a year earlier.
The firm’s quarterly operating income and net income, while down year-over-year, showed improvement from the previous quarter:
T. Rowe Price continues to return capital to shareholders through dividends and share repurchases, while maintaining a robust balance sheet to support future growth initiatives:
In the alternatives space, the company noted that $19 billion of alternatives fee-basis assets under management are eligible to earn carried interest. The firm’s retirement business remains a key focus area, with $712.7 billion in U.S. defined contribution assets as of March 2025, representing 45.5% of total AUM.
While the presentation doesn’t provide explicit forward guidance, the sequential improvements in operating margins and EPS, coupled with the reduction in net outflows compared to the previous quarter, suggest the company may be stabilizing after facing headwinds in recent quarters. However, continued pressure on fee rates and mixed short-term investment performance remain challenges that could impact future growth.
Full presentation:
This article was generated with the support of AI and reviewed by an editor. For more information see our T&C.