Asahi shares mark weekly slide after cyberattack halts production

Introduction & Market Context
Tanger Inc. (NYSE:SKT) released its Q2 2025 management presentation on August 4, 2025, highlighting strong operational metrics and strategic growth initiatives. The stock closed at $29.52, up 3.27% on the day, showing investor confidence despite the company’s mixed Q1 2025 results when it missed EPS expectations but exceeded revenue forecasts.
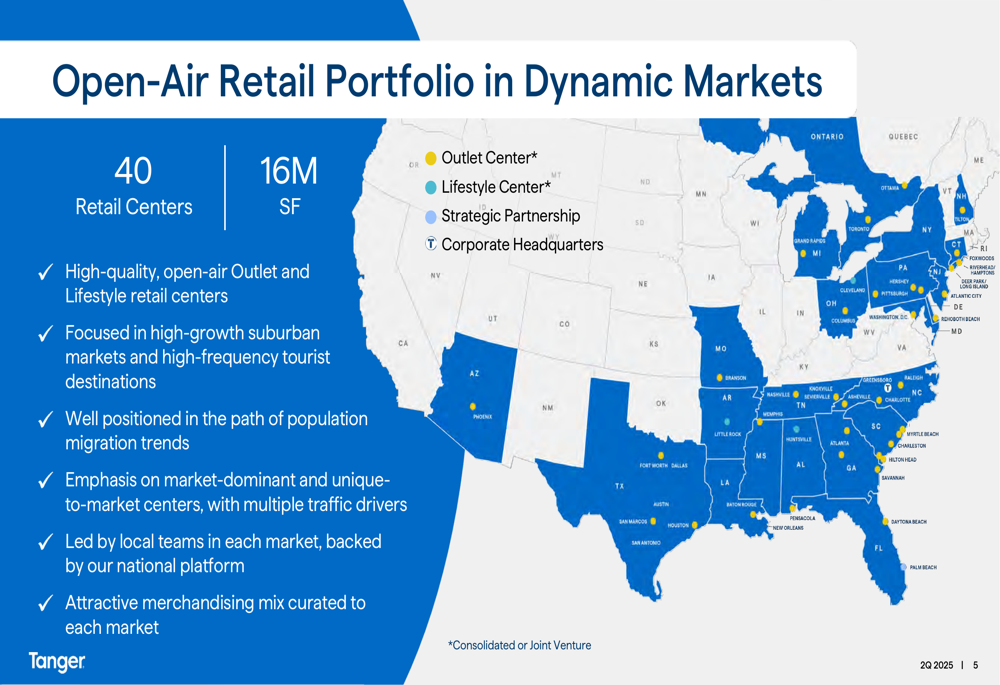
The presentation comes as Tanger continues its evolution from a pure outlet center operator to a more diversified retail real estate platform, with recent expansions into lifestyle centers. With 40 retail centers spanning 16 million square feet across the United States, Tanger has positioned itself in high-growth suburban markets and tourist destinations.
Quarterly Performance Highlights
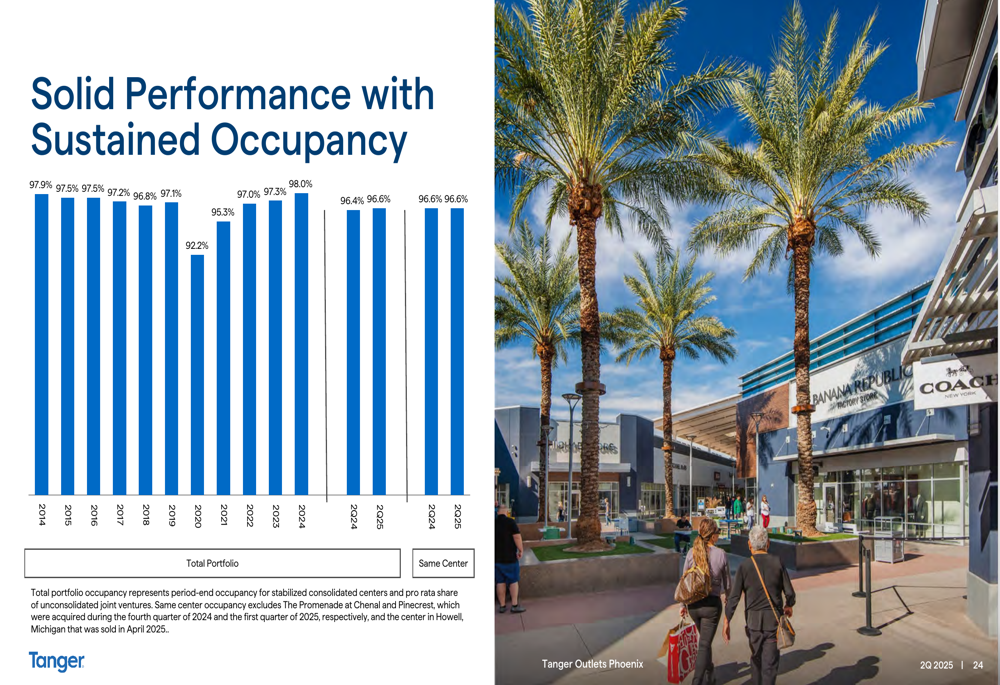
Tanger reported robust operating metrics for Q2 2025, led by a 96.6% occupancy rate, up from the 95.8% reported in Q1. The company achieved a 3.8% increase in same-center net operating income (NOI) compared to Q2 2024, outpacing the 2.3% growth seen in Q1 and aligning with the company’s full-year guidance of 2.5% to 4.0%.
As shown in the following chart of operating metrics, Tanger has maintained 14 consecutive quarters of positive rent spreads, with blended cash rent spreads of 12.0% for executed comparable leases over the trailing twelve months:
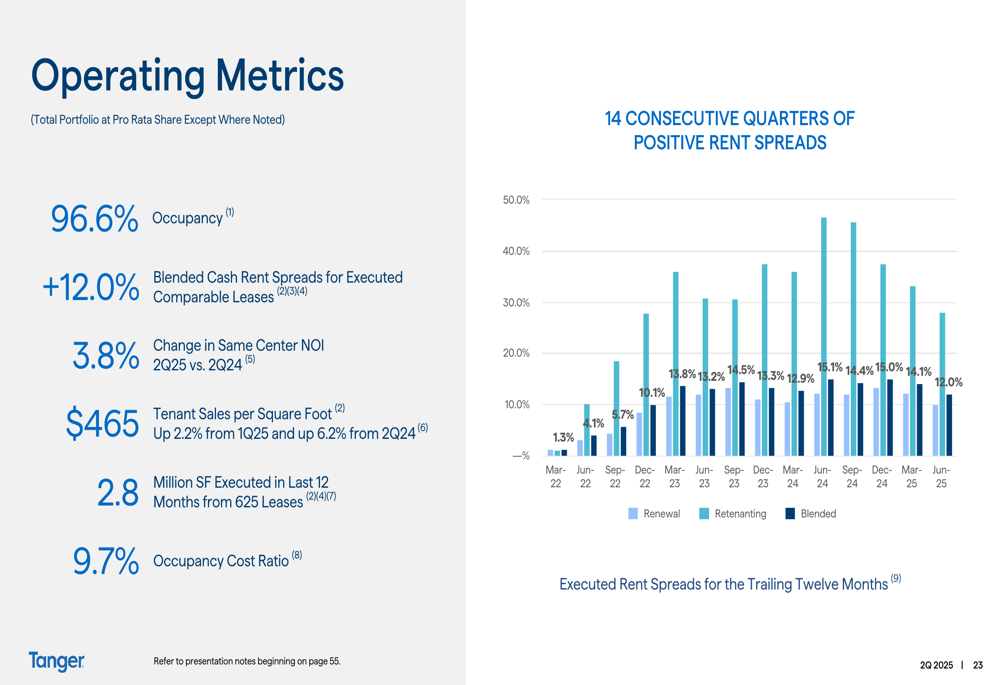
Tenant sales performance remained solid at $465 per square foot on a trailing twelve-month basis, while the company executed 2.8 million square feet of leases in the last 12 months across 625 agreements. The occupancy cost ratio of 9.7% suggests tenants can sustain current rent levels, providing potential for future rent growth.
The company’s historical occupancy trends demonstrate consistent performance, maintaining rates above 90% even through challenging retail environments:
Strategic Expansion Initiatives
Tanger has deployed over $650 million since 2023 on strategic acquisitions and developments, expanding beyond its traditional outlet center model. The company’s portfolio now includes open-air lifestyle centers, which provide exposure to a broader range of retail formats and tenant categories.
The company’s nationwide presence spans key markets, with 93% of its outlet square footage located in leading tourist destinations or top 50 metropolitan statistical areas:
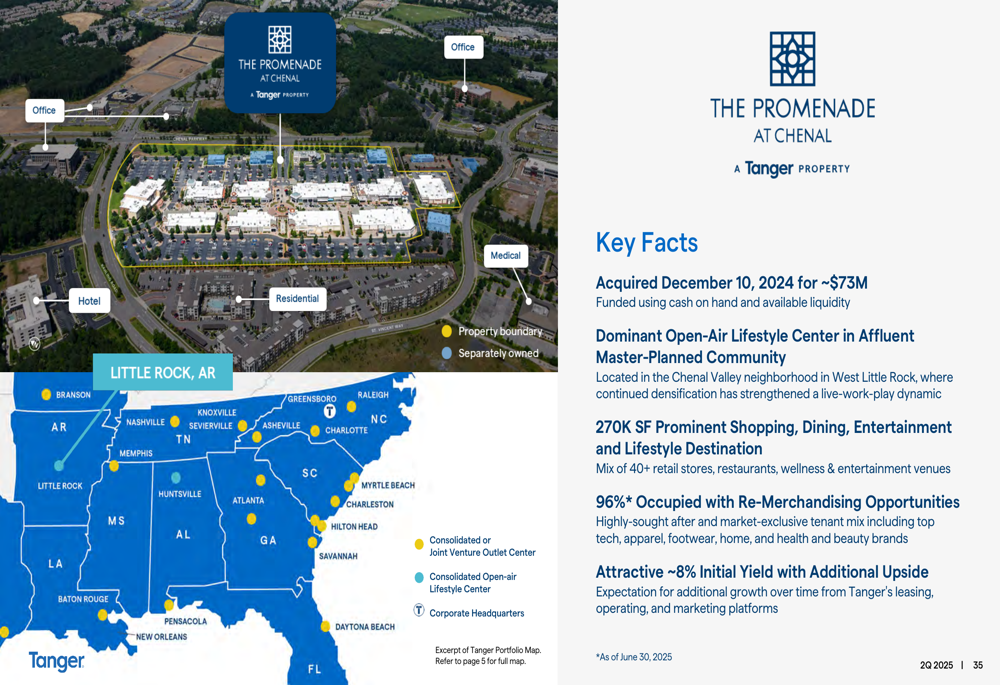
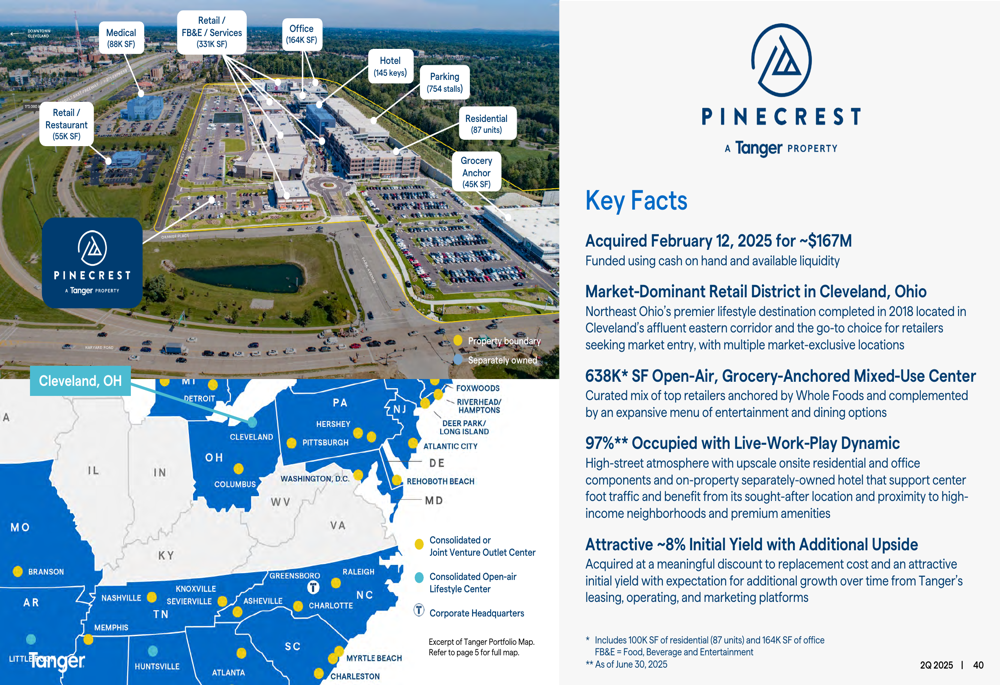
Recent acquisitions include The Promenade at Chenal in Little Rock, Arkansas, purchased in December 2024 for approximately $73 million, and Pinecrest near Cleveland, Ohio, acquired in February 2025 for approximately $167 million. Both properties were acquired at attractive initial yields of around 8% with additional upside potential.
The Promenade at Chenal features 270,000 square feet of retail space with 96% occupancy, situated in an affluent master-planned community:
Similarly, Pinecrest represents a market-dominant retail district in Cleveland with 638,000 square feet of open-air, grocery-anchored mixed-use space and 97% occupancy:
Balance Sheet & Financial Position
Tanger maintains a conservative financial profile with $1.7 billion in net debt against a total enterprise value of $5.3 billion. The company’s leverage ratio stands at 5.0x net debt to adjusted EBITDAre, with an interest coverage ratio of 4.6x.
The company’s capital structure and debt profile are illustrated in the following chart:
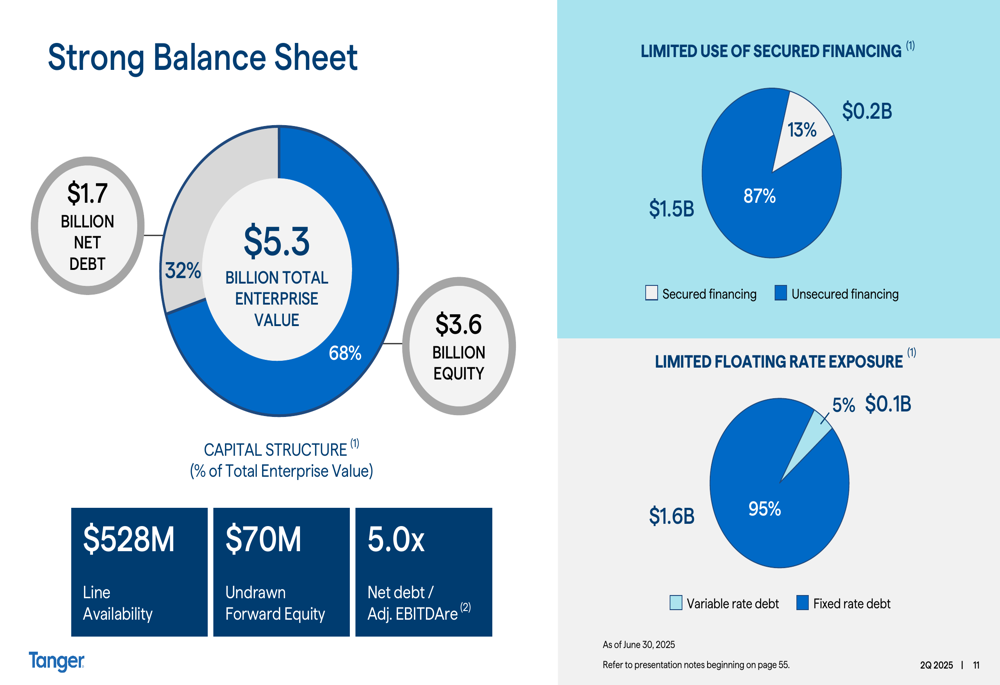
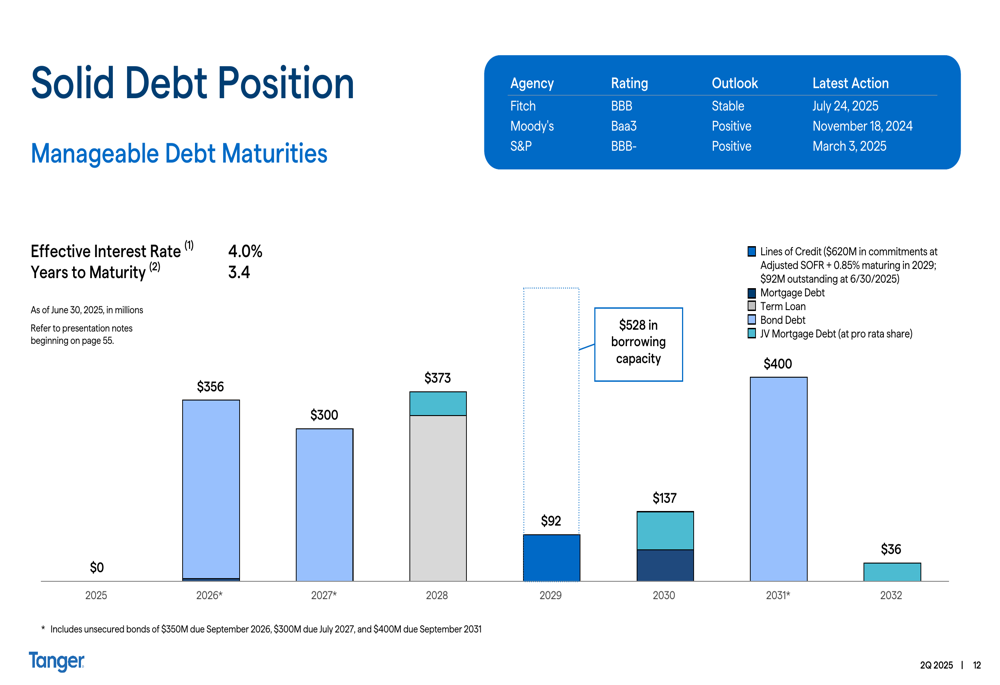
Tanger’s debt position appears manageable with an effective interest rate of 4.0% and weighted average maturity of 3.4 years. The company has prioritized fixed-rate financing, with 95% of debt at fixed rates, limiting exposure to interest rate fluctuations. Additionally, 87% of financing is unsecured, providing greater operational flexibility.
The company maintains substantial liquidity with $528 million in line availability and $70 million in undrawn forward equity, positioning it well for future growth opportunities:
Forward Outlook
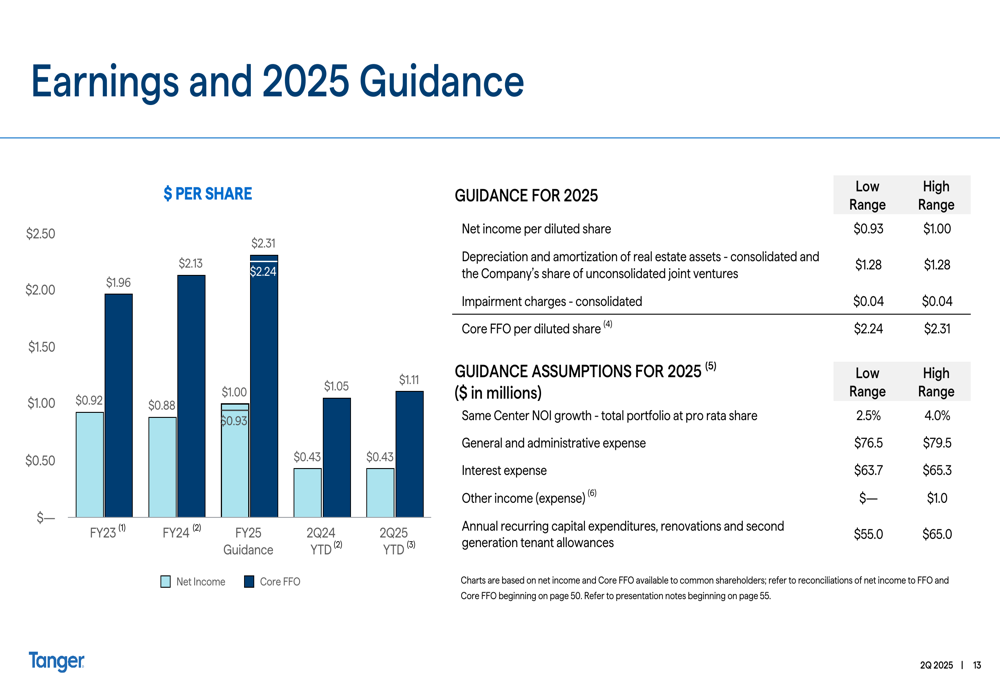
For 2025, Tanger has provided guidance for core FFO per diluted share between $2.22 and $2.30, consistent with the range mentioned in its Q1 earnings report. The company expects same-center NOI growth of 2.5% to 4.0% for the full year.
Tanger’s leasing pipeline remains robust, with upcoming lease expirations providing opportunities for rent growth and tenant mix optimization. The company is focused on four core strategies: driving rents, diversifying tenant assortment, increasing occupancy, and activating peripheral land.
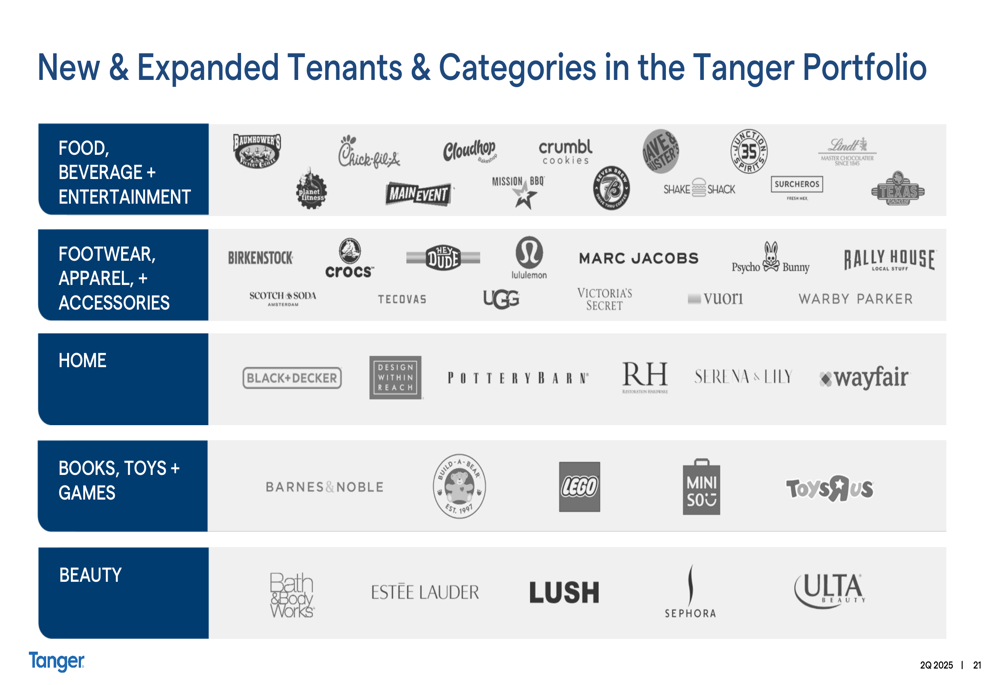
The company continues to diversify its tenant roster beyond traditional apparel retailers, expanding into food and beverage, entertainment, home goods, and beauty categories:
Despite the positive momentum shown in the Q2 presentation, investors should note the company’s Q1 EPS miss and subsequent stock decline, suggesting ongoing challenges in cost management that could impact future earnings performance. However, the strong occupancy rates and consistent NOI growth indicate resilience in Tanger’s core business model as it executes its strategic expansion beyond traditional outlet centers.
Full presentation:
This article was generated with the support of AI and reviewed by an editor. For more information see our T&C.