Fubotv earnings beat by $0.10, revenue topped estimates

Introduction & Market Context
TPG Inc. (NYSE:TPG) released its second quarter 2025 financial results on August 6, 2025, revealing strong performance across key metrics. The alternative asset management firm reported a significant turnaround with net income of $30.1 million compared to a net loss of $57.6 million in the same period last year. In premarket trading, TPG shares rose 4.75% to $60.00, reflecting positive investor sentiment toward the results.
The company’s performance comes amid a period of growth for the alternative asset management sector, with TPG highlighting record fundraising achievements and substantial asset growth. This marks a notable improvement from the first quarter of 2025, when the company missed EPS forecasts.
Quarterly Performance Highlights
TPG reported After-tax Distributable Earnings (DE) of $268 million for Q2 2025, representing a 26% increase from $207 million in Q2 2024. This growth was primarily driven by realized performance allocations and Fee-Related Earnings (FRE), partially offset by a decrease in realized investment income.
As shown in the following comprehensive breakdown of non-GAAP financial measures, TPG maintained strong performance across its key revenue streams:
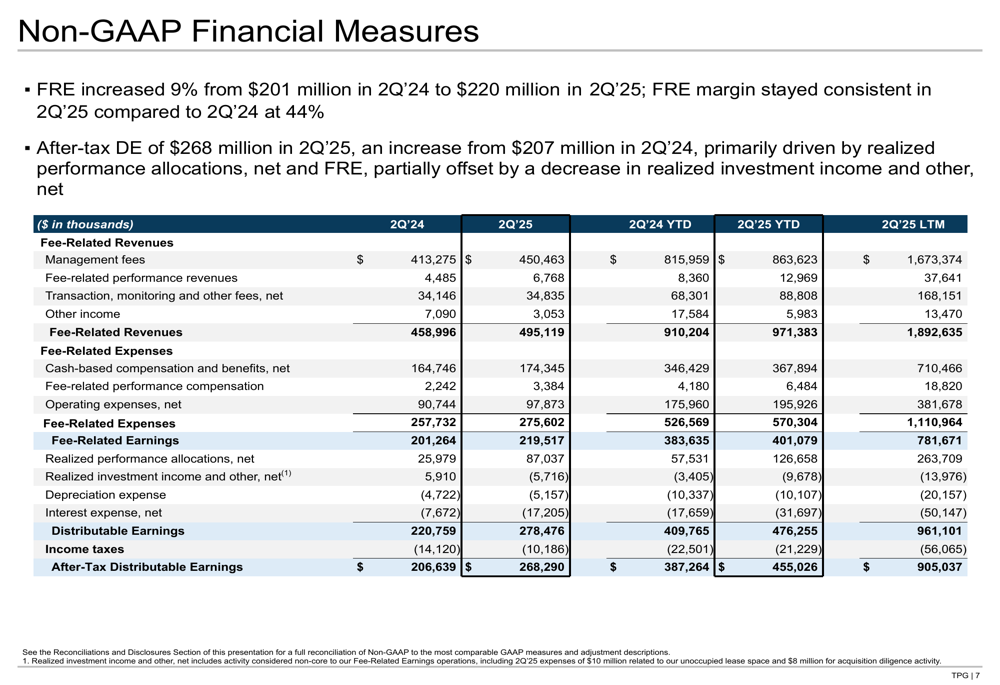
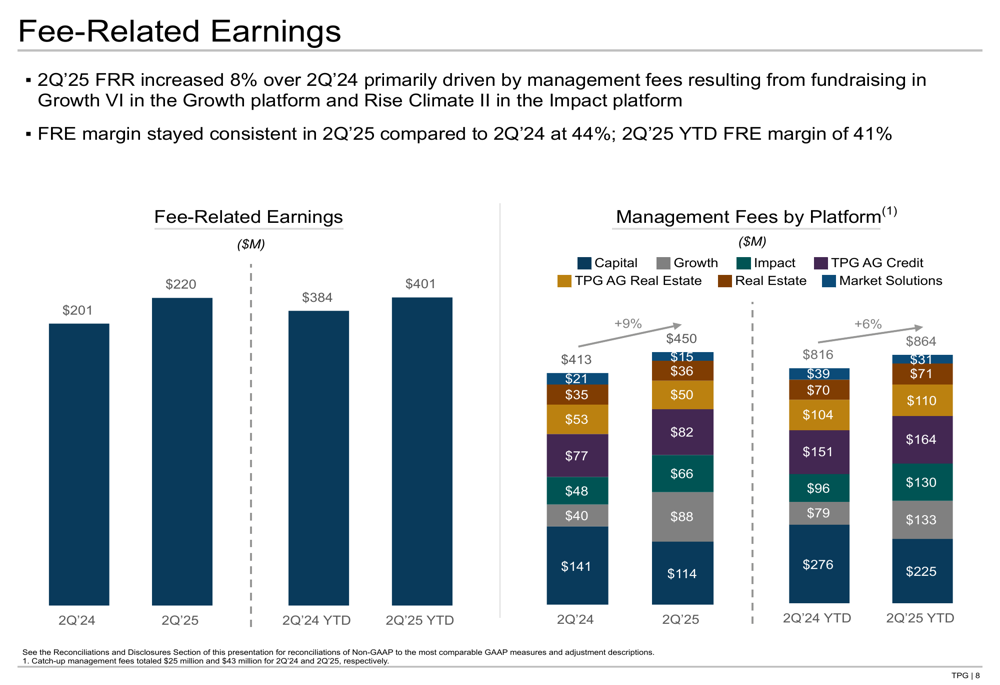
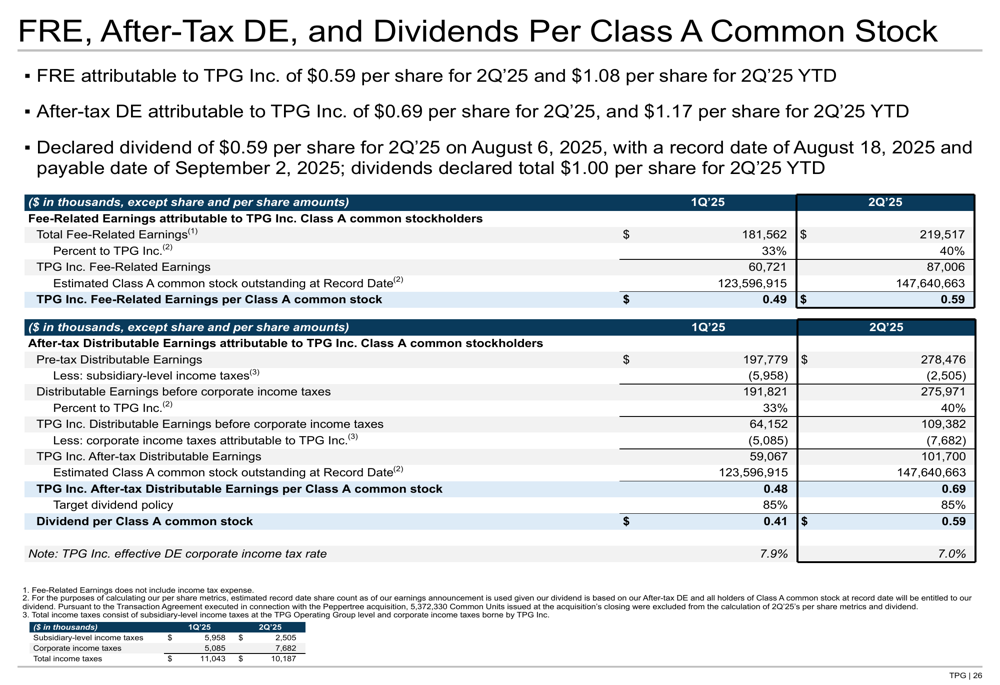
Fee-Related Earnings increased 9% year-over-year to $220 million, while maintaining a consistent FRE margin of 44%. This growth was primarily driven by higher management fees resulting from successful fundraising efforts in the Growth and Impact platforms.
The company’s visualization of Fee-Related Earnings demonstrates the consistent growth pattern across reporting periods:
TPG declared a quarterly dividend of $0.59 per share, with a record date of August 18, 2025, and a payment date of September 2, 2025. This represents a significant portion of the company’s distributable earnings, highlighting TPG’s commitment to shareholder returns.
Detailed Financial Analysis
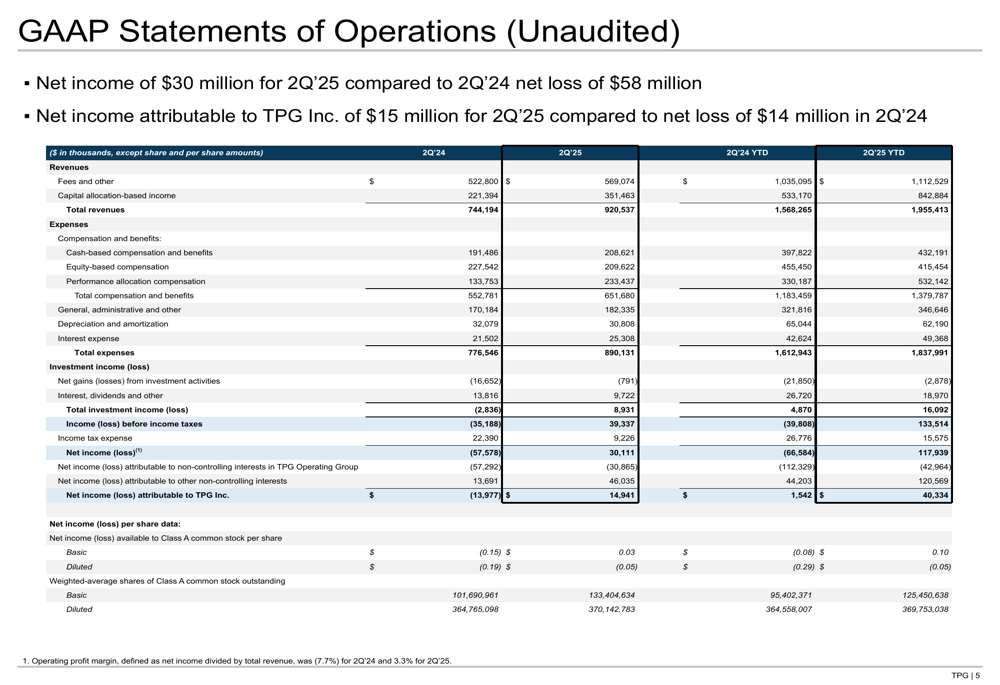
On a GAAP basis, TPG reported total revenues of $956.9 million for Q2 2025, compared to $644.9 million in Q2 2024. The company’s operating profit margin improved significantly, shifting from -7.7% in Q2 2024 to 3.3% in Q2 2025, demonstrating enhanced operational efficiency.
The following GAAP statement of operations provides a comprehensive view of the company’s financial performance:
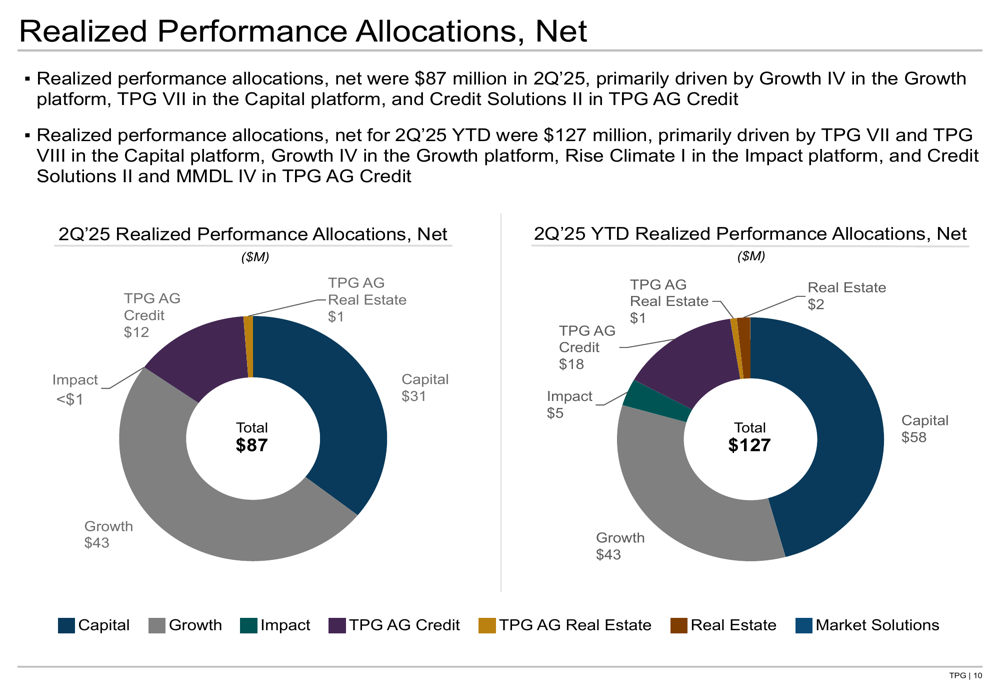
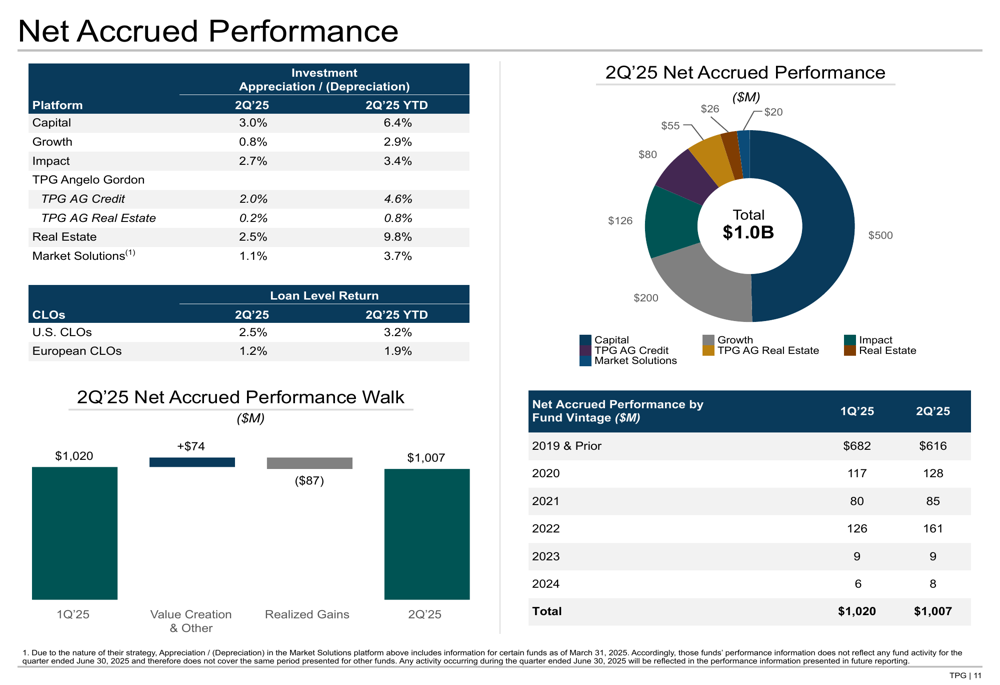
Realized performance allocations were a key driver of TPG’s strong quarterly results, totaling $87 million in Q2 2025. These allocations were primarily generated by Growth IV in the Growth platform, TPG VII in the Capital platform, and Credit Solutions II in TPG AG Credit.
The following chart illustrates the distribution of realized performance allocations across TPG’s various investment platforms:
Net accrued performance, which represents potential future revenue, stood at $1.007 billion at the end of Q2 2025, slightly down from $1.020 billion in Q1 2025. This was primarily due to the realization of $87 million in performance allocations during the quarter, partially offset by $74 million in new value creation.
Assets Under Management
TPG reported total Assets Under Management (AUM) of $261.3 billion as of June 30, 2025, representing a 14% increase from Q2 2024. Fee-Earning Assets Under Management (FAUM) grew 7% year-over-year to $146.4 billion.
The following chart provides a detailed breakdown of AUM and FAUM by investment platform:
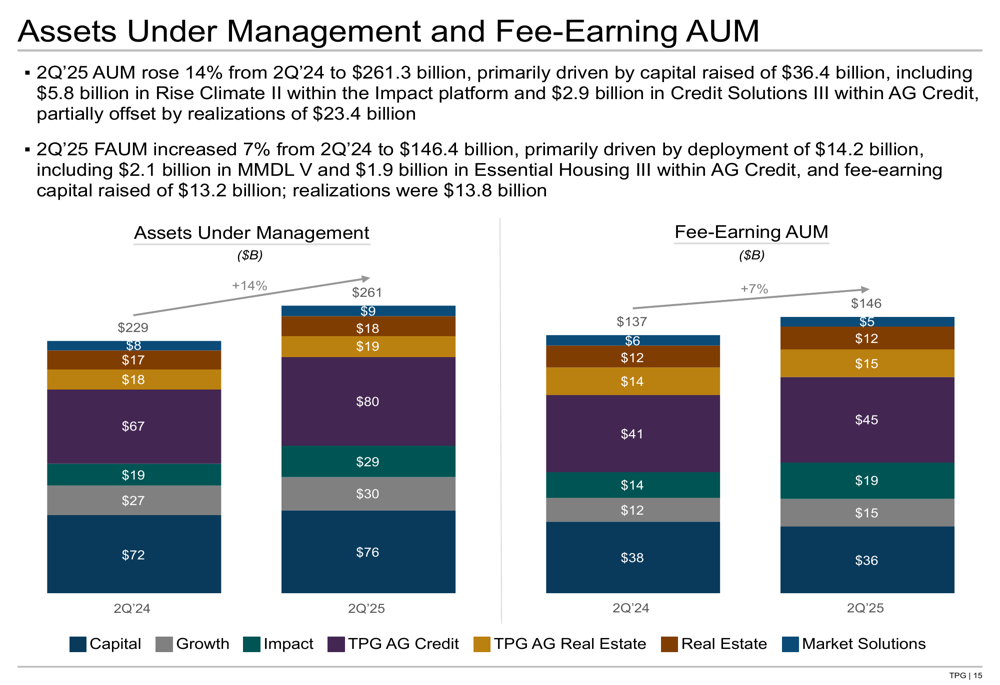
The growth in AUM was primarily driven by $36.4 billion in capital raised over the past year, including $5.8 billion in Rise Climate II within the Impact platform and $2.9 billion in Credit Solutions III within AG Credit. This was partially offset by realizations of $23.4 billion.
TPG’s AUM composition demonstrates a strong foundation for long-term revenue generation, with 66% of AUM in long-dated funds with a duration of 10 or more years, and 14% in perpetual funds. This provides the company with a stable base for management fee generation.
Additionally, TPG reported $30.1 billion in AUM Subject to Fee-Earning Growth, representing potential fee-related revenue opportunities of approximately $194 million annually as this capital is deployed or transitions to higher fee rates.
Balance Sheet and Financial Position
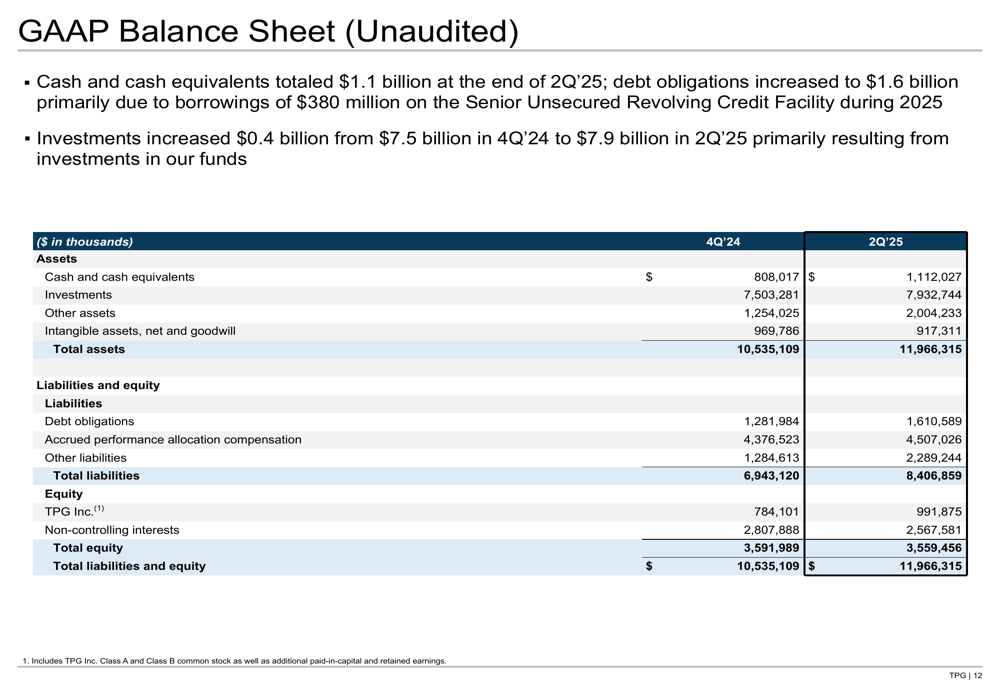
As of June 30, 2025, TPG reported cash and cash equivalents of $1.1 billion. The company’s debt obligations increased to $1.6 billion, primarily due to borrowings of $380 million on the Senior Unsecured Revolving Credit Facility during 2025.
The following balance sheet highlights provide insight into TPG’s financial position:
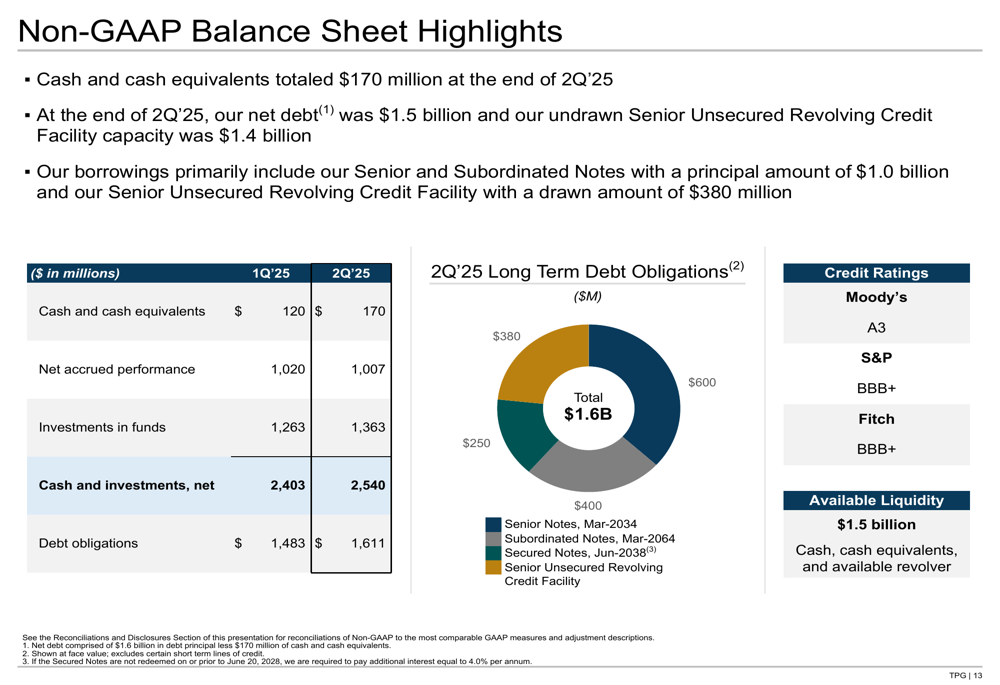
TPG maintains strong credit ratings with Moody’s (A3), S&P (BBB+), and Fitch (BBB+), reflecting the company’s solid financial foundation. The company’s net debt stood at $1.5 billion at the end of Q2 2025, with an undrawn Senior Unsecured Revolving Credit Facility capacity of $1.4 billion.
The following chart provides a breakdown of TPG’s long-term debt obligations:
Forward Outlook
TPG enters the second half of 2025 with strong momentum, having achieved its second-highest fundraising quarter in history and strongest credit fundraising quarter ever. The company has $62.5 billion of available capital for deployment, positioning it well for continued growth.
The company’s FRE, After-Tax DE, and dividend metrics on a per-share basis demonstrate TPG’s ability to generate shareholder value:
With a diverse platform spanning Capital, Growth, Impact, Credit, and Real Estate, TPG is well-positioned to capitalize on investment opportunities across various sectors and geographies. The company’s strong fundraising performance indicates continued investor confidence in TPG’s investment strategies and ability to generate returns.
While the company faces the usual challenges of market volatility and economic uncertainty, its diversified investment approach and substantial available capital provide a solid foundation for navigating these challenges and pursuing growth opportunities.
Full presentation:
This article was generated with the support of AI and reviewed by an editor. For more information see our T&C.