Michigan survey ahead; Applied Digital surges; gold dips - what’s moving markets

Trinity Industries , Inc. (NYSE:TRN) presented its first quarter 2025 financial results on May 1, 2025, reporting a 28% year-over-year revenue decline while maintaining strong lease rates and high fleet utilization. The railcar manufacturer and leasing company posted quarterly earnings per share of $0.29, down from $0.33 in the same period last year, and maintained its full-year EPS guidance of $1.40 to $1.60.
Quarterly Performance Highlights
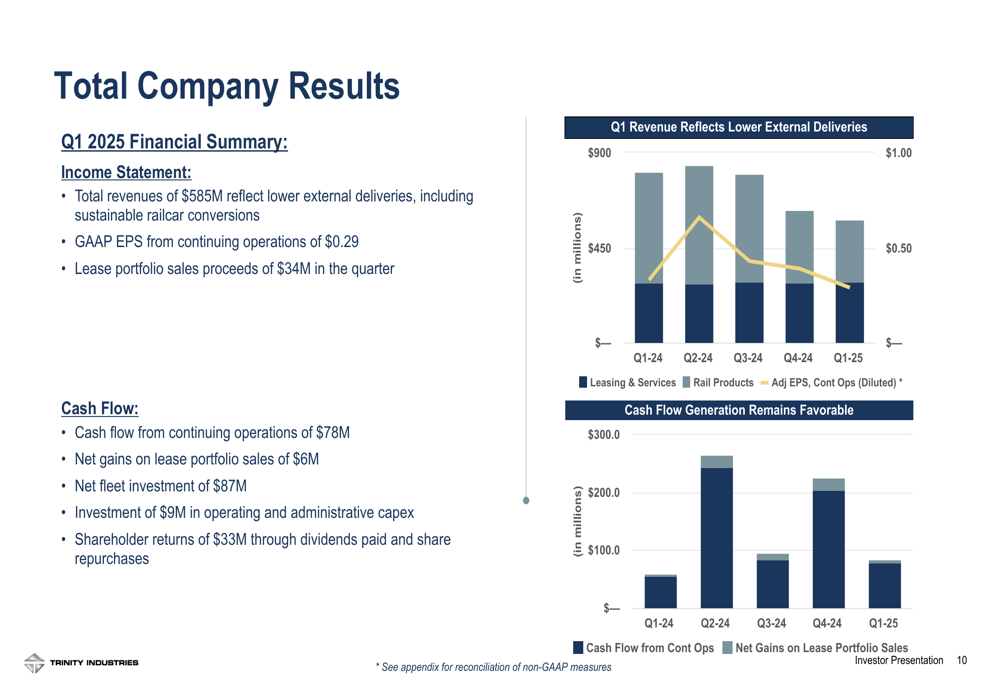
Trinity reported Q1 2025 revenues of $585 million, representing a 28% decrease compared to the same period last year. Despite the revenue decline, the company achieved EPS of $0.29 and generated $78 million in cash flow from continuing operations, a $22 million improvement year-over-year. Trinity’s lease fleet continued to perform well with utilization at 96.8% and Future Lease Rate Differential (FLRD) up 17.9%.
As shown in the following financial results highlights:
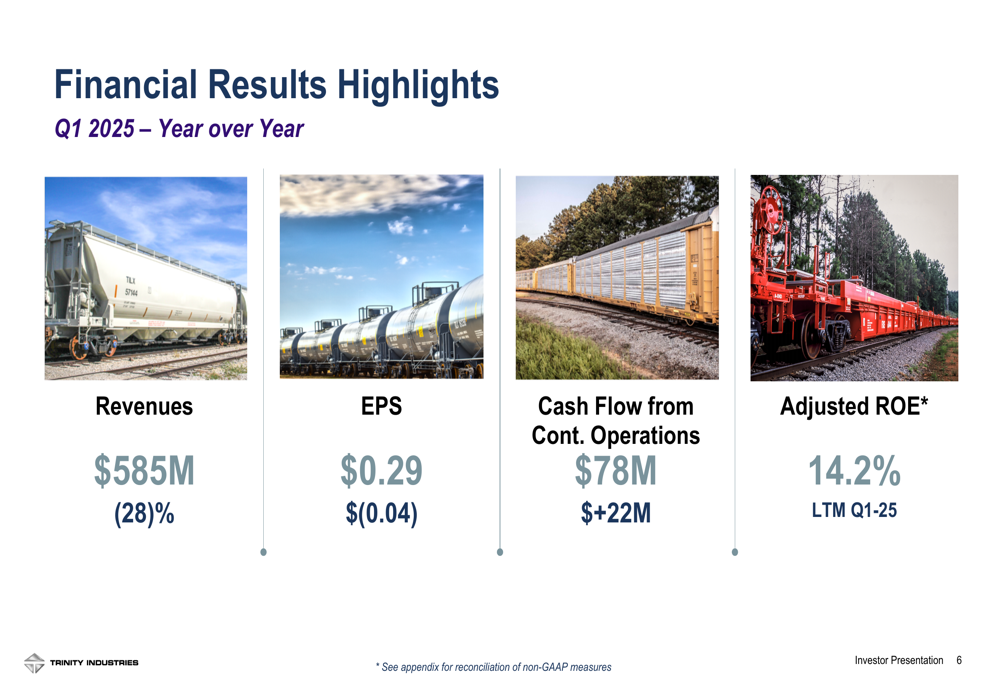
"Quarterly EPS from continuing operations of $0.29 reflects continued strength in lease rates with FLRD up 17.9% and utilization at 96.8%," noted the company in its presentation. Trinity also reported a Last Twelve Months (LTM) Adjusted Return on Equity of 14.2%.
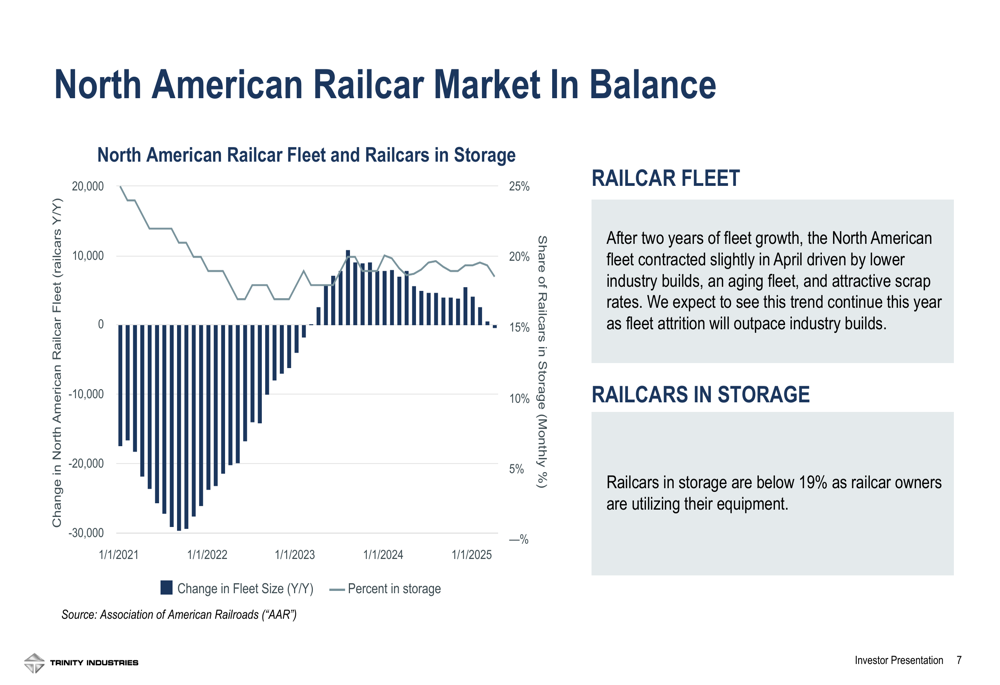
The North American railcar market remains in balance according to Trinity’s analysis, with the railcar fleet contracting slightly in April due to lower industry builds, an aging fleet, and attractive scrap rates. The company expects fleet attrition to outpace industry builds this year, with railcars in storage below 19% as owners utilize their equipment.
As illustrated in this market analysis chart:
Segment Performance Analysis
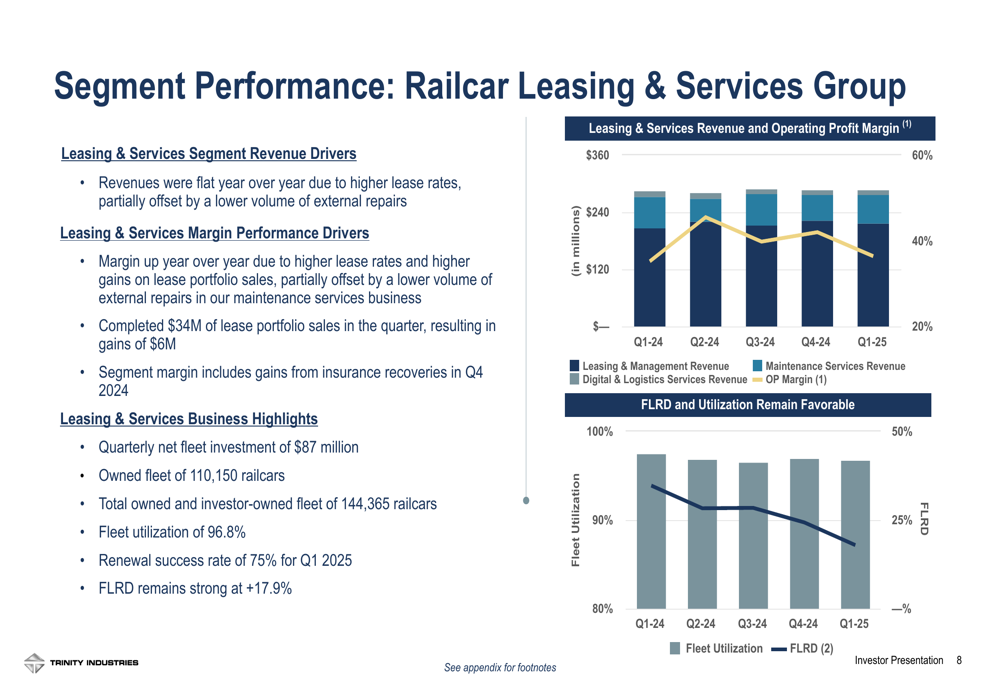
Trinity’s Railcar Leasing & Services Group reported flat year-over-year revenues, with higher lease rates offset by a lower volume of external repairs. The segment’s margin improved due to higher lease rates and gains on lease portfolio sales of $6 million from $34 million in transactions during the quarter. The company maintained strong fleet metrics with 96.8% utilization and a 75% renewal success rate.
The segment performance is detailed in the following chart:
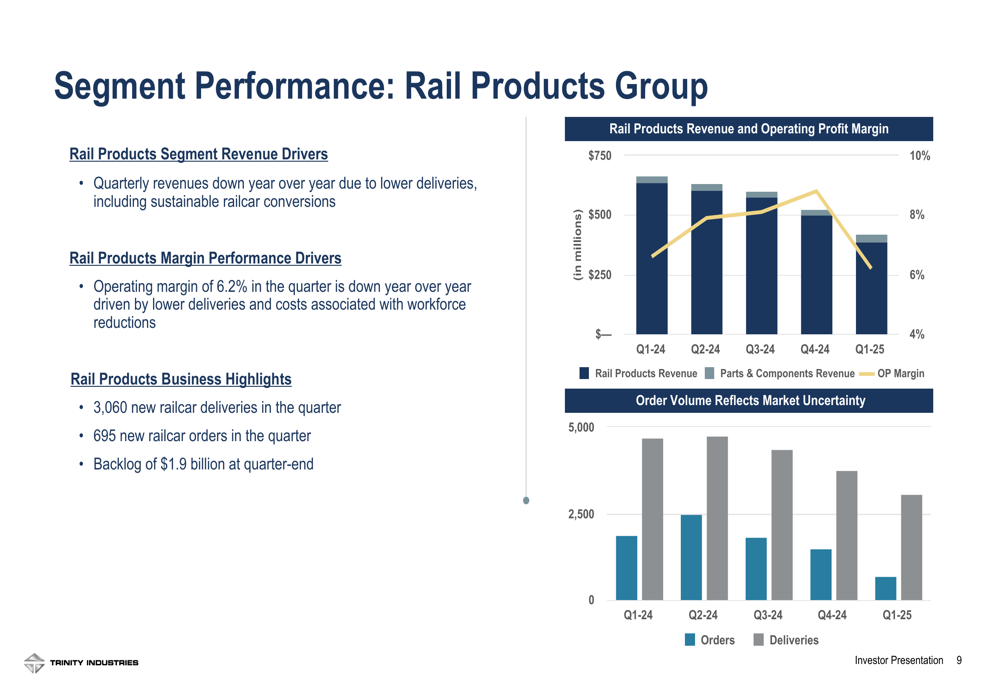
Meanwhile, the Rail Products Group experienced declining performance with quarterly revenues down year-over-year due to lower deliveries, including sustainable railcar conversions. The segment posted an operating margin of 6.2%, lower than the previous year due to reduced deliveries and costs associated with workforce reductions. The group delivered 3,060 new railcars in the quarter while receiving only 695 new orders, resulting in a backlog of $1.9 billion at quarter-end.
The following chart illustrates the Rail Products Group performance:
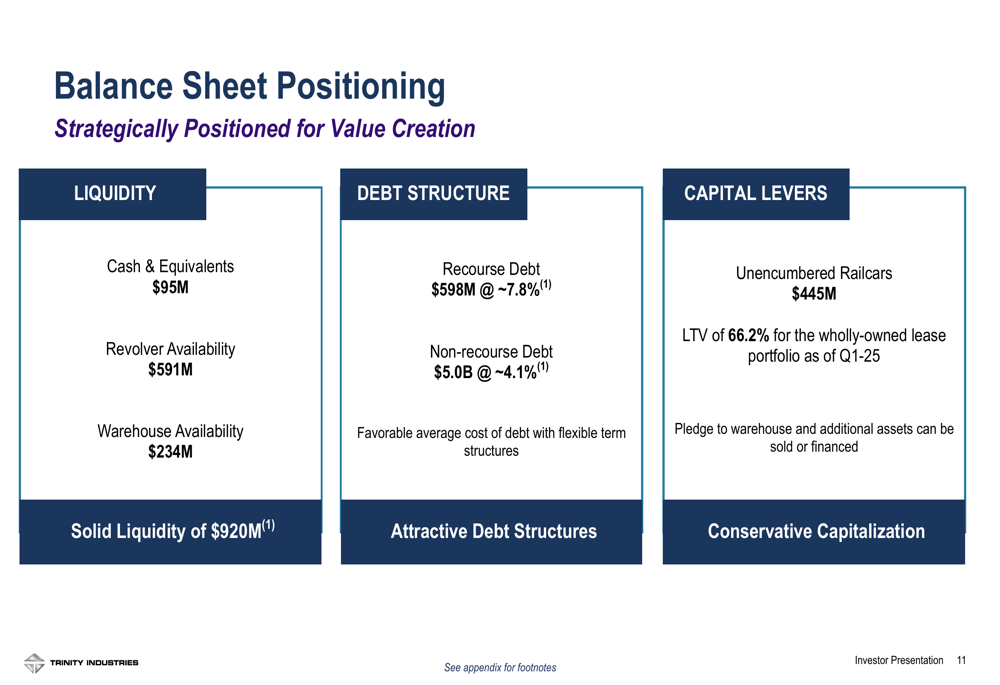
Balance Sheet and Liquidity
Trinity maintained a strong liquidity position of $920 million as of Q1 2025, consisting of $95 million in cash and equivalents, $591 million in revolver availability, and $234 million in warehouse availability. The company reported recourse debt of $598 million at approximately 7.8% interest and non-recourse debt of $5.0 billion at approximately 4.1%. The loan-to-value ratio for the wholly-owned lease portfolio stood at 66.2%.
The company’s balance sheet positioning is summarized in this slide:
During the quarter, Trinity invested $87 million in its lease fleet and returned $33 million to shareholders through dividends and share repurchases. The company completed $34 million in lease portfolio sales, resulting in net gains of $6 million.
As shown in the following total company results:
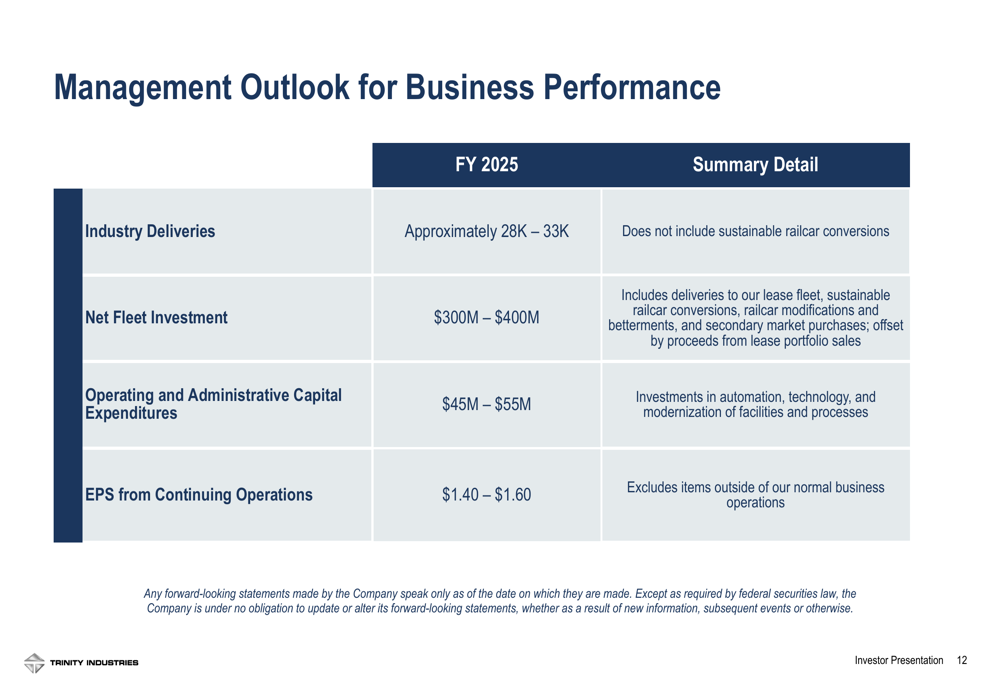
Management Outlook and Guidance
Looking ahead, Trinity’s management maintained its full-year 2025 EPS guidance of $1.40 to $1.60, excluding items outside normal business operations. The company expects industry-wide railcar deliveries to reach approximately 28,000 to 33,000 units (excluding sustainable railcar conversions). Trinity forecasts its net fleet investment to be between $300 million and $400 million, including deliveries to its lease fleet, sustainable railcar conversions, railcar modifications, and secondary market purchases, offset by proceeds from lease portfolio sales.
The management outlook is detailed in the following guidance:
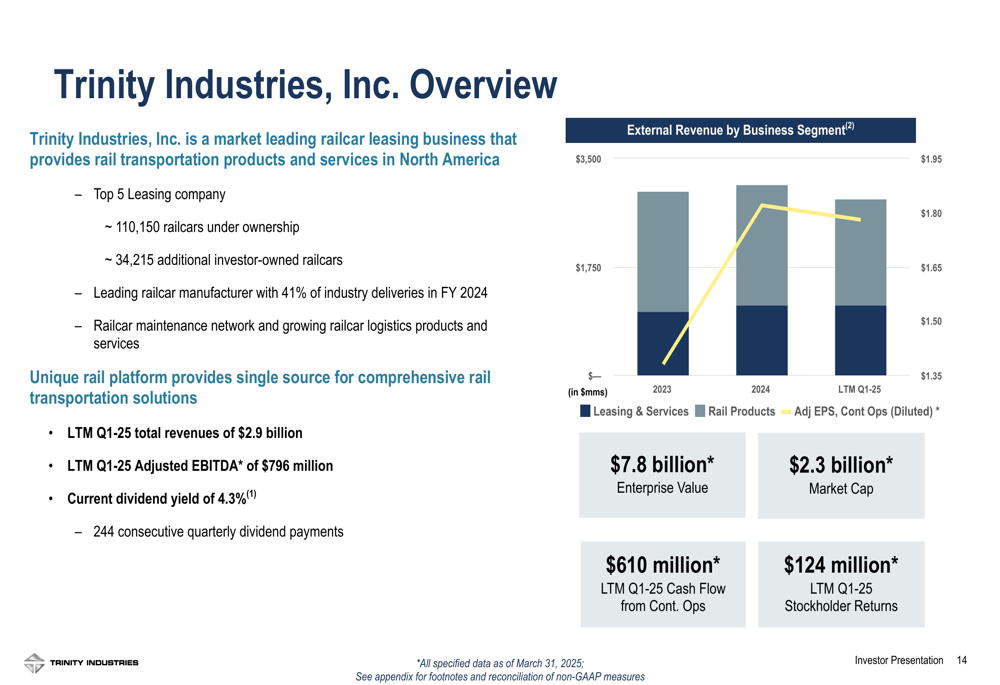
Trinity emphasized its position as a market-leading railcar leasing business in North America and a top manufacturer with 41% of industry deliveries in FY 2024. The company highlighted its comprehensive rail transportation solutions and long-term strategy focused on optimizing customer ownership and usage of railcar equipment.
As illustrated in this company overview:
Trinity’s capital allocation strategy remains focused on returns, with a disciplined approach to balancing cash holdings, debt repayment, return of capital to shareholders, capital investments, and fleet investments. The company continues to position railcars as sustainable long-term investments with stable cash flows, tax advantages, and environmental benefits.
The company’s stock closed at $25.10 on April 30, 2025, with premarket trading on May 1 indicating a 1.12% decline to $24.82.
Full presentation:
This article was generated with the support of AI and reviewed by an editor. For more information see our T&C.