Eos Energy stock falls after Fuzzy Panda issues short report

Introduction & Market Context
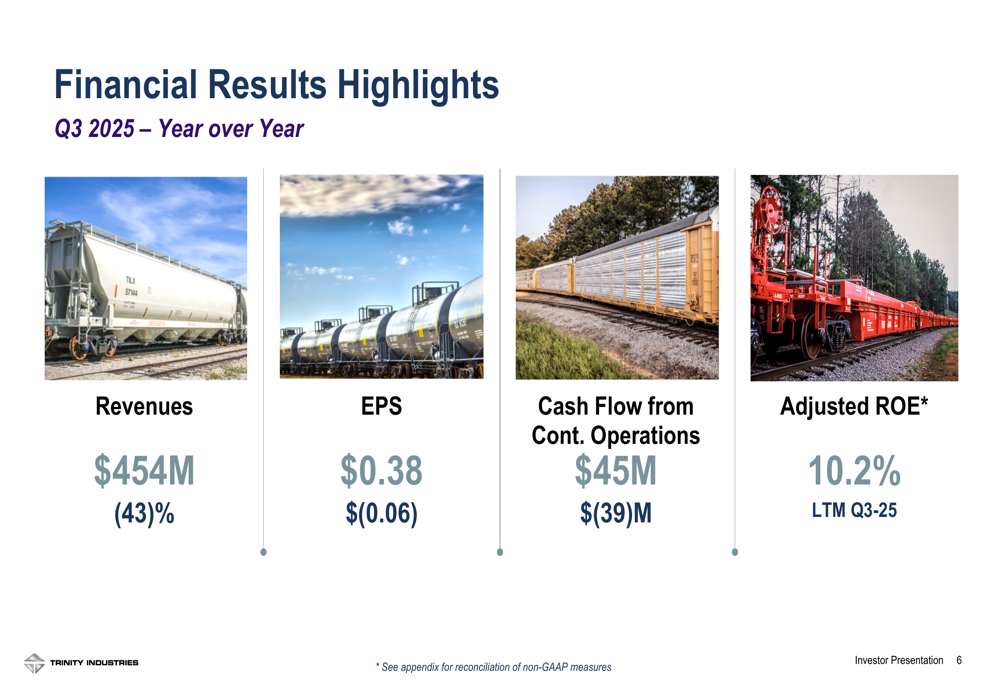
Trinity Industries (NYSE:TRN) presented its third quarter 2025 results on October 30, revealing a mixed performance characterized by earnings growth despite significant revenue challenges. The railcar manufacturer and lessor reported earnings per share (EPS) of $0.38, exceeding analyst expectations of $0.35, while revenue came in at $454 million, falling short of the anticipated $532.66 million.
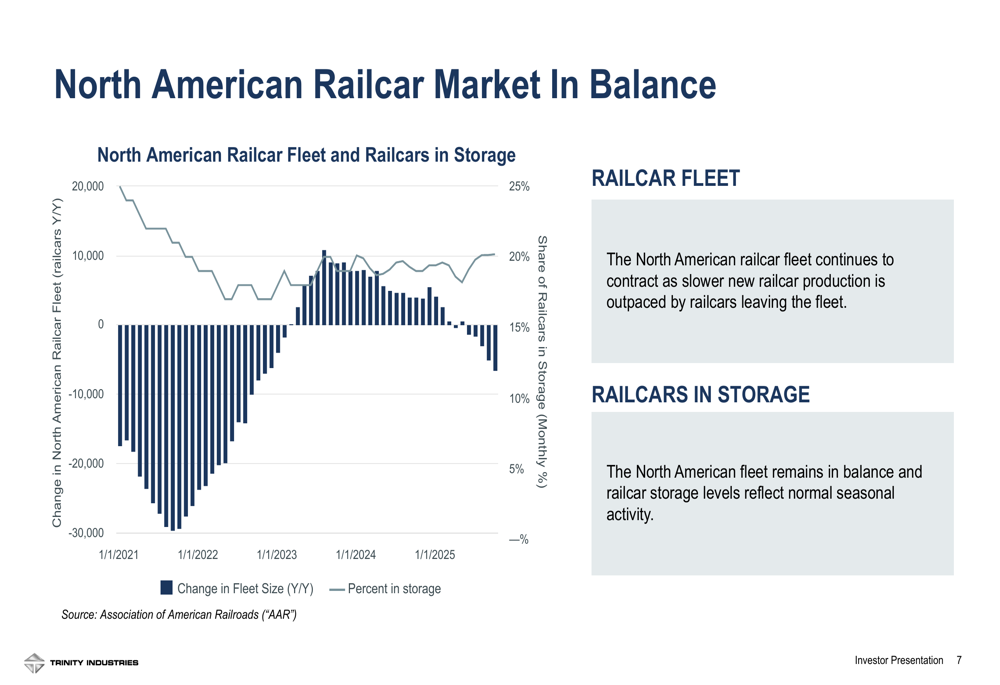
Following the earnings release, Trinity’s stock declined 1.45% to close at $27.83, reflecting investor concerns over the revenue miss despite the improved earnings outlook. The company operates in a North American railcar market that remains in balance, with fleet contraction as slower new railcar production is outpaced by railcars leaving service.
As shown in the following chart depicting railcar fleet trends and storage levels:
Quarterly Performance Highlights
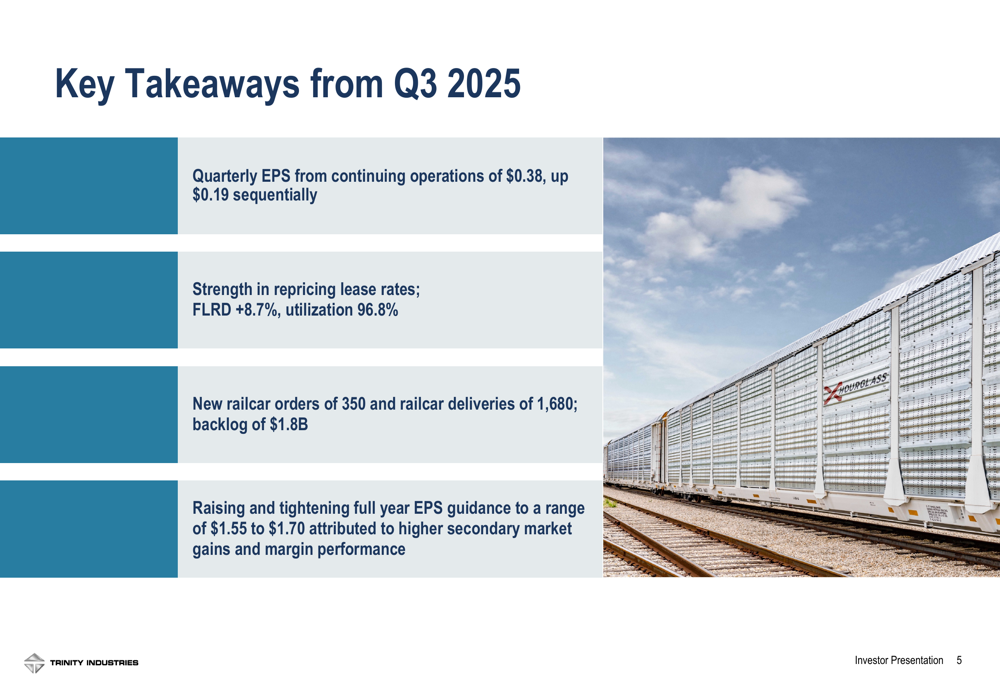
Trinity reported Q3 2025 EPS of $0.38, up $0.19 sequentially, despite revenues declining 43% year-over-year. The company highlighted strong performance in lease rate repricing, with a Fleet Lease Rate Differential (FLRD) of +8.7% and utilization maintaining a robust 96.8%. Cash flow from continuing operations reached $45 million, compared to negative $39 million in the year-ago period.
The quarter’s key financial metrics demonstrate the company’s ability to generate improved profitability despite revenue challenges:
Based on the quarter’s performance, Trinity raised and tightened its full-year EPS guidance to a range of $1.55 to $1.70, attributing the improvement to higher secondary market gains and margin performance. The company secured new railcar orders of 350 units while delivering 1,680 railcars during the quarter, maintaining a backlog valued at $1.8 billion.
Segment Analysis: Leasing & Services vs. Rail Products
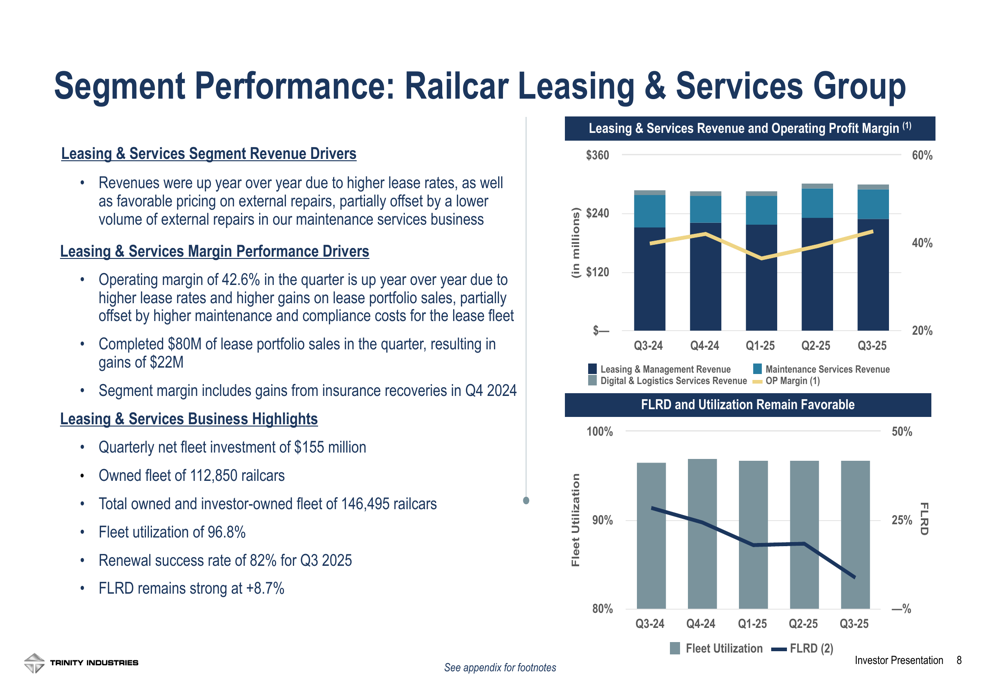
Trinity’s performance revealed a stark contrast between its two main business segments. The Railcar Leasing & Services Group demonstrated strong results with revenues increasing year-over-year due to higher lease rates and favorable pricing on external repairs. The segment achieved an operating margin of 42.6%, improved from the previous year, and generated $22 million in gains from $80 million in lease portfolio sales.
The leasing segment’s performance metrics show consistent improvement in both utilization and lease rates:
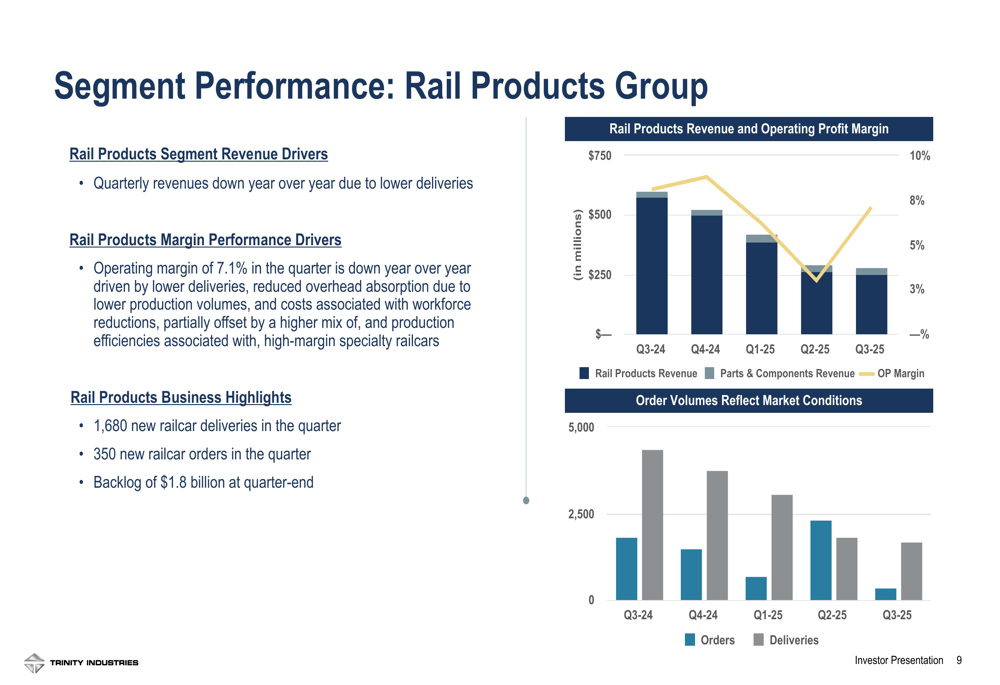
In contrast, the Rail Products Group faced headwinds with quarterly revenues declining year-over-year due to lower deliveries. Operating margin fell to 7.1%, driven primarily by reduced production volume. The segment delivered 1,680 new railcars in the quarter while securing 350 new orders, maintaining a backlog of $1.8 billion at quarter-end.
The following chart illustrates the Rail Products Group’s performance trends:
CEO Jean Savage noted during the earnings call, "Trinity is raising and tightening full-year EPS guidance to $1.55 to $1.70, reflecting our confidence in the business model and execution capabilities." Meanwhile, CFO Eric Marchetto highlighted that "the secondary market has turned into the primary way that other operating lessors are growing their fleet because of the softness in the new car market."
Balance Sheet & Capital Allocation
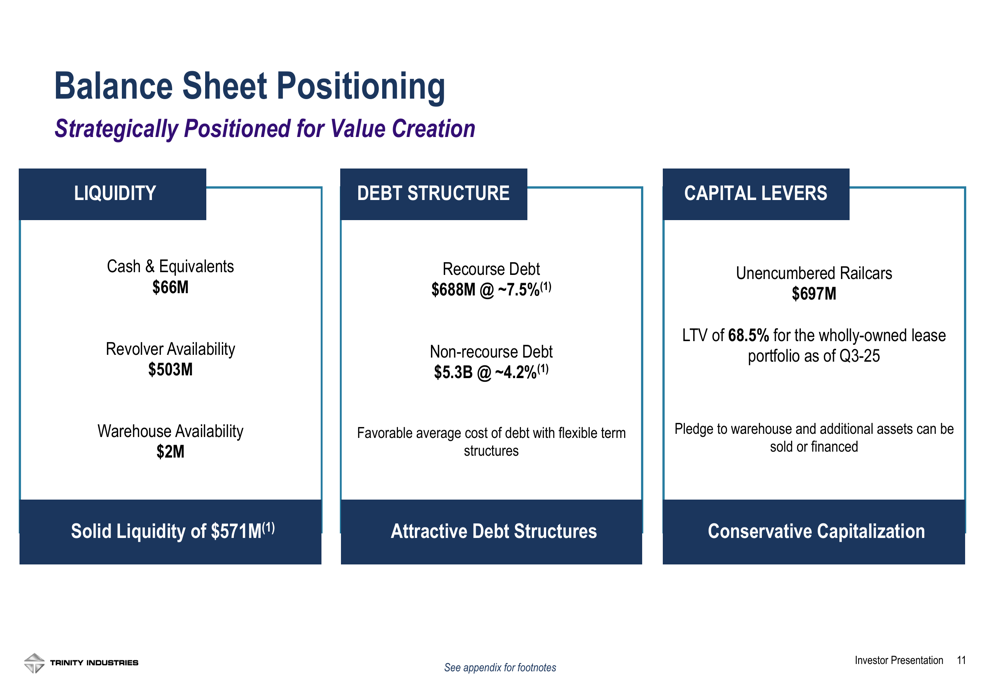
Trinity maintains a solid financial position with total liquidity of $571 million, including $66 million in cash and equivalents and $503 million in revolver availability. The company’s debt structure consists of $688 million in recourse debt at approximately 7.5% interest and $5.3 billion in non-recourse debt at approximately 4.2%.
The following slide details the company’s balance sheet positioning:
Year-to-date, Trinity has generated $187 million in cash flow from continuing operations and invested $387 million in fleet growth. The company returned $134 million to shareholders through dividends and share repurchases, maintaining its 246 consecutive quarterly dividend payments with a current yield of 4.3%.
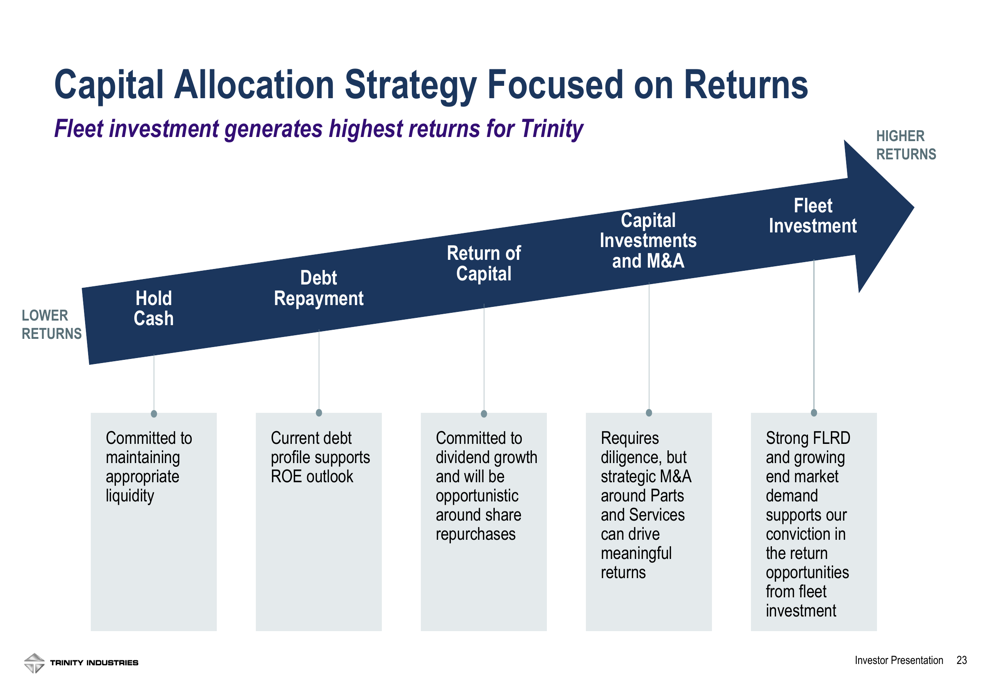
Trinity’s capital allocation strategy prioritizes fleet investment, which the company identifies as generating the highest returns:
Forward Guidance & Strategic Focus
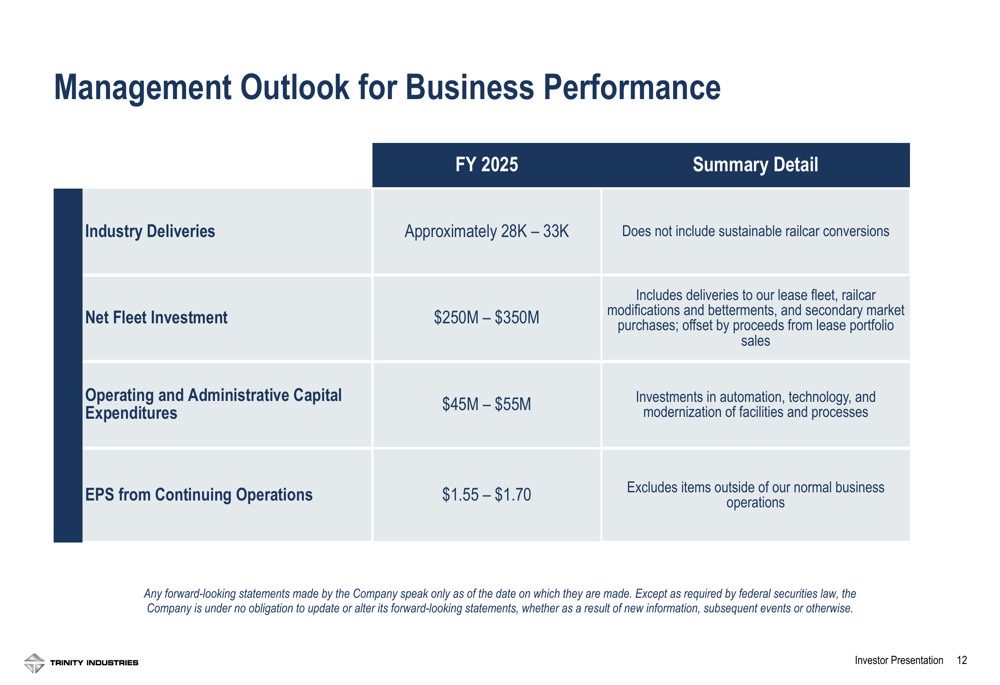
Looking ahead, Trinity forecasts industry deliveries of approximately 28,000-33,000 railcars for fiscal year 2025. The company projects net fleet investment of $250-350 million and operating and administrative capital expenditures of $45-55 million. The raised EPS guidance of $1.55-1.70 excludes items outside normal business operations.
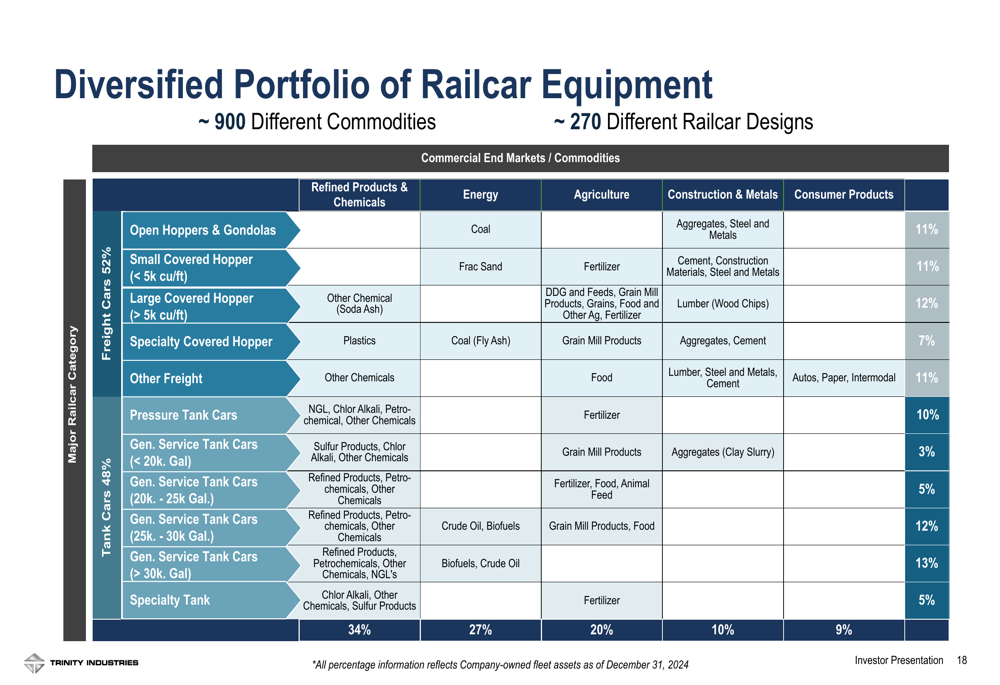
Trinity positions itself as a market leader in the North American rail transportation sector, ranking among the top five leasing companies with 112,850 railcars under ownership and an additional 33,645 investor-owned railcars under management. The company captured 41% of industry deliveries in FY 2024 and maintains a diversified portfolio serving approximately 900 different commodities across various commercial end markets.
The diversification of Trinity’s portfolio across multiple sectors provides resilience against industry-specific downturns:
Despite market uncertainty continuing to delay customer investment decisions in railcar orders, as noted in the earnings call, Trinity remains focused on its strategic initiatives of optimizing lease fleet returns and capitalizing on structural changes in the rail market. The company aims to achieve $750 million to $1 billion in net fleet investment between 2024 and 2026, indicating confidence in the long-term value proposition of its railcar assets despite near-term manufacturing challenges.
Full presentation:
This article was generated with the support of AI and reviewed by an editor. For more information see our T&C.