Gold prices steady ahead of Fed decision; weekly weakness noted

Introduction & Market Context
Trinseo SA (NYSE:TSE) presented its first quarter 2025 financial results on May 7, 2025, highlighting continued progress in its transformation strategy despite ongoing market challenges. The materials solutions provider reported its seventh consecutive quarter of year-over-year Adjusted EBITDA improvement, even as sales volumes declined across most segments.
The company’s stock closed at $4.33 on the day of the presentation, up 1.88% from the previous close, but fell 3.11% in after-market trading following the announcement of withdrawn full-year guidance due to increased tariff and geopolitical uncertainties.
Quarterly Performance Highlights
Trinseo reported a net loss of $79 million for Q1 2025, translating to earnings per share (EPS) of negative $2.22, which included $25 million of refinancing costs. Despite the loss, the company’s Adjusted EBITDA reached $65 million, representing a $20 million improvement compared to the same period last year.
The improved EBITDA performance was primarily driven by polycarbonate technology licensing income and benefits from previously announced restructuring actions, which more than offset lower equity income from Americas Styrenics and volume declines.
As shown in the company’s financial results summary:
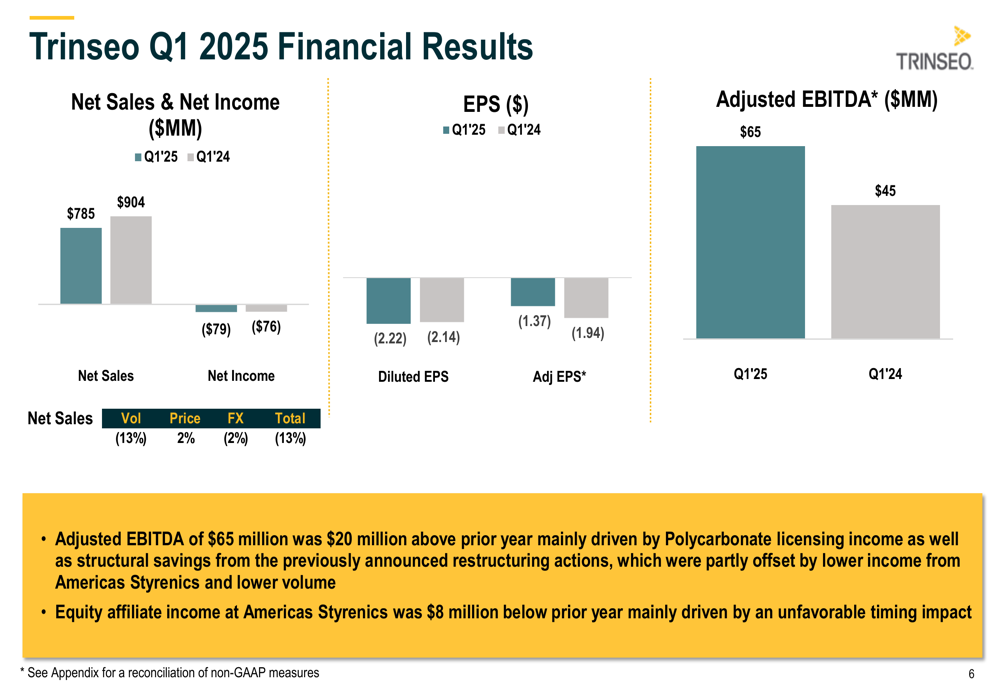
Net sales decreased from $904 million in Q1 2024 to $785 million in Q1 2025, while Adjusted EPS improved from negative $1.94 to negative $1.37. The company reported that equity affiliate income at Americas Styrenics was $8 million below the prior year, mainly due to an unfavorable timing impact.
Cash used in operations amounted to $110 million, with capital expenditures of $9 million resulting in Free Cash Flow of negative $119 million. This included seasonal working capital build and refinancing-related costs. The company ended the quarter with $128 million in cash (of which $2 million was restricted) and total liquidity of $421 million.
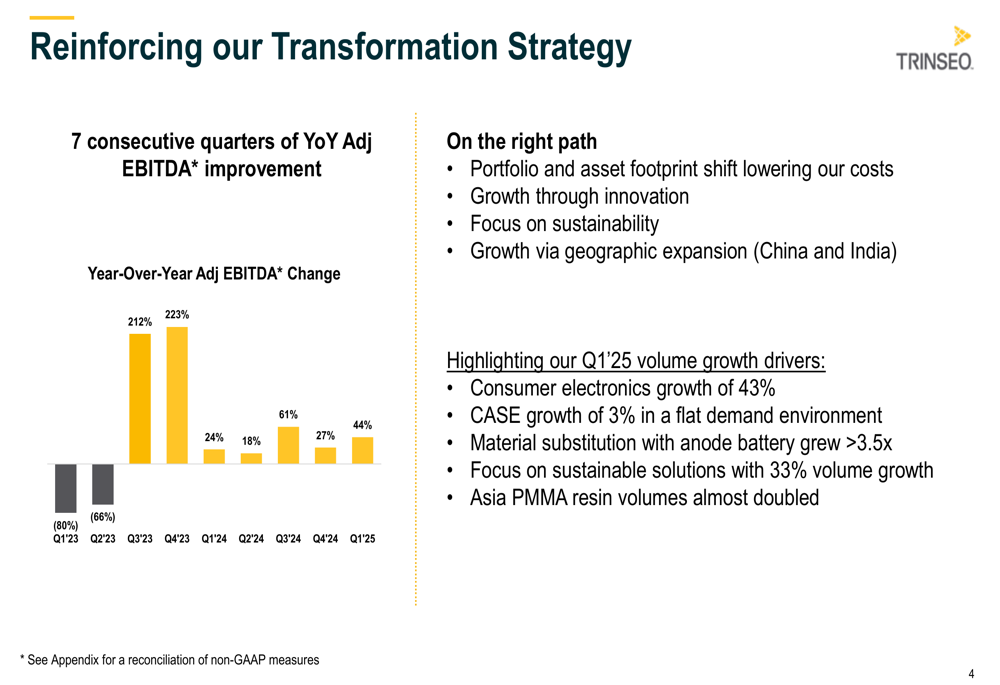
The company’s transformation strategy has been yielding positive results, as illustrated in this chart showing consecutive EBITDA improvements:
Segment Performance Analysis
Trinseo’s performance varied significantly across its three main business segments, with two showing EBITDA improvements despite volume declines.
The Engineered Materials segment saw net sales decrease slightly from $283 million to $278 million, while Adjusted EBITDA more than doubled from $10 million to $26 million. This improvement came despite volume declining from 78kt to 72kt, as shown in the following chart:
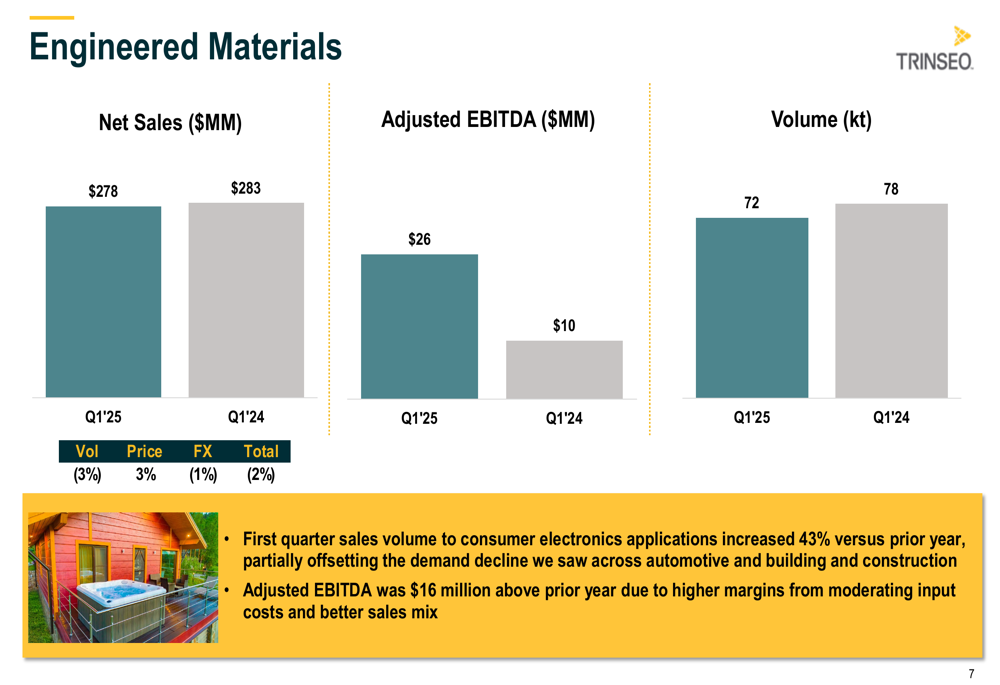
A key driver for this segment was the 43% increase in sales volume to consumer electronics applications compared to the prior year, which helped offset demand declines in automotive and building and construction markets. The $16 million EBITDA improvement was attributed to higher margins from moderating input costs and better sales mix.
The Latex Binders segment experienced more significant challenges, with net sales decreasing from $241 million to $209 million and Adjusted EBITDA slightly declining from $26 million to $24 million:
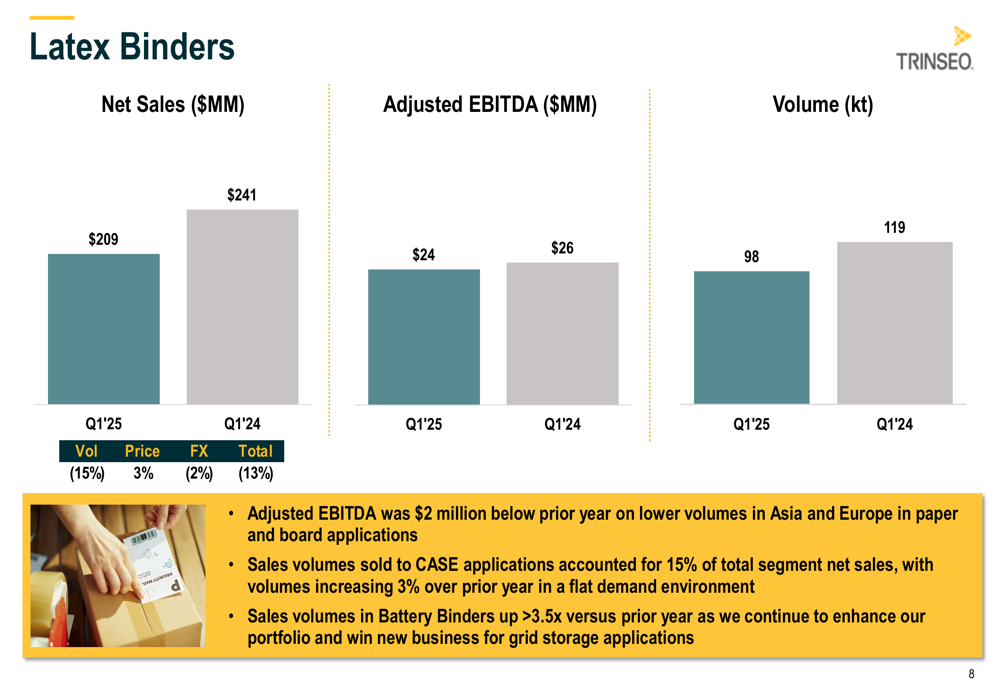
Volume in this segment fell from 119kt to 98kt, primarily due to lower volumes in Asia and Europe in paper and board applications. However, the company highlighted positive developments, including a 3% increase in volumes sold to CASE (Coatings, Adhesives, Sealants, and Elastomers) applications and a more than 3.5x increase in Battery Binders volumes as Trinseo continues to enhance its portfolio for grid storage applications.
The Polymer Solutions segment showed the most dramatic contrast between volume and profitability:
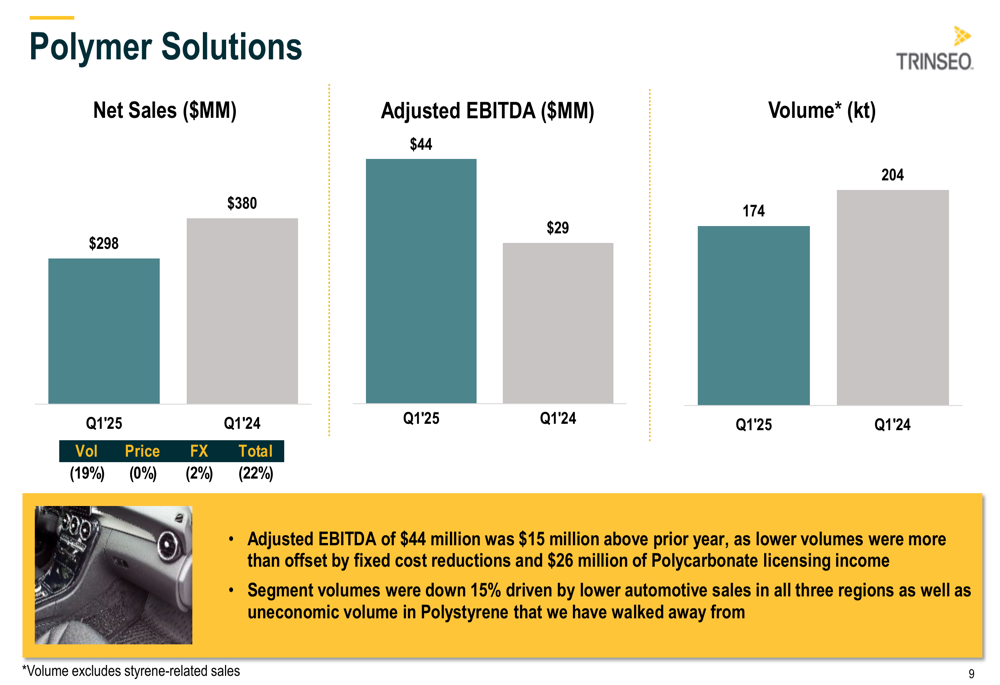
While net sales decreased from $380 million to $298 million and volume fell from 204kt to 174kt, Adjusted EBITDA increased from $29 million to $44 million. This $15 million improvement came despite lower volumes, as fixed cost reductions and $26 million of Polycarbonate licensing income more than offset the volume decline. The company noted that segment volumes were down 15% due to lower automotive sales in all three regions and the strategic decision to walk away from uneconomic volume in Polystyrene.
Strategic Initiatives
Trinseo’s transformation strategy continues to focus on shifting its portfolio and asset footprint to lower costs, driving growth through innovation, emphasizing sustainability, and expanding geographically, particularly in China and India.
The company highlighted several growth drivers in Q1 2025, including a 43% increase in consumer electronics, 3% growth in CASE applications despite a flat demand environment, and more than 3.5x growth in anode battery materials. Sustainable solutions saw 33% volume growth, while Asia PMMA resin volumes nearly doubled.
Regional sales analysis revealed varying market conditions:
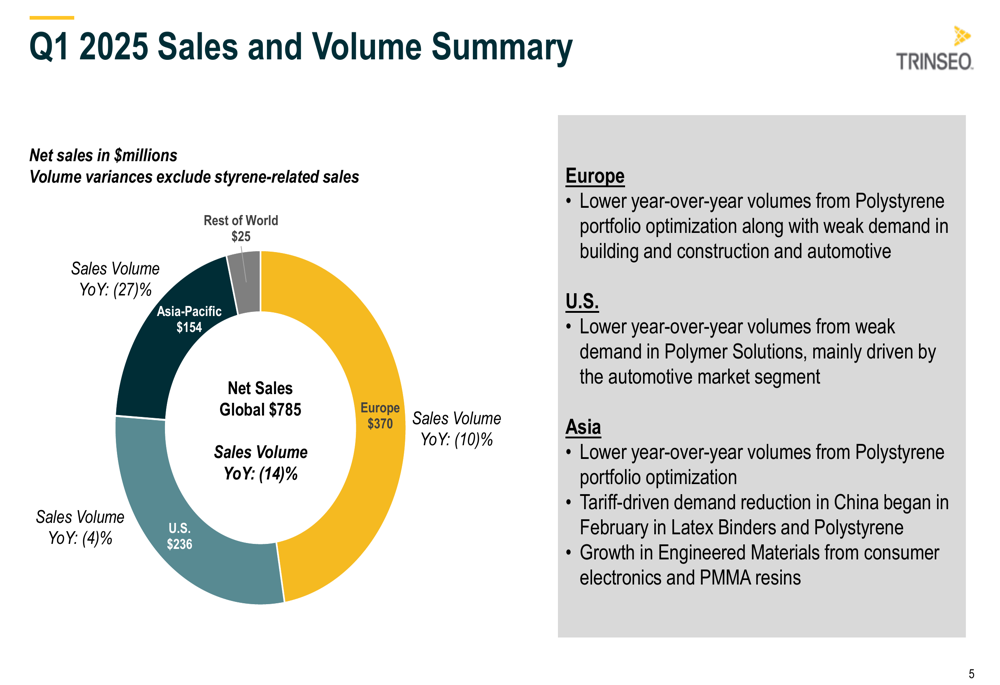
Europe experienced a 10% year-over-year volume decline, attributed to Polystyrene portfolio optimization and weak demand in building and construction and automotive sectors. The U.S. saw a more modest 4% volume decrease, primarily due to weak demand in Polymer Solutions, mainly in the automotive market segment. Asia-Pacific faced challenges from Polystyrene portfolio optimization and tariff-driven demand reduction in China, which began affecting Latex Binders and Polystyrene in February, though the region showed growth in Engineered Materials from consumer electronics and PMMA resins.
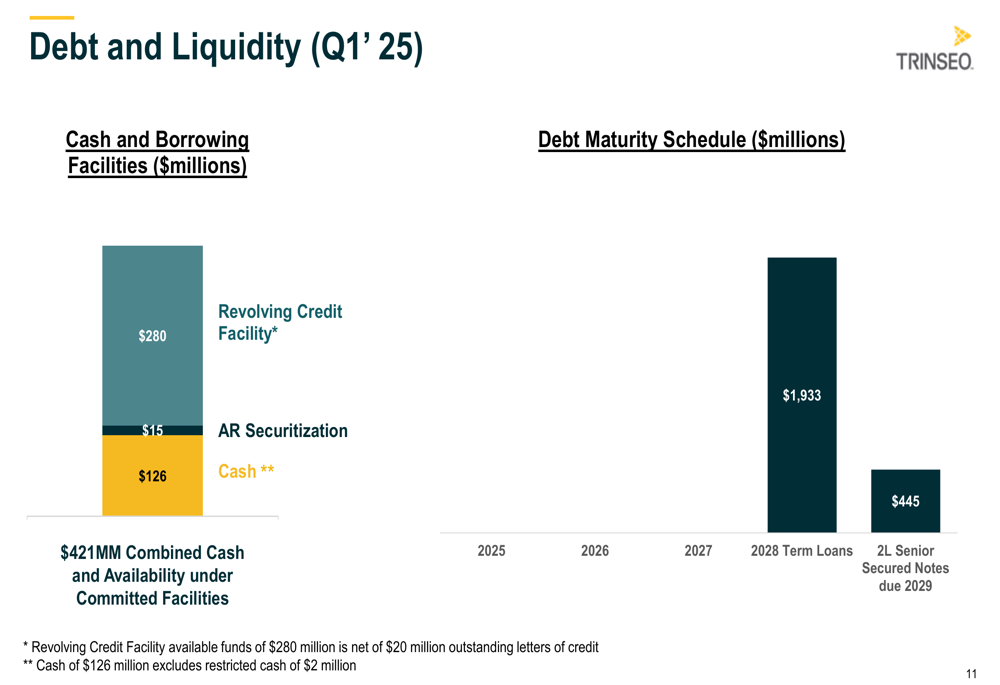
The company’s debt and liquidity position remains stable, with combined cash and availability of $421 million as of Q1 2025:
Forward-Looking Statements
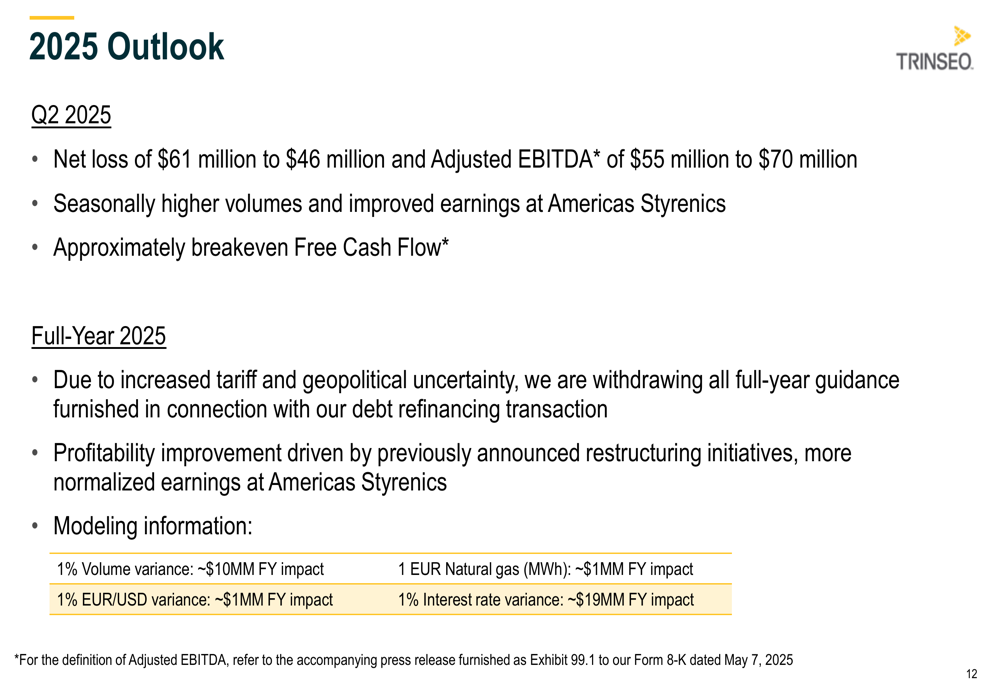
For the second quarter of 2025, Trinseo expects a net loss between $61 million and $46 million, with Adjusted EBITDA projected between $55 million and $70 million. The company anticipates seasonally higher volumes compared to Q1 and approximately breakeven Free Cash Flow.
Notably, Trinseo has withdrawn all full-year guidance for 2025 due to increased tariff and geopolitical uncertainty. The company continues to expect profitability improvement driven by previously announced restructuring initiatives.
For the full year 2025, Trinseo provided the following cash flow component estimates: capital expenditures of $65 million, cash interest of $195 million, cash taxes of $35 million, restructuring costs of $45 million, turnarounds of $10 million, and working capital/other of $20 million, resulting in total net cash expenditures of $370 million.
The company’s capital expenditures include approximately $40 million for maintenance, while restructuring costs cover the Stade virgin PC closure, corporate restructuring, and the remainder of styrene closures. These initiatives align with the transformation strategy mentioned in the company’s Q3 2024 earnings call, where management projected 2025 adjusted EBITDA to exceed $300 million, though this guidance has now been withdrawn.
As Trinseo navigates through market uncertainties, its focus remains on executing actions aligned with its transformation strategy, maintaining disciplined discretionary spending and working capital management, and ensuring restructuring initiatives stay on track to deliver the anticipated benefits.
Full presentation:
This article was generated with the support of AI and reviewed by an editor. For more information see our T&C.