Asia FX dithers as dollar steadies before Powell speech; yen muted after CPI data

Introduction & Market Context
Truist Financial Corp (NYSE:TFC) presented its second quarter 2025 earnings results on July 18, showing improved performance driven by loan growth and digital transformation progress. The bank reported earnings per share of $0.90 and net income available to common shareholders of $1.2 billion, continuing its recovery momentum from the previous quarter.
The stock responded positively to the results, trading up 1.09% to $45.50 in premarket activity following the announcement. This builds on Truist’s recent stock performance, which has shown significant improvement since the first quarter when it traded around $36.
Quarterly Performance Highlights
Truist delivered solid financial results across key metrics in the second quarter. Revenue reached $5.035 billion, while expenses were controlled at $2.986 billion, resulting in pre-provision net revenue of $2.049 billion. The bank maintained a healthy net interest margin of 3.02%, a slight improvement from 3.01% in the previous quarter.
As shown in the following performance summary:
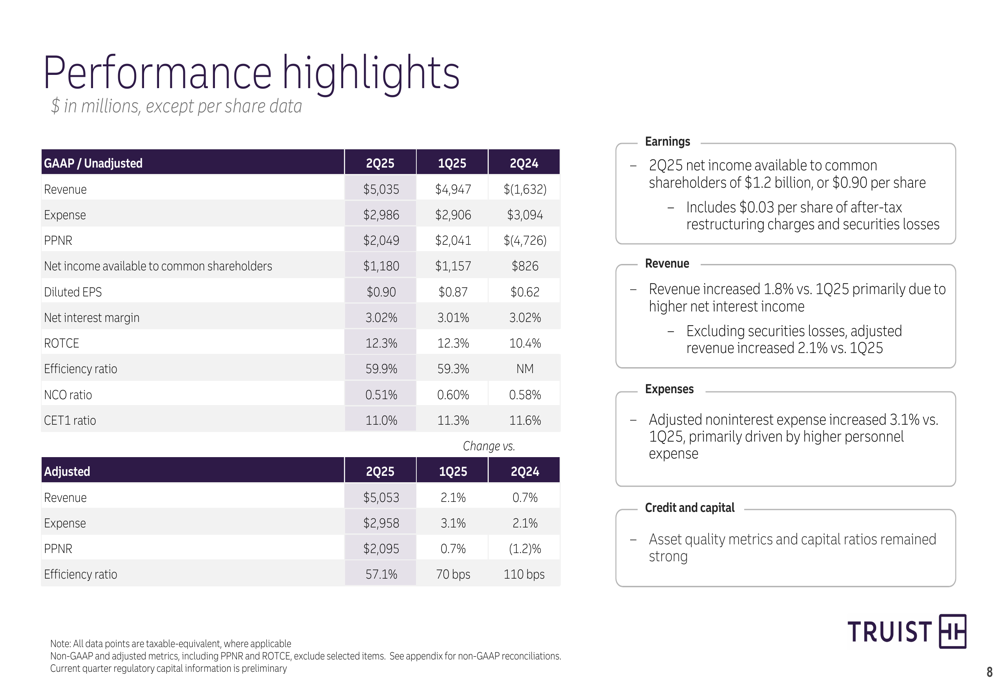
The bank’s efficiency ratio stood at 59.9%, while return on tangible common equity reached 12.3%. Asset quality remained strong with a net charge-off ratio of 0.51%, and the CET1 capital ratio was reported at 11.0%, providing a solid foundation for continued growth and capital returns.
Loan and Deposit Growth
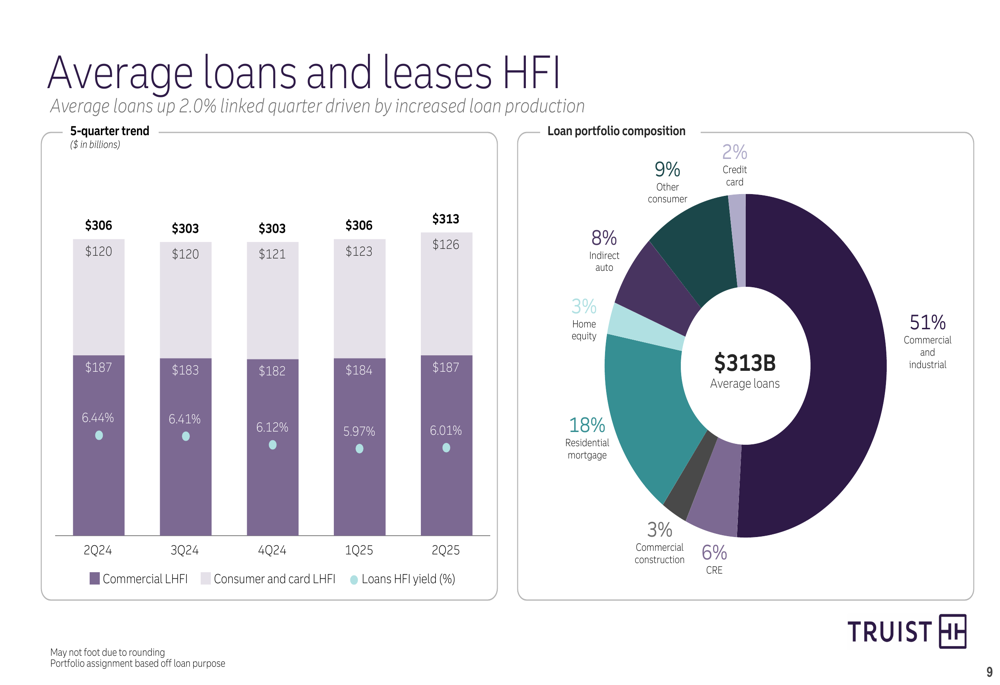
One of the quarter’s highlights was Truist’s strong loan growth, with average loans increasing 2.0% compared to the previous quarter. This growth was primarily driven by increased loan production in both commercial and consumer segments.
The bank’s loan portfolio composition shows a balanced approach with commercial and industrial loans representing 51% of the portfolio, followed by residential mortgages at 18%:
On the funding side, average deposits increased by 2.1% from the linked quarter. The deposit mix remains well-diversified with 27% in demand deposits, 34% in money market and savings accounts, 29% in interest checking, and 10% in time deposits:
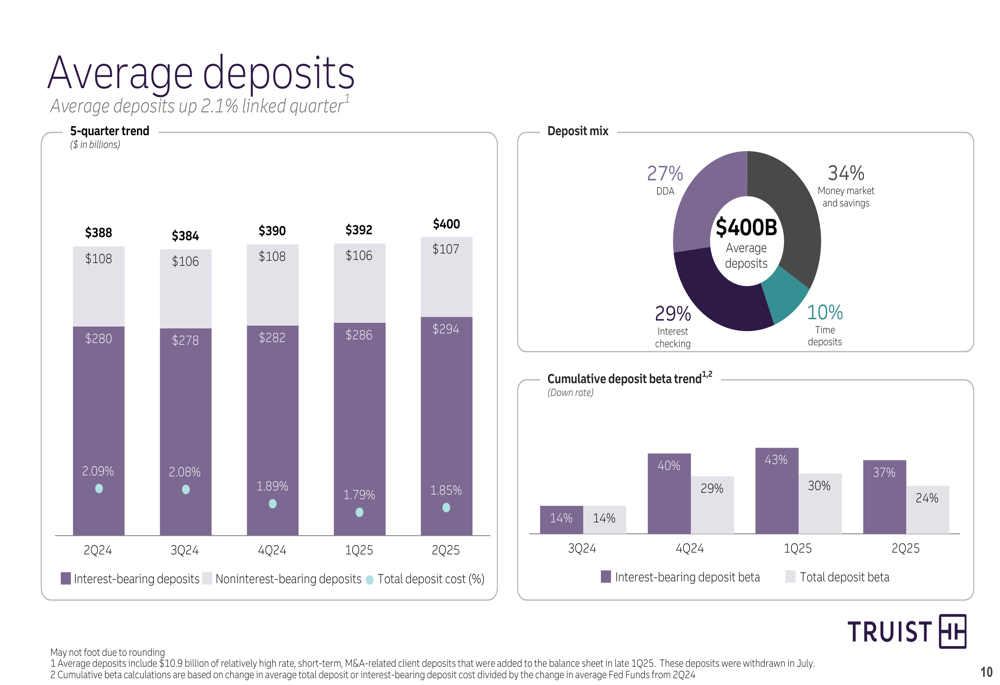
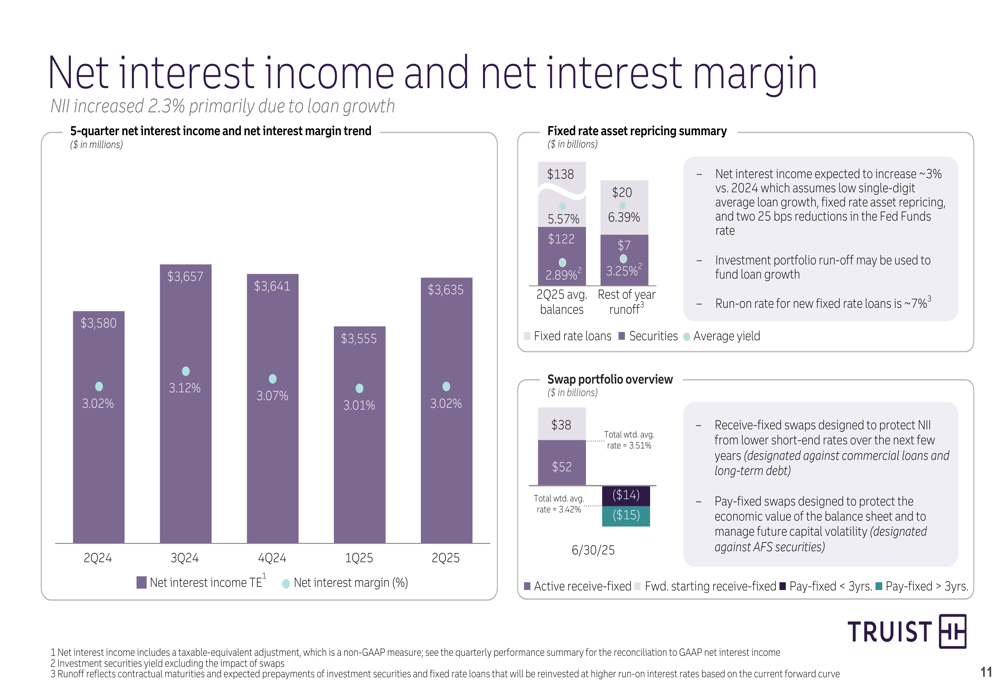
This deposit growth helped fuel the bank’s net interest income, which increased 2.3% primarily due to the loan growth. The net interest income trend shows steady improvement over recent quarters:
Digital Transformation Progress
Truist continues to make significant strides in its digital transformation strategy, with impressive growth in digital client acquisition and engagement metrics. Digital share of new-to-bank clients increased by 900 basis points, while mobile app users grew by 6%.
The bank’s digital initiatives are yielding tangible results, as illustrated in this summary of digital performance:

In the Consumer & Small Business Banking segment, Truist added approximately 37,000 new checking accounts in Q2 with an 82% primacy rate. The segment also generated about $13 billion in new loan production. Meanwhile, the Wholesale Banking segment saw end-of-period loans increase by $5.3 billion (2.9%) and doubled new client growth.
Capital Position and Return to Shareholders
Truist maintained a strong capital position with a CET1 ratio of 11.0%, enabling the company to return significant capital to shareholders. During the quarter, the bank repurchased $750 million of common stock and announced plans to repurchase an additional $500 million in the third quarter.
The following chart illustrates Truist’s capital position and recent actions:
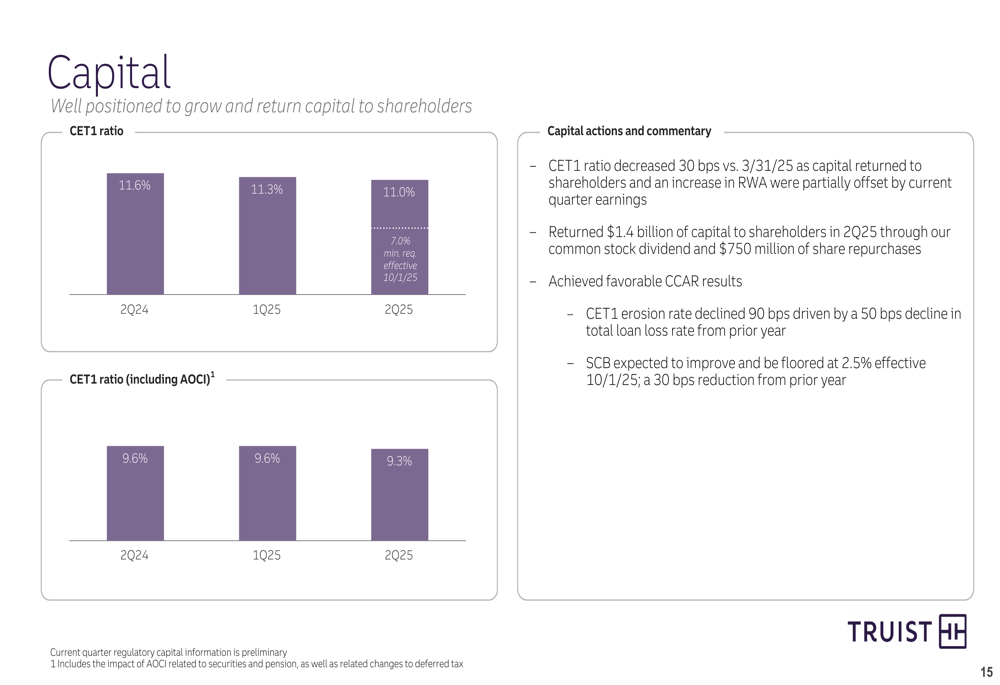
Management expressed confidence that the bank’s stress capital buffer (SCB) will decline to 2.5%, providing additional flexibility for capital deployment. This strong capital position supports Truist’s commitment to balancing growth investments with shareholder returns.
Forward-Looking Statements
Looking ahead, Truist maintained its full-year 2025 revenue and expense outlook while providing specific guidance for the third quarter. The bank expects adjusted revenue to increase by 2.5% to 3.5% in Q3 compared to Q2, with adjusted expenses projected to rise by approximately 1%.
The detailed outlook for the remainder of 2025 is presented in the following guidance:
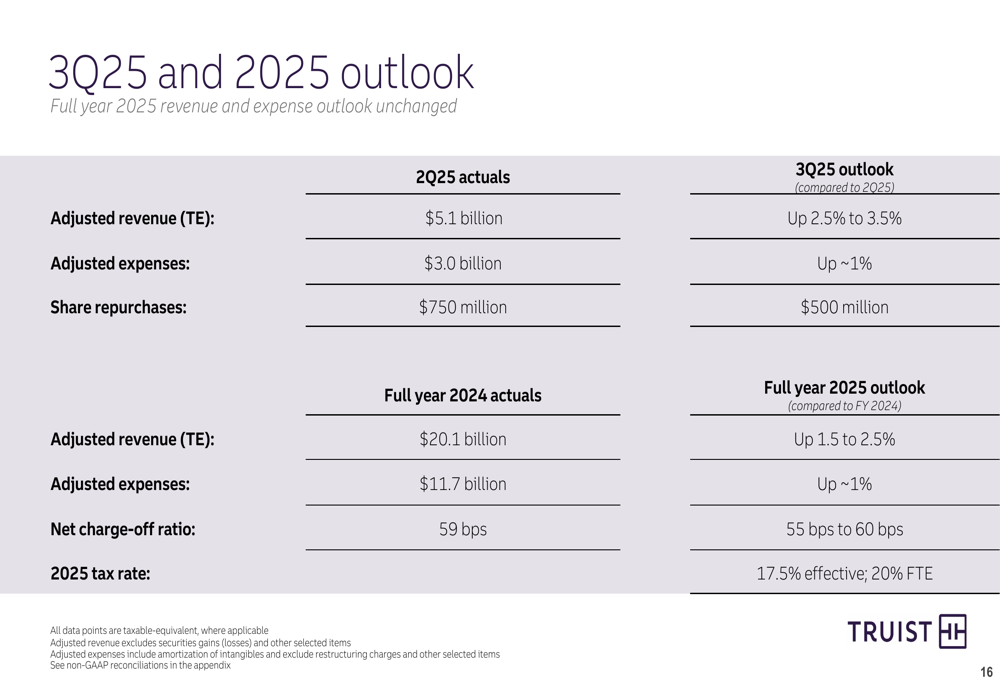
Management highlighted several strategic priorities for the remainder of 2025, including executing on growth initiatives, driving positive operating leverage, investing in talent and technology, maintaining credit discipline, and returning capital to shareholders.
Truist’s investment banking and trading businesses are positioned for recovery in the second half of 2025, which could provide additional revenue upside if market conditions remain favorable.
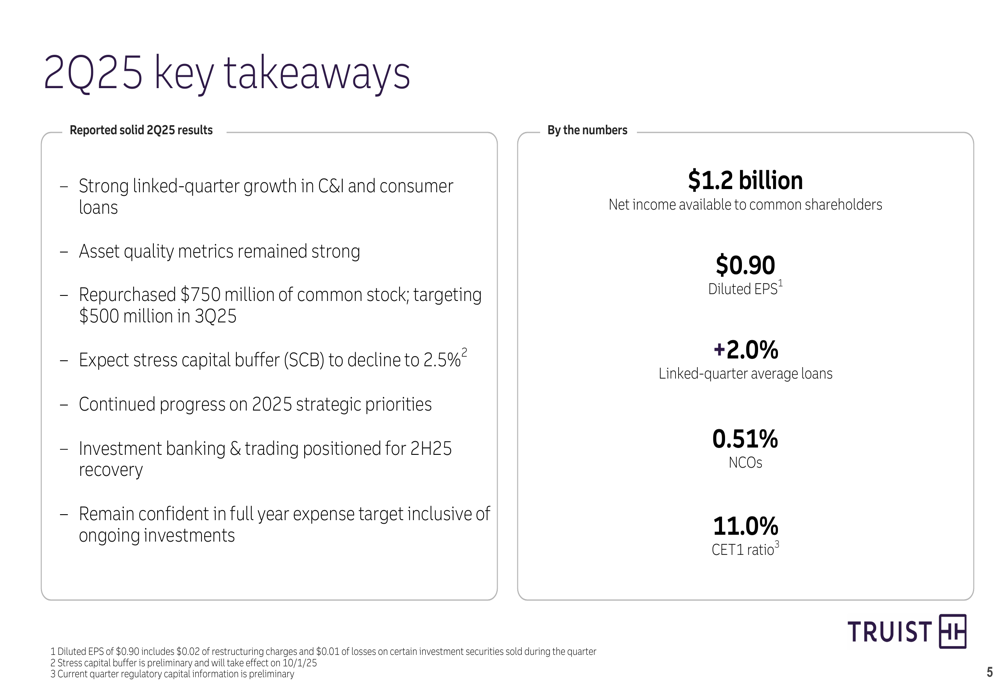
The company’s key takeaways emphasize its focus on strategic priorities while maintaining financial discipline:
With continued loan growth momentum, strong asset quality, and progress on digital transformation initiatives, Truist appears well-positioned to deliver on its full-year targets while navigating the evolving economic environment.
Full presentation:
This article was generated with the support of AI and reviewed by an editor. For more information see our T&C.