Street Calls of the Week

Introduction & Market Context
Trustmark Corporation (NASDAQ:TRMK) released its second quarter 2025 financial results presentation on July 22, 2025, revealing continued momentum in profitability and balance sheet growth. The regional bank reported earnings per share of $0.92, up from $0.88 in the first quarter and significantly higher than the $0.66 reported in the same quarter last year. In after-hours trading, Trustmark’s stock rose 1.25% to $39.00, building on the day’s 0.52% gain that closed the regular session at $38.52.
The financial services company, headquartered in Jackson, Mississippi, continues to benefit from its diversified business model across banking, wealth management, and mortgage services. The results demonstrate Trustmark’s ability to navigate the current interest rate environment while maintaining strong credit quality.
Quarterly Performance Highlights
Trustmark reported net income of $55.8 million for Q2 2025, representing a 4.1% increase from the $53.6 million reported in Q1 2025 and a substantial 37.8% jump from $40.5 million in Q2 2024. Total (EPA:TTEF) revenue reached $198.6 million, a 2.1% increase from the previous quarter.
As shown in the following comprehensive overview of Trustmark’s second quarter performance:
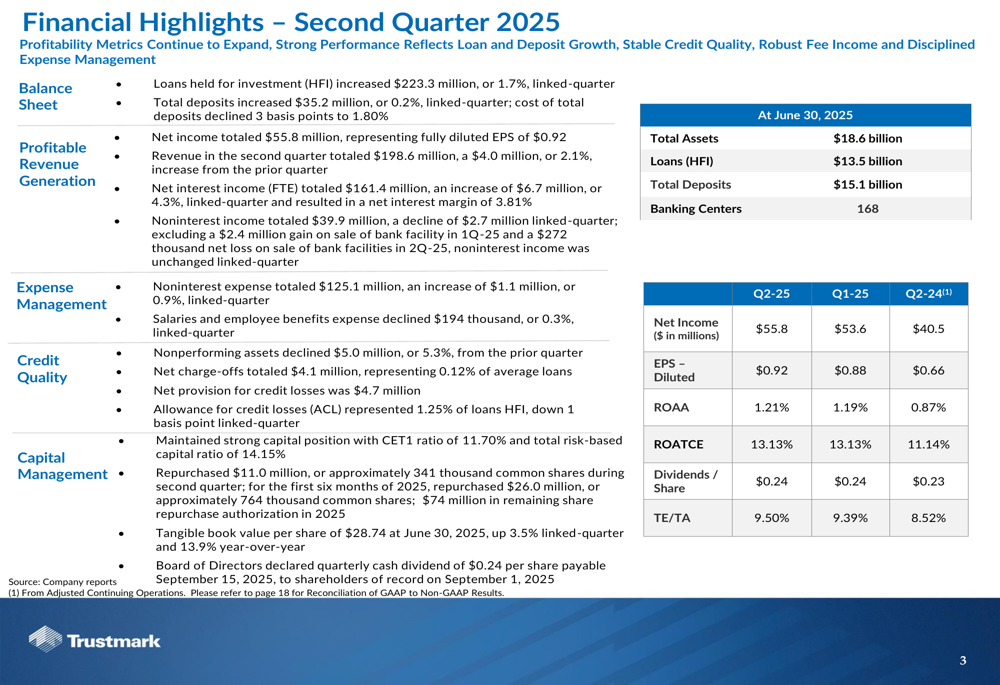
The bank’s profitability metrics continued to expand, driven by several key factors:
- Loans held for investment increased by $223.3 million (1.7%) from the previous quarter
- Total deposits grew by $35.2 million (0.2%) quarter-over-quarter
- Net interest income (FTE) totaled $161.4 million, up 4.3% from Q1
- The cost of total deposits declined by 3 basis points to 1.80%
- Return on average tangible common equity remained strong at 13.13%
Detailed Financial Analysis
Loan and Deposit Growth
Trustmark’s loan portfolio showed healthy growth and diversification across multiple sectors. The bank’s focus on profitable, credit-disciplined loan growth resulted in a $223.3 million increase in loans held for investment during the quarter, bringing the total to $13.5 billion.
The following chart illustrates the composition and growth of Trustmark’s loan portfolio:
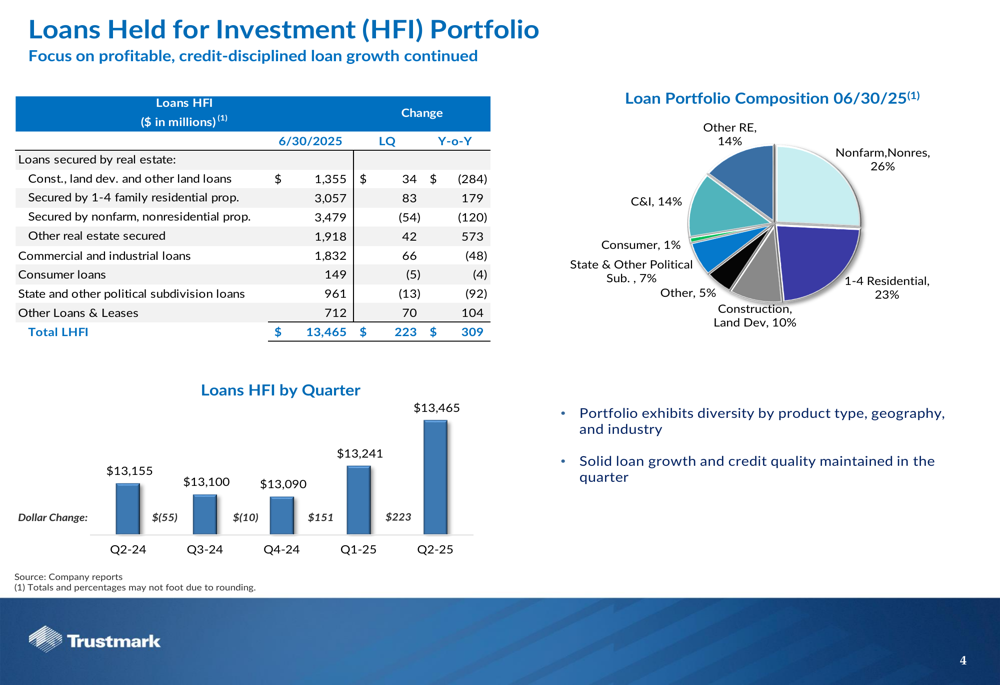
The loan portfolio remains well-diversified, with nonfarm nonresidential properties representing 26%, 1-4 family residential loans at 23%, and commercial and industrial loans at 14%. This diversification helps mitigate concentration risks while supporting growth.
On the funding side, Trustmark maintained an attractive, low-cost deposit base with total deposits of $15.1 billion as of June 30, 2025. The cost of deposits continued to decline, falling from 2.01% in Q1 to 1.83% in Q2, reflecting the bank’s strong deposit franchise and effective pricing strategies.
The following chart shows the deposit composition and cost trends:
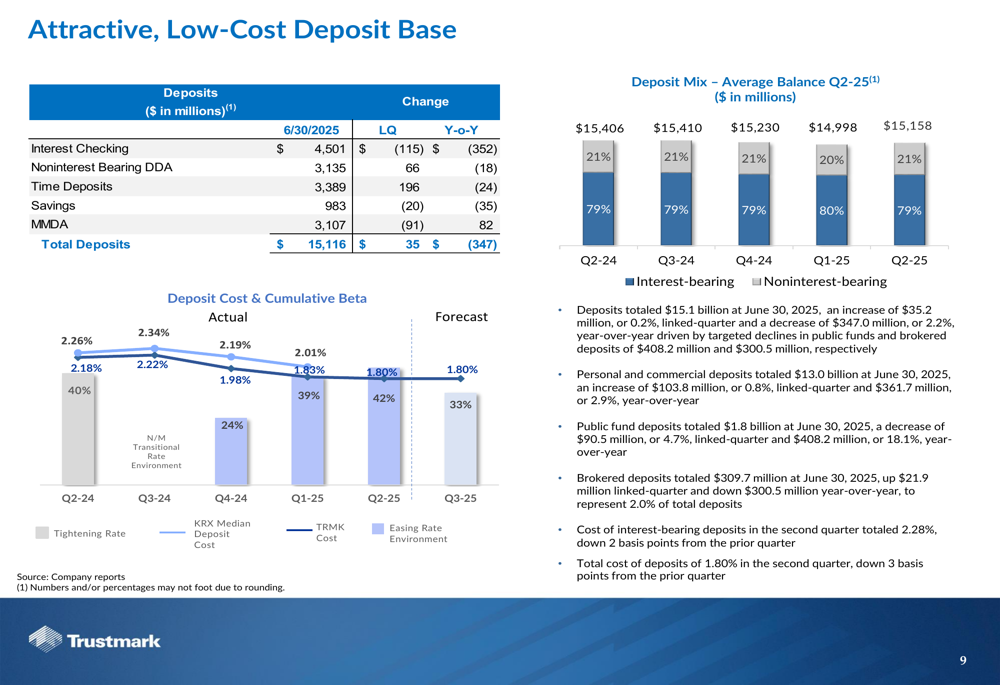
Personal and commercial deposits totaled $13.0 billion, increasing by $103.8 million (0.8%) from the previous quarter. The bank reduced its reliance on brokered deposits, which declined by $300.5 million year-over-year, though they increased slightly by $21.9 million from Q1 2025.
Net Interest Income and Margin
Trustmark’s net interest income (FTE) reached $161.4 million in Q2 2025, a $6.7 million (4.3%) increase from the previous quarter. The net interest margin improved to 3.81%, up 6 basis points from 3.75% in Q1 2025.
The following chart shows the trend in net interest income and margin:
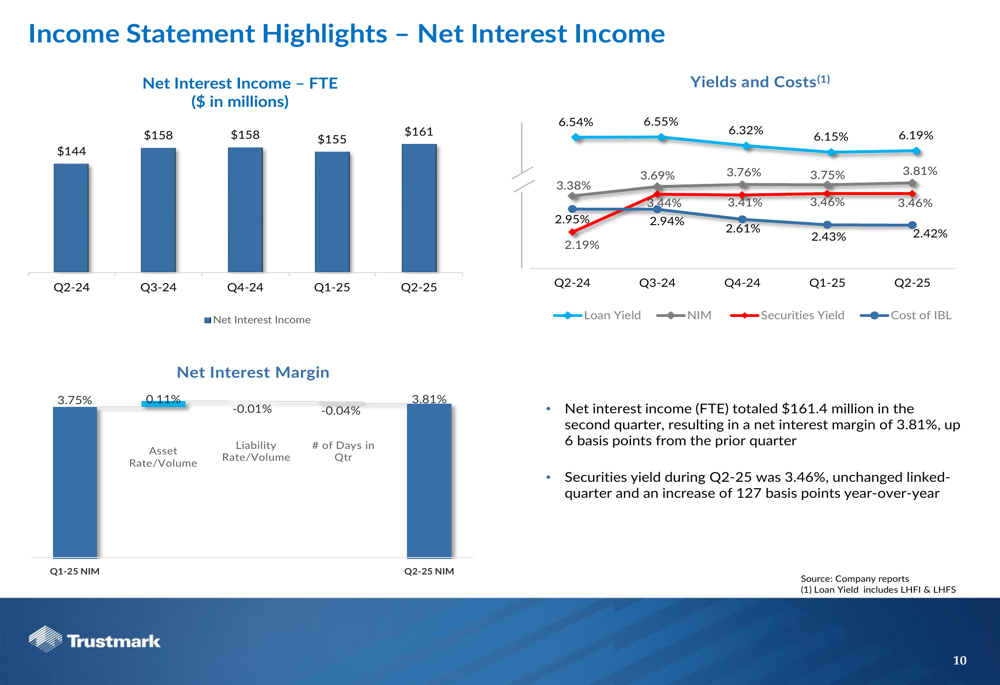
The improvement in net interest margin was primarily driven by higher loan yields, which increased to 3.81% from 3.75% in the previous quarter. The securities yield remained stable at 3.46% quarter-over-quarter but increased 127 basis points year-over-year.
Noninterest Income and Expense
Noninterest income totaled $39.9 million in Q2 2025, a decrease of $2.7 million from Q1 2025 but an increase of $1.7 million from Q2 2024. The decline from the previous quarter was primarily due to lower "other, net" income, which fell from $6.0 million to $2.3 million.
Mortgage banking revenue remained strong at $8.6 million, though slightly down from $8.8 million in the previous quarter. This represents a significant improvement from the $4.2 million reported in Q2 2024, reflecting the bank’s success in adapting to the evolving mortgage market.
Noninterest expense totaled $125.1 million, a modest increase of $1.1 million (0.9%) from the previous quarter and $6.8 million (5.7%) year-over-year. Salaries and employee benefits, the largest component of noninterest expense, actually decreased by $194 thousand from Q1 2025, demonstrating the bank’s commitment to expense discipline.
Credit Quality
Trustmark maintained strong credit quality metrics in Q2 2025, with nonperforming assets declining by $5.0 million (5.3%) from the previous quarter. The allowance for credit losses represented 1.25% of loans held for investment and 272.20% of nonaccrual loans (excluding individually evaluated loans).
The following chart illustrates the trends in nonperforming assets and allowance coverage:
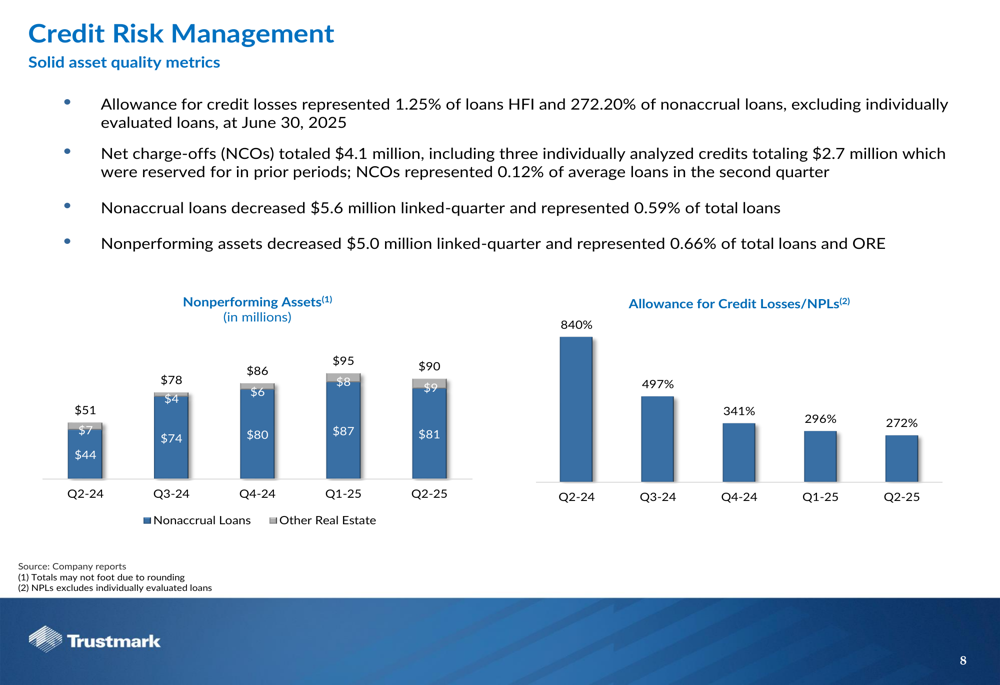
Net charge-offs totaled $4.1 million in Q2 2025, representing 0.12% of average loans. This included three individually analyzed credits totaling $2.7 million, which were reserved for in prior periods. The net provision for credit losses was $4.7 million for the quarter.
Capital Management and Shareholder Returns
Trustmark maintained a strong capital position with a Common Equity Tier 1 (CET1) ratio of 11.70% and a total risk-based capital ratio of 14.15% as of June 30, 2025. This robust capital base supports the bank’s growth initiatives while enabling continued shareholder returns.
The following chart shows Trustmark’s capital ratio trends:
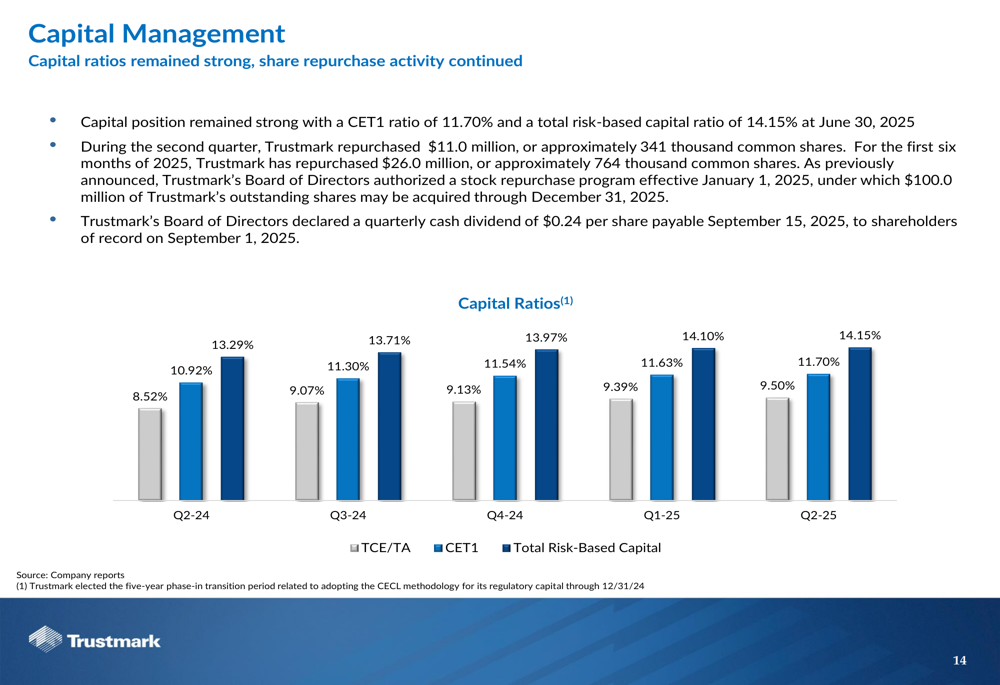
During Q2 2025, Trustmark repurchased $11.0 million of its common stock, representing approximately 341 thousand shares. For the first six months of 2025, the bank has repurchased a total of $26.0 million, or approximately 764 thousand shares.
The Board of Directors declared a quarterly cash dividend of $0.24 per share, payable on September 15, 2025, to shareholders of record on September 1, 2025. This continues Trustmark’s impressive track record of dividend payments.
Forward Guidance
Trustmark provided updated full-year expectations for 2025, maintaining or revising several key metrics:
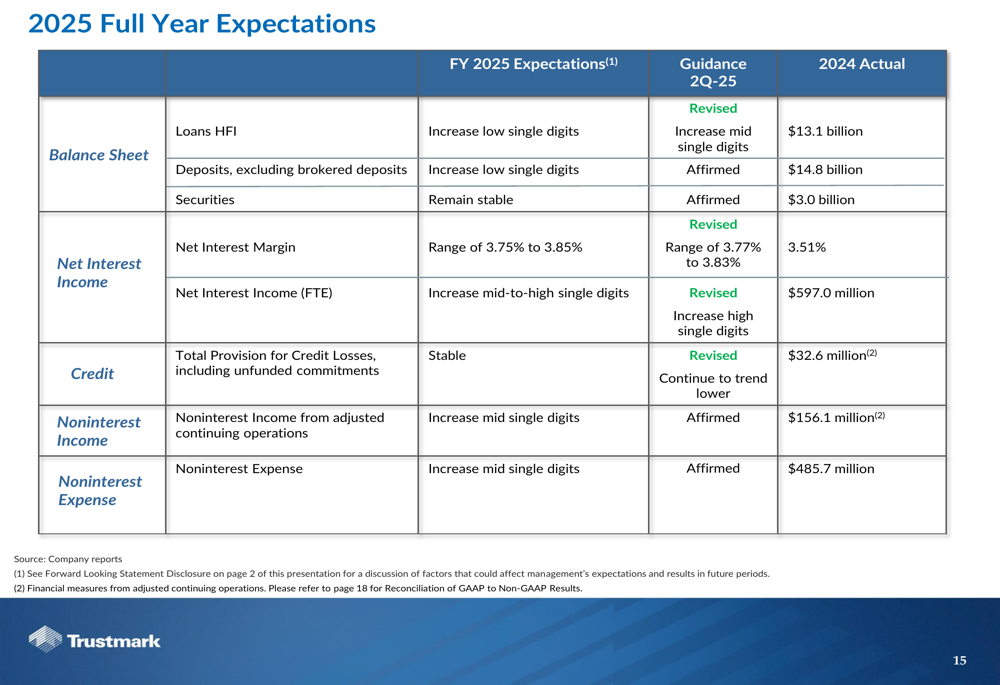
The bank now expects loans held for investment to increase in the mid-single digits, up from the previous guidance of low-single-digit growth. The net interest margin is projected to range between 3.77% and 3.83%, a narrower band than the previous 3.75% to 3.85% range.
Net interest income (FTE) is expected to increase in the mid-to-high single digits, while noninterest income and noninterest expense are both projected to grow in the mid-single digits. The provision for credit losses is expected to remain stable, reflecting confidence in the bank’s credit quality.
Conclusion
Trustmark’s Q2 2025 financial results demonstrate continued momentum in profitability, driven by loan growth, improving net interest margin, and disciplined expense management. The bank’s diversified business model, strong capital position, and focus on credit quality position it well for sustainable growth.
With EPS increasing to $0.92 from $0.88 in the previous quarter and $0.66 a year ago, Trustmark continues to deliver improving returns to shareholders while investing in strategic initiatives. The bank’s updated guidance suggests confidence in its ability to maintain this positive trajectory through the remainder of 2025.
Full presentation:
This article was generated with the support of AI and reviewed by an editor. For more information see our T&C.