Asia FX cautious amid US govt shutdown; yen tumbles after Takaichi’s LDP win

Introduction & Market Context
TTM Technologies (NASDAQ:TTMI) presented its Q2 2025 earnings results on July 30, 2025, revealing strong performance that exceeded guidance across key metrics. The company’s stock responded positively in aftermarket trading, rising 1.75% to $49.37, building on a 0.43% gain during regular trading hours. This performance continues TTM’s momentum from Q1, when the company also exceeded analyst expectations.
As the largest printed circuit board (PCB) manufacturer in North America, TTM Technologies has been capitalizing on strong demand in aerospace and defense markets while expanding its presence in high-growth sectors like data center computing and networking.
Quarterly Performance Highlights
TTM Technologies reported Q2 2025 revenue of $730.6 million, exceeding the high end of its guided range of $650-$690 million and representing a 21% year-over-year increase from $605.1 million in Q2 2024. The company achieved a non-GAAP earnings per share (EPS) of $0.58, above its guided range of $0.49-$0.55 and marking a quarterly record. This represents a 49% increase from the $0.39 reported in the same period last year.
As shown in the following comprehensive financial results:
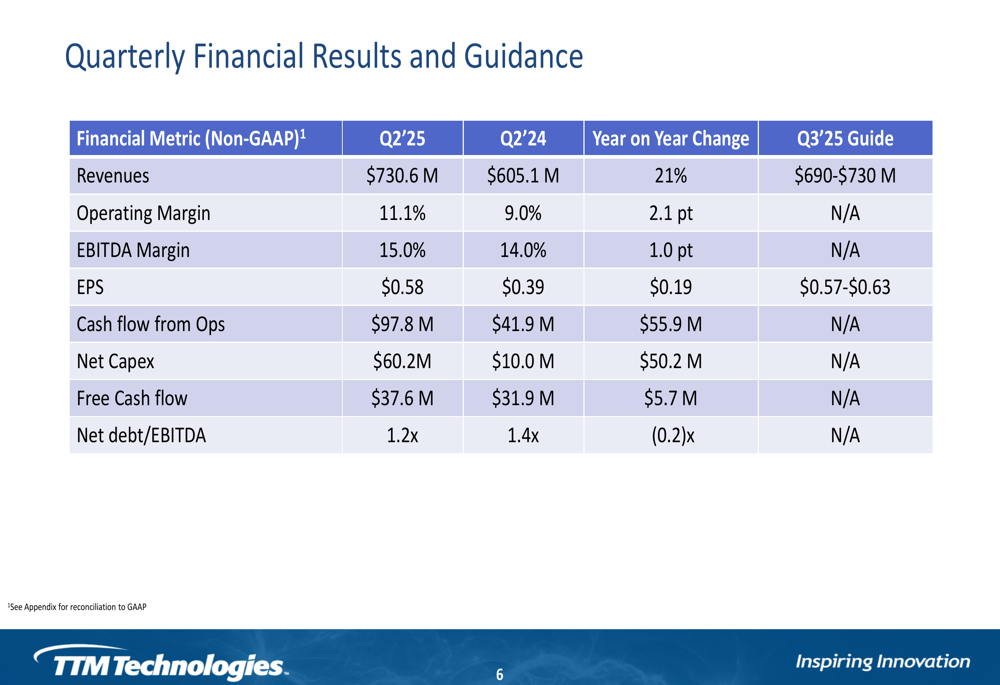
Operating margin improved significantly to 11.1%, up 2.1 percentage points from 9.0% in Q2 2024, while EBITDA margin increased to 15.0% from 14.0% year-over-year. The company generated $97.8 million in cash flow from operations, representing 13.4% of revenues and a substantial increase from $41.9 million in the prior year period.
End Market Analysis
TTM’s performance varied across its five end markets, with four segments showing strong growth and one experiencing a slight decline. The company’s diversified market approach has helped maintain overall growth momentum despite uneven performance across sectors.
The following breakdown illustrates TTM’s performance by end market:
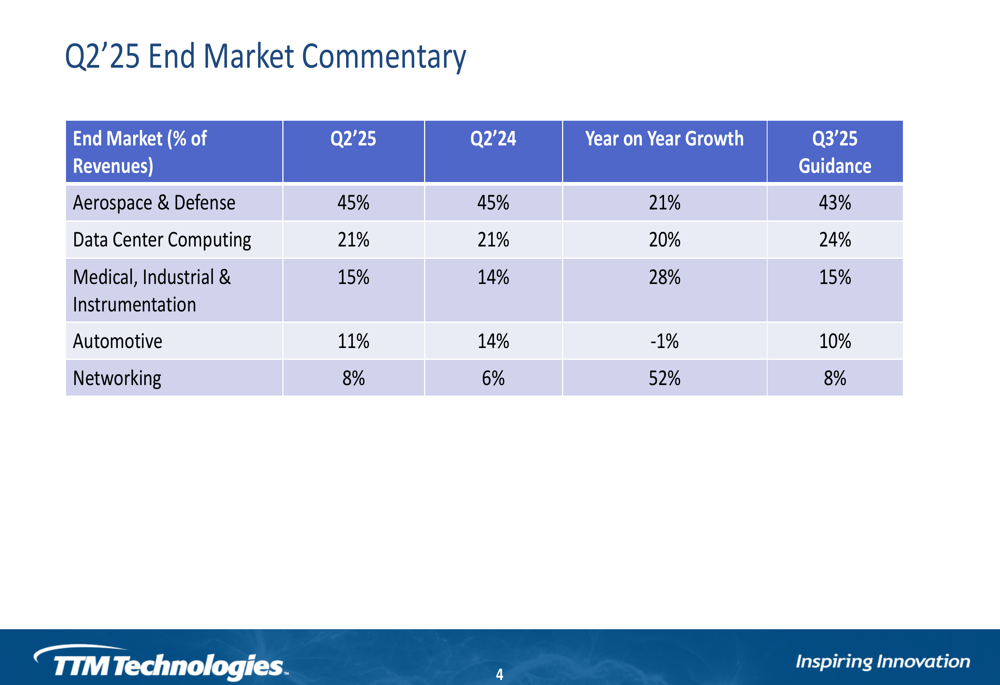
Aerospace & Defense remained TTM’s largest segment, accounting for 45% of revenue and growing 21% year-over-year. Data Center Computing contributed 21% of revenue with 20% growth, while Medical (TASE:BLWV), Industrial & Instrumentation represented 15% of revenue and showed the second-highest growth rate at 28%.
The Networking segment, while only 8% of total revenue, demonstrated the strongest growth at 52% year-over-year. In contrast, the Automotive segment was the only underperformer, representing 11% of revenue and declining 1% compared to the prior year.
Financial Position and Outlook
TTM Technologies maintained a solid financial position with a cash balance of $448.0 million at the end of Q2 2025. The company’s net leverage ratio, defined as net debt divided by the last twelve months of EBITDA, improved to 1.2x from 1.4x a year ago, indicating strengthened balance sheet health.
The company’s key operational metrics reveal both strengths and potential challenges:
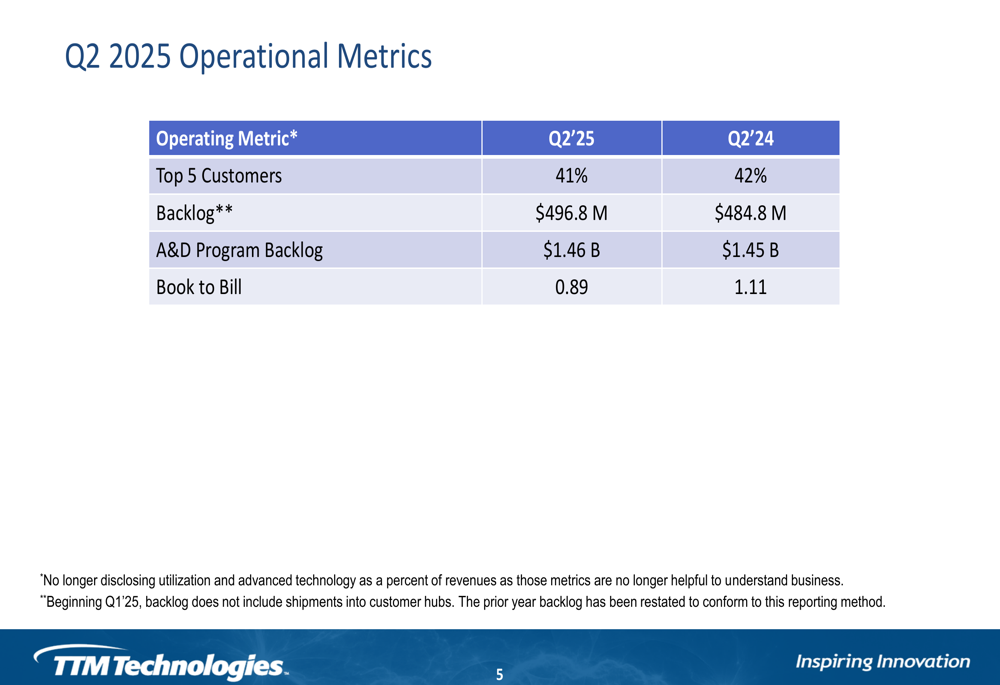
While TTM maintained a healthy backlog of $496.8 million and an Aerospace & Defense program backlog of $1.46 billion, the book-to-bill ratio declined to 0.89 from 1.11 in the prior year period. This sub-1.0 ratio could signal potential moderation in future growth, though the company’s guidance remains optimistic.
Capital expenditures increased significantly to $60.2 million from $10.0 million in Q2 2024, reflecting continued investment in growth initiatives. Despite this higher spending, free cash flow improved to $37.6 million from $31.9 million in the prior year period.
Forward Guidance
Looking ahead to Q3 2025, TTM Technologies provided guidance that suggests continued strong performance. The company expects revenues between $690 million and $730 million, with non-GAAP EPS projected between $0.57 and $0.63.
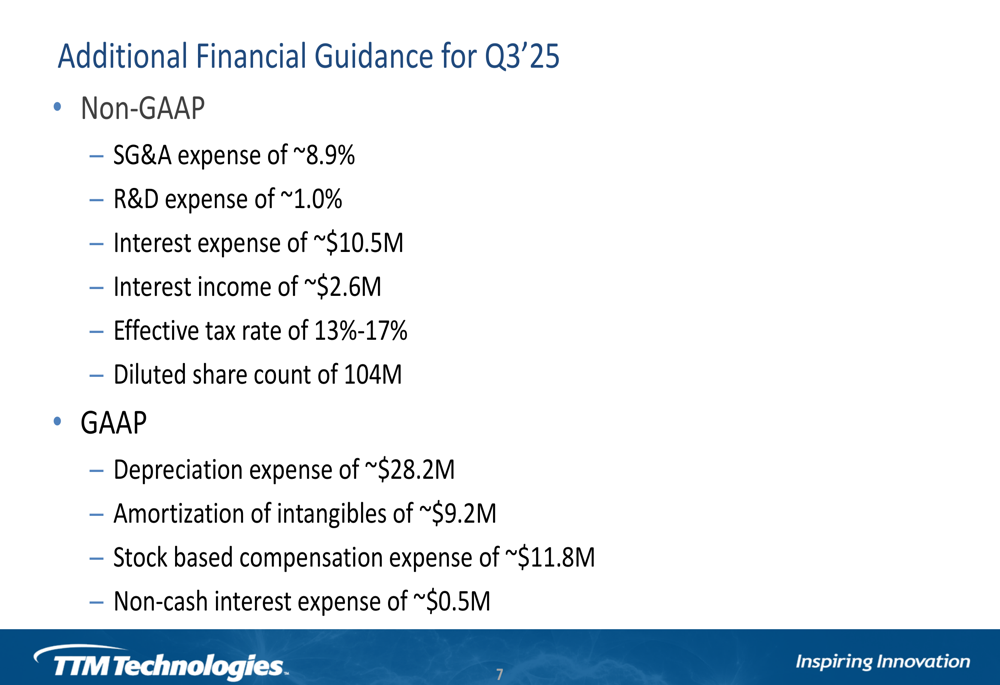
The detailed financial guidance for the upcoming quarter is outlined below:
By end market, TTM expects Aerospace & Defense to represent 43% of revenue in Q3, with Data Center Computing increasing to 24%. Medical, Industrial & Instrumentation is projected to maintain its 15% share, while Automotive is expected to decline slightly to 10%. The Networking segment is anticipated to hold steady at 8% of total revenue.
The company’s overall financial outlook reflects confidence in continued execution across its diversified business segments, with particular strength expected in the Data Center Computing market heading into the second half of 2025.
Strategic Initiatives
TTM Technologies continues to benefit from its position as North America’s largest PCB manufacturer, with a manufacturing footprint that includes facilities in China and Malaysia. Based on information from the previous quarter, the company’s new facilities in Malaysia and New York are progressing toward operational targets, with the Penang facility expected to reach breakeven by the end of Q3 2025.
The company’s focus on advanced technology and engineered products remains a key driver of its growth strategy, particularly in serving aerospace, defense, and high-performance computing markets. With a strong cash position and improved leverage ratio, TTM is well-positioned to continue investing in strategic initiatives while maintaining financial flexibility.
Full presentation:
This article was generated with the support of AI and reviewed by an editor. For more information see our T&C.