Moody’s downgrades Senegal to Caa1 amid rising debt concerns
Introduction & Market Context
Uber Technologies Inc (NYSE:UBER) released its Q1 2025 earnings presentation on May 7, 2025, revealing solid financial performance with revenue reaching $11.5 billion, up 14% year-over-year (17% in constant currency). Despite the positive results, Uber’s stock faced pressure in premarket trading, down 7.28% at $79.58, suggesting investors may be concerned about decelerating growth rates compared to previous quarters.
The company reported significant improvements in profitability, with Adjusted EBITDA growing 35% year-over-year to $1.87 billion and net income swinging to a positive $1.78 billion compared to a loss of $654 million in the same period last year. Gross bookings reached $42.8 billion, representing an 18% increase in constant currency.
Quarterly Performance Highlights
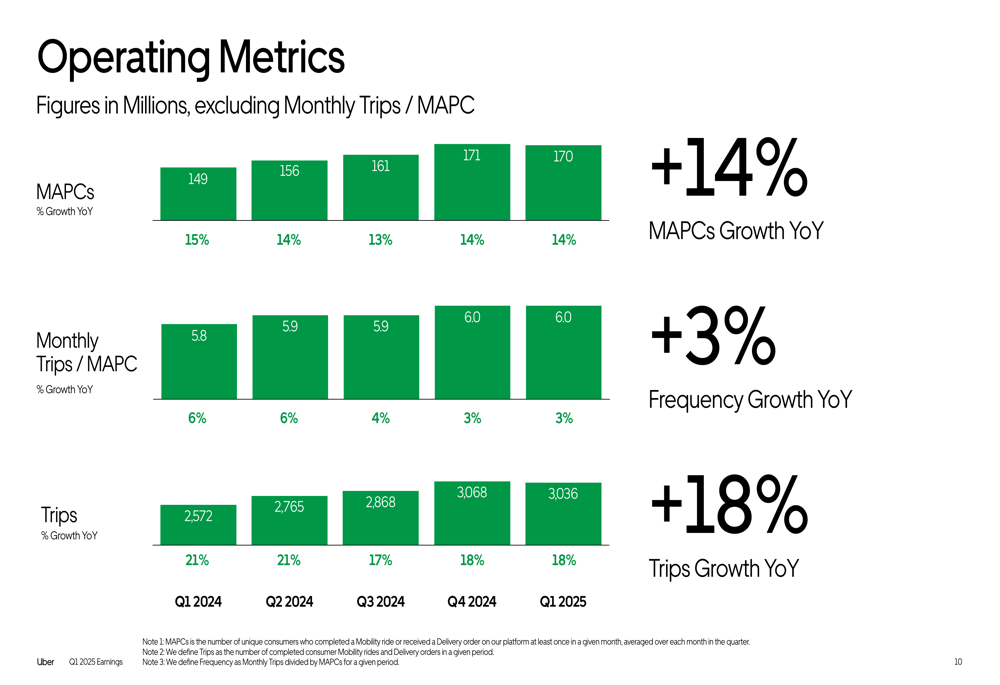
Uber’s Q1 2025 results demonstrated continued growth across key operational metrics. Monthly Active Platform Consumers (MAPCs) increased 14% year-over-year to 170 million, while total trips grew 18% to 3.04 billion. The company also reported a modest 3% increase in monthly trips per MAPC, indicating slightly higher user engagement.
As shown in the following chart of Uber’s operating metrics growth:
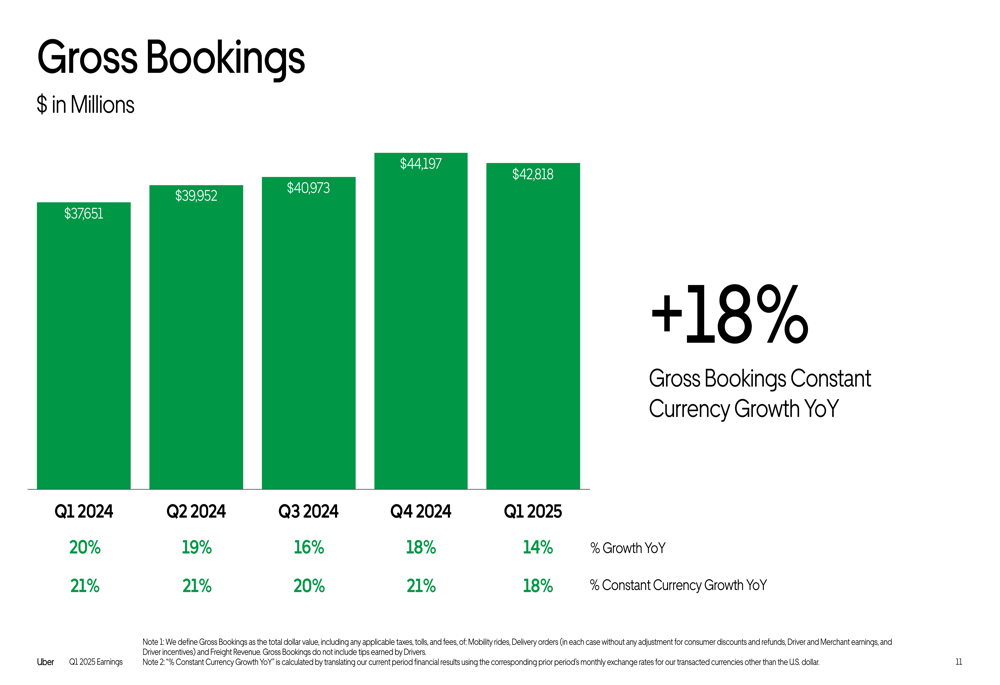
Gross bookings, a key indicator of Uber’s overall business volume, continued its upward trajectory with an 18% year-over-year increase in constant currency to $42.8 billion. This represents a slight deceleration from the 21% constant currency growth reported in Q4 2024.
The following chart illustrates Uber’s gross bookings performance over the past five quarters:
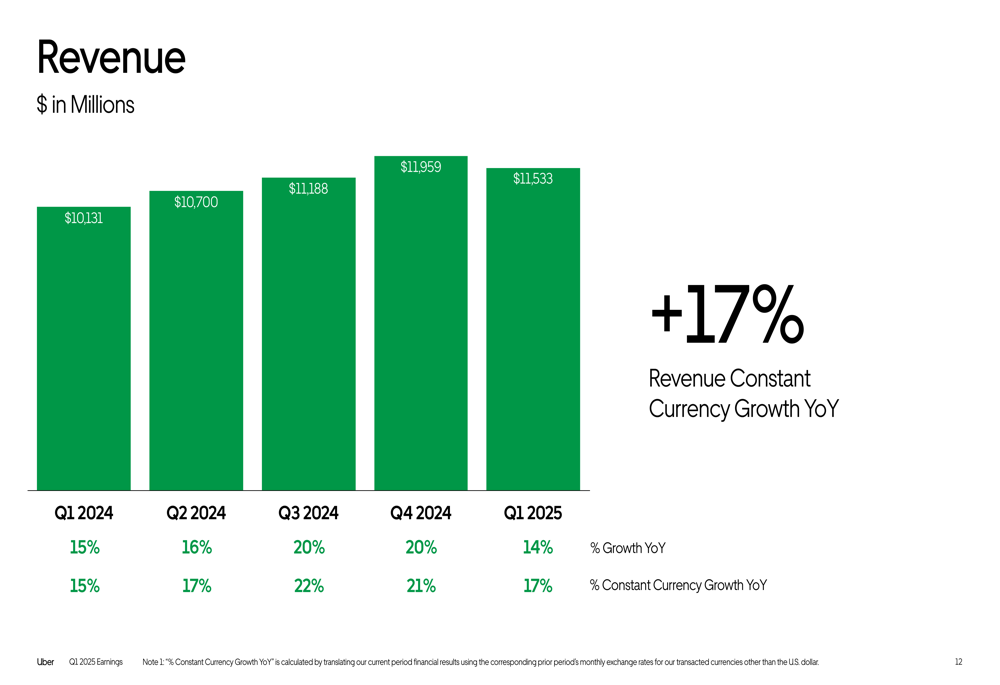
Revenue growth followed a similar pattern, reaching $11.5 billion in Q1 2025, up 17% year-over-year in constant currency. This represents a slight moderation from the 21% constant currency growth reported in the previous quarter.
The revenue progression over the past five quarters is shown in this chart:
Detailed Financial Analysis
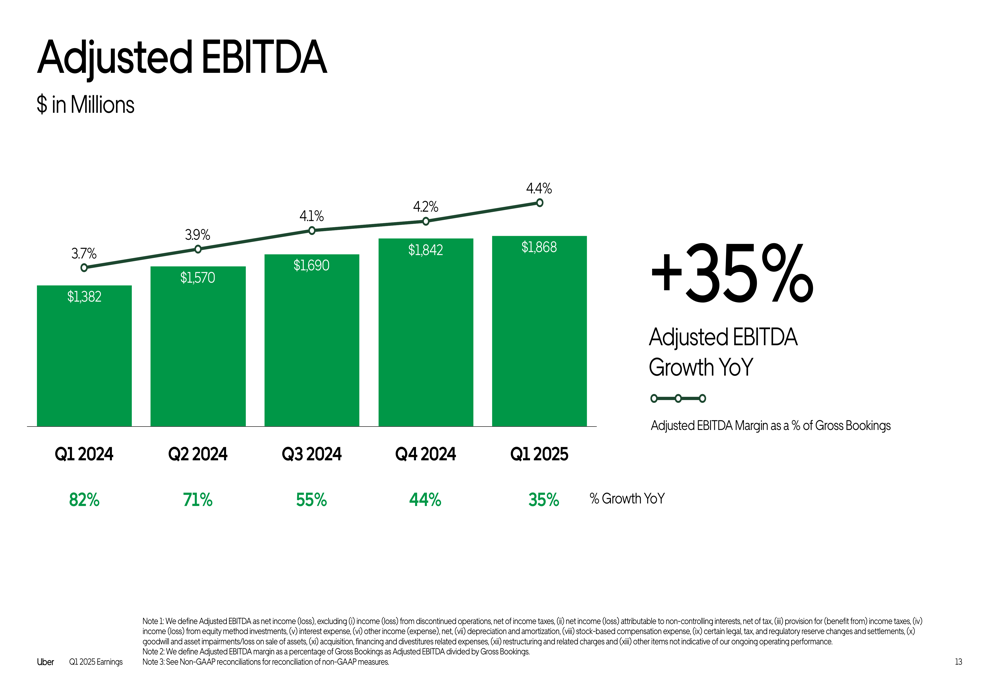
Uber’s profitability metrics showed substantial improvement in Q1 2025. Adjusted EBITDA increased 35% year-over-year to $1.87 billion, representing 4.4% of gross bookings, up from 3.7% in Q1 2024. This marks the company’s continued focus on operational efficiency and margin expansion.
The following chart demonstrates Uber’s Adjusted EBITDA growth and margin improvement:
The company’s balance sheet remains solid with total assets of $52.8 billion as of March 31, 2025, compared to $51.2 billion at the end of 2024. Cash and cash equivalents stood at $8.6 billion, providing Uber with significant financial flexibility for strategic investments and capital returns.
Free cash flow reached $2.25 billion for Q1 2025, with trailing twelve months free cash flow of $7.79 billion, representing an impressive 112% conversion rate of Adjusted EBITDA. This strong cash generation supports Uber’s ability to invest in growth initiatives while returning capital to shareholders.
Segment Analysis
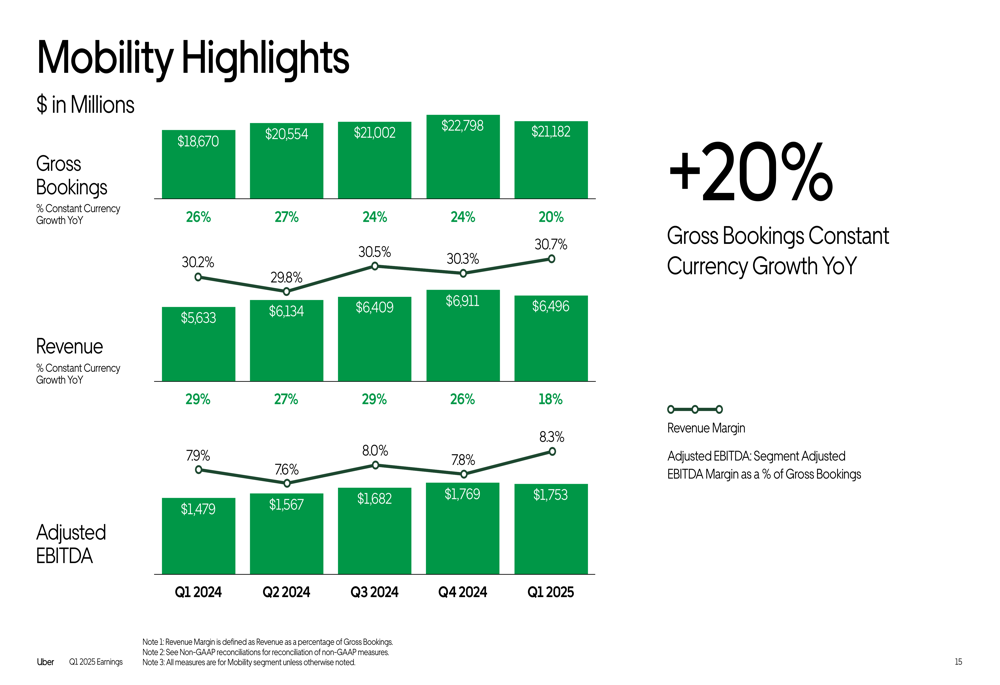
Uber’s Mobility segment continued to lead in terms of profitability, generating $1.75 billion in Adjusted EBITDA on gross bookings of $21.2 billion, which grew 20% year-over-year in constant currency. Revenue for the segment reached $6.5 billion, up 18% in constant currency.
The following chart details the Mobility segment’s performance:
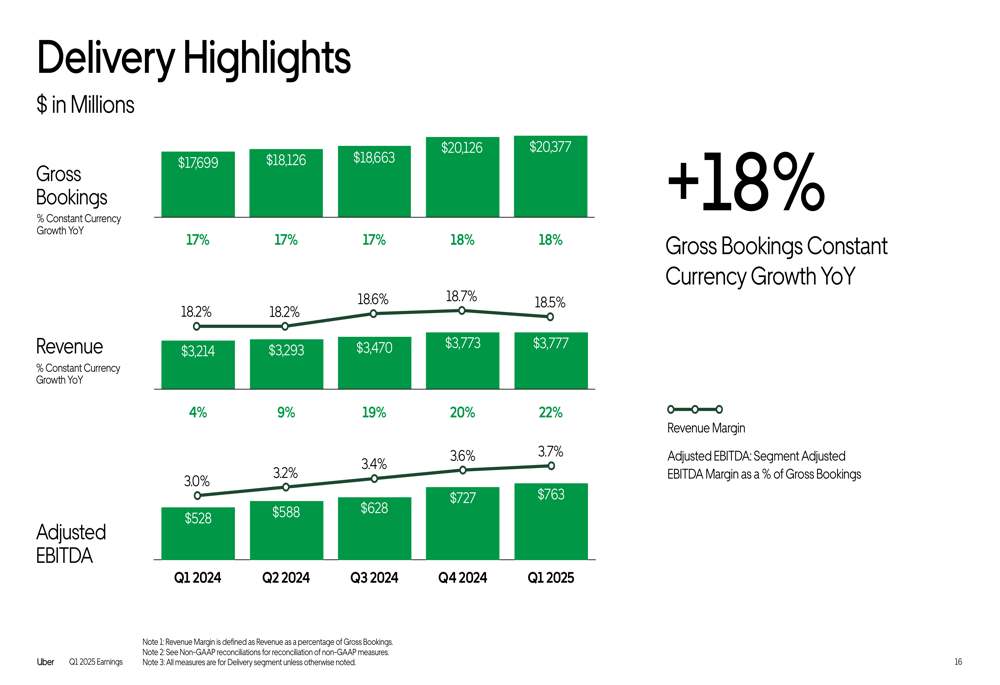
The Delivery segment showed robust growth with gross bookings of $20.4 billion, up 18% year-over-year in constant currency. Revenue grew even faster at 22% in constant currency to $3.8 billion, while Adjusted EBITDA increased to $727 million, representing a margin of 3.7%.
As illustrated in the Delivery segment highlights:
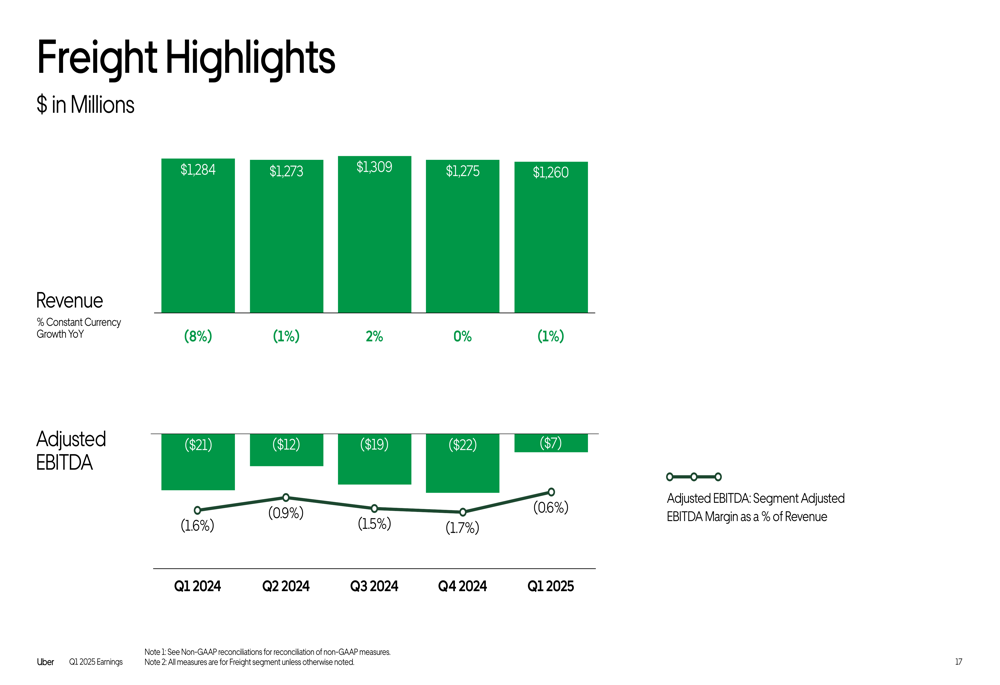
The Freight segment continued to face challenges with revenue slightly declining by 1% year-over-year to $1.26 billion. However, the segment showed improved profitability with Adjusted EBITDA loss narrowing to $7 million from $21 million in Q1 2024.
Strategic Initiatives
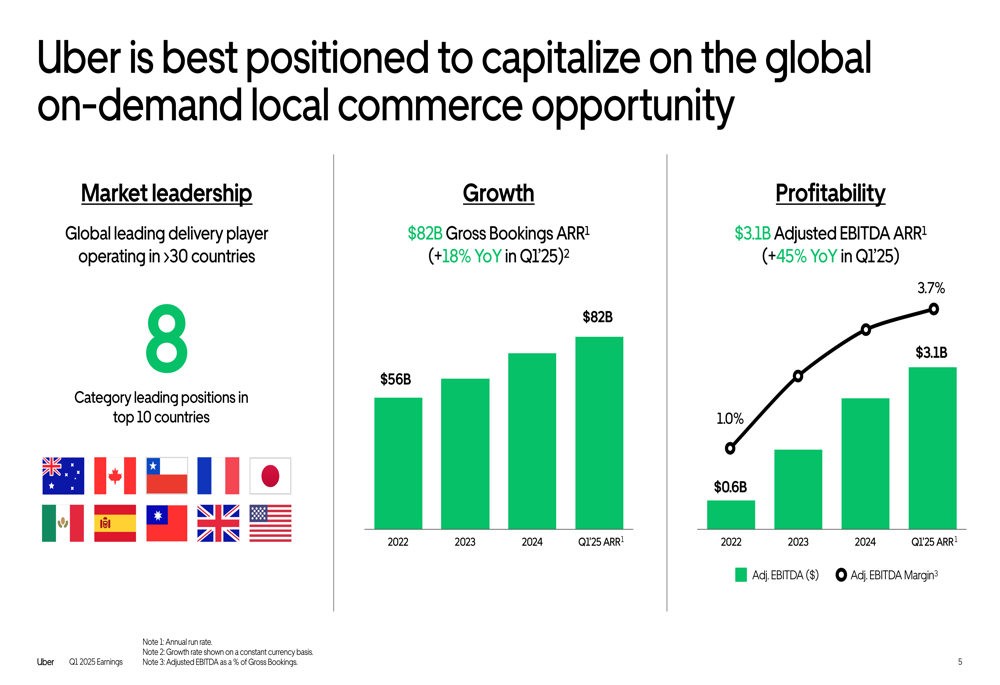
Uber highlighted its strong position in the global on-demand local commerce market, operating in more than 30 countries with category-leading positions in 8 of the top 10 countries. The company emphasized its growth trajectory with gross bookings annual run rate of $82 billion and Adjusted EBITDA annual run rate of $3.1 billion.
The following chart illustrates Uber’s global positioning and growth metrics:
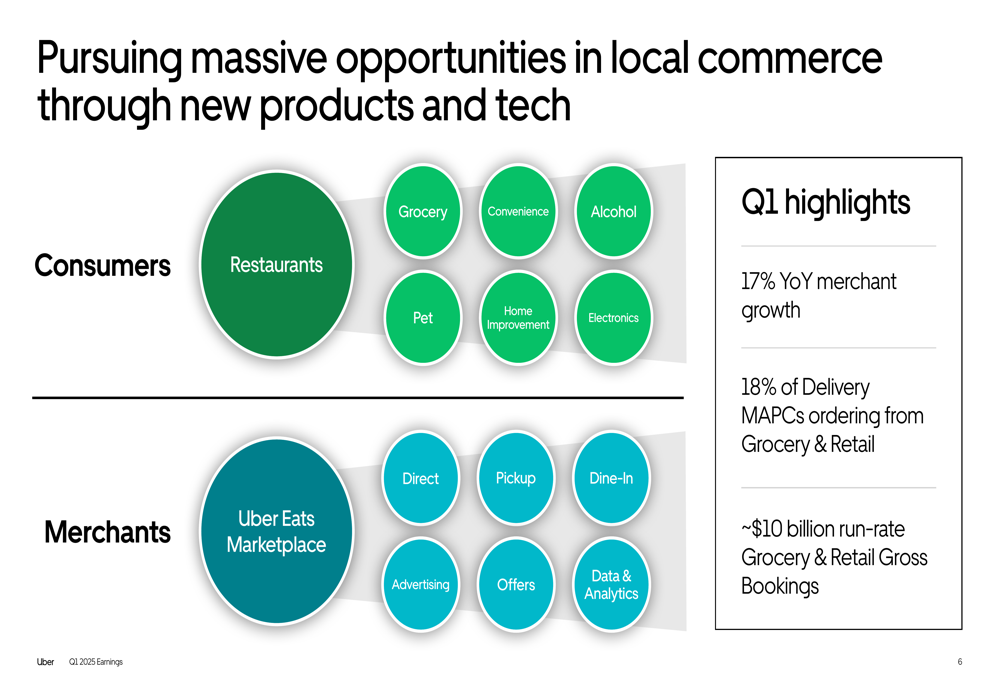
The company is pursuing significant opportunities in local commerce through expanded product offerings and technology enhancements. For consumers, Uber has expanded beyond restaurants to include grocery, convenience, alcohol, pet supplies, and home improvement/electronics. For merchants, the platform offers marketplace access, direct options, pickup, dine-in, advertising, and data analytics.
As shown in this illustration of Uber’s expanding service offerings:
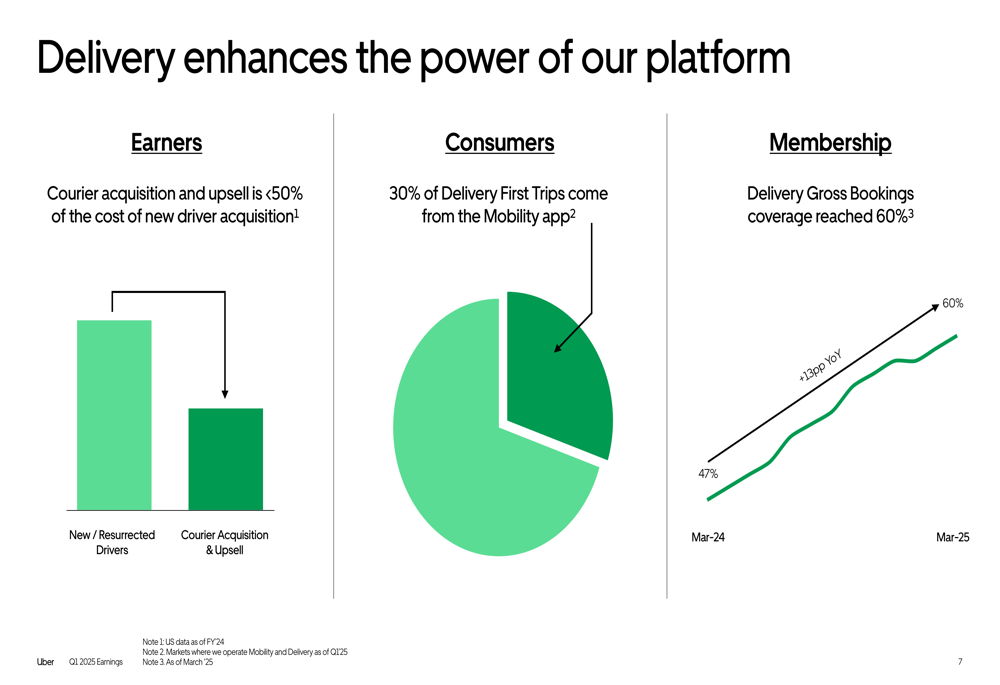
Uber emphasized how its Delivery segment enhances the overall platform ecosystem. The company noted that courier acquisition costs less than 50% of new driver acquisition costs, and 30% of first-time Delivery trips come from the Mobility app. Delivery gross bookings coverage reached 60% as of March 2025, up from 47% a year earlier.
The following chart demonstrates the synergies between Uber’s segments:
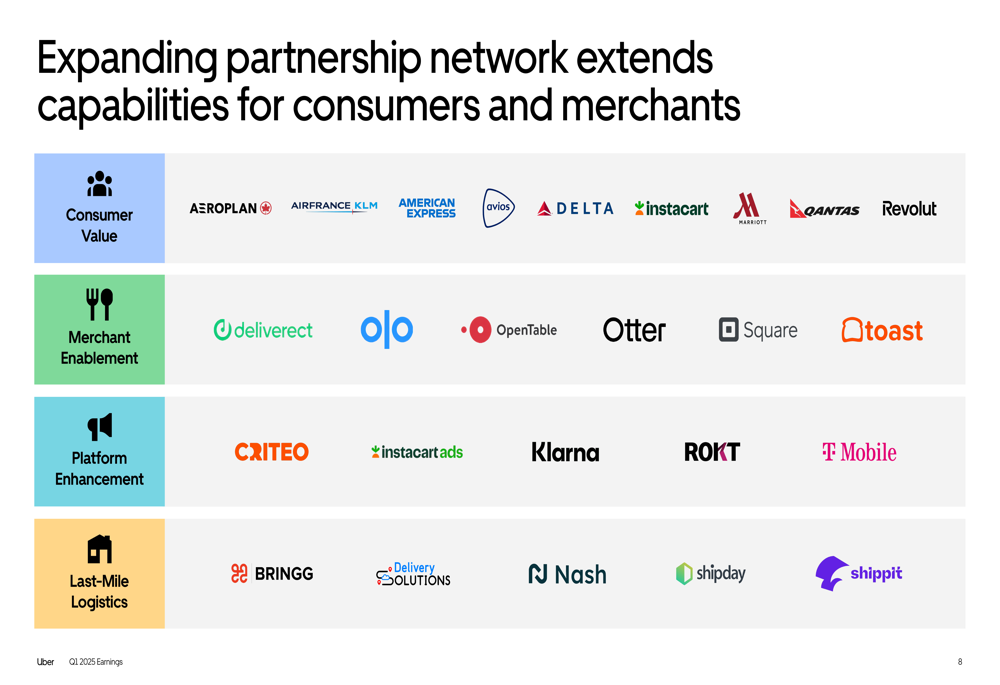
The company continues to expand its partnership network across various categories including consumer value (with partners like American Express (NYSE:AXP), Delta, and Marriott), merchant enablement (with Square, Toast (NYSE:TOST), and OpenTable), platform enhancement (with Criteo and Klarna), and last-mile logistics (with various delivery solution providers).
Forward-Looking Statements
While Uber’s Q1 2025 results showed solid growth across most metrics, the premarket stock decline suggests investors may be concerned about decelerating growth rates compared to previous quarters. The company’s focus on profitability appears to be yielding results, with significant improvements in Adjusted EBITDA and positive net income.
The Delivery segment continues to be a key growth driver, with expansion into grocery and retail creating new revenue opportunities. Uber reported that 18% of Delivery MAPCs are now ordering from grocery and retail categories, with an annual run rate of approximately $10 billion in gross bookings.
Looking ahead, Uber’s strong cash flow generation provides flexibility for continued investments in growth initiatives while potentially increasing shareholder returns. The company’s improving profitability metrics, particularly the 35% year-over-year growth in Adjusted EBITDA and the 112% free cash flow conversion rate, demonstrate progress toward sustainable financial performance.
However, investors will likely be watching closely for signs of further growth deceleration in upcoming quarters, particularly given the competitive landscape in both the mobility and delivery markets. The Freight segment’s continued losses, albeit improving, may also remain an area of concern for some analysts.
Full presentation:
This article was generated with the support of AI and reviewed by an editor. For more information see our T&C.