Moody’s downgrades Senegal to Caa1 amid rising debt concerns

Introduction & Market Context
UL Solutions Inc. (NYSE:ULS) reported strong first-quarter 2025 results on May 6, showing significant organic growth and margin expansion across all business segments. Despite the positive performance, the company’s shares were trading down 4.95% in pre-market at $56.99, following a previous close of $59.96, suggesting investors may have expected even stronger results or guidance.
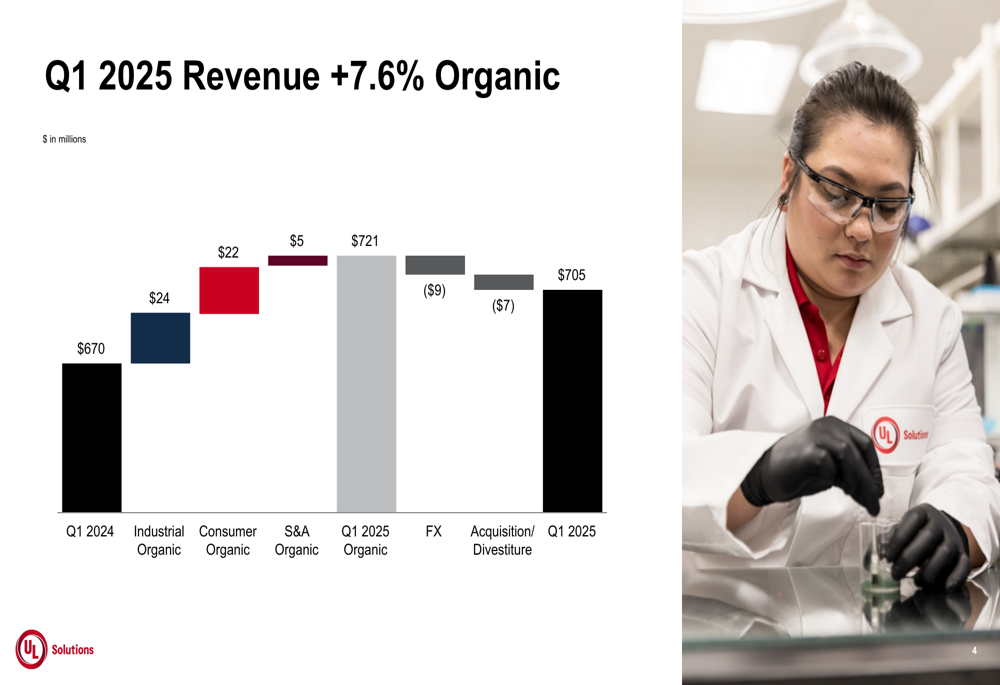
The testing, inspection, certification, and advisory services provider delivered 5.2% overall revenue growth, with organic growth reaching 7.6% when excluding the impacts of foreign exchange and acquisition/divestiture activities.
Quarterly Performance Highlights
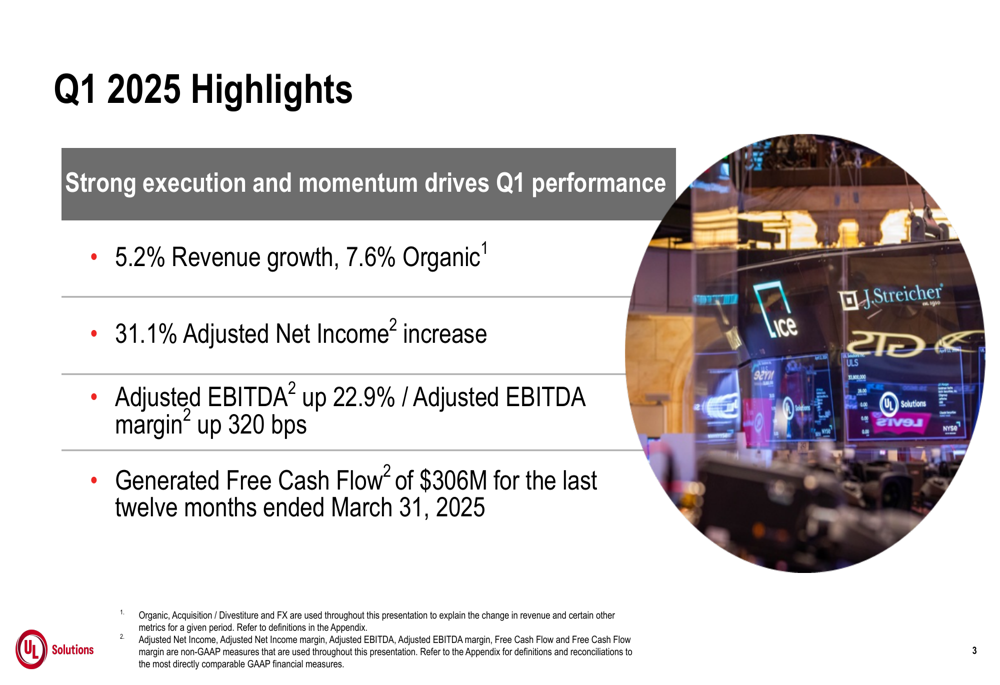
UL Solutions reported Q1 2025 revenue of $705 million, up from $670 million in the same period last year. The company achieved substantial improvements in profitability metrics, with Adjusted EBITDA increasing by 22.9% to $161 million and Adjusted Net Income rising 31.1% to $80 million.
As shown in the following chart of quarterly highlights, the company delivered strong results across all key financial metrics:
The revenue growth was primarily driven by organic growth across all segments, partially offset by negative impacts from foreign exchange and acquisition/divestiture activities. The waterfall chart below illustrates the components of this growth:
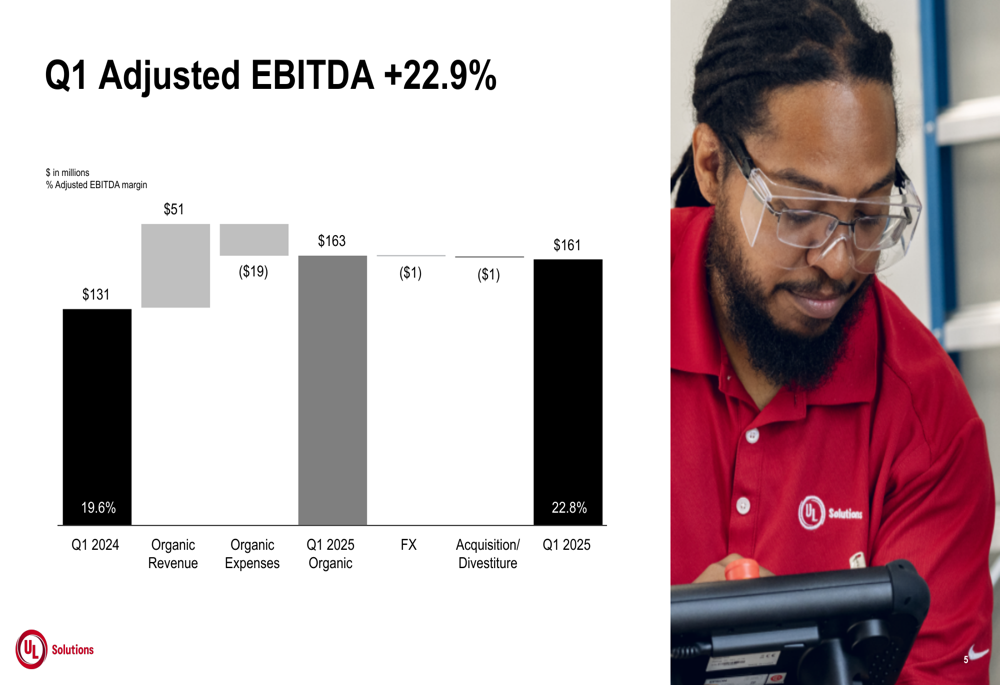
Adjusted EBITDA margin expanded significantly by 320 basis points to 22.8%, driven by strong revenue growth and disciplined cost management. The following chart breaks down the contributors to this improvement:
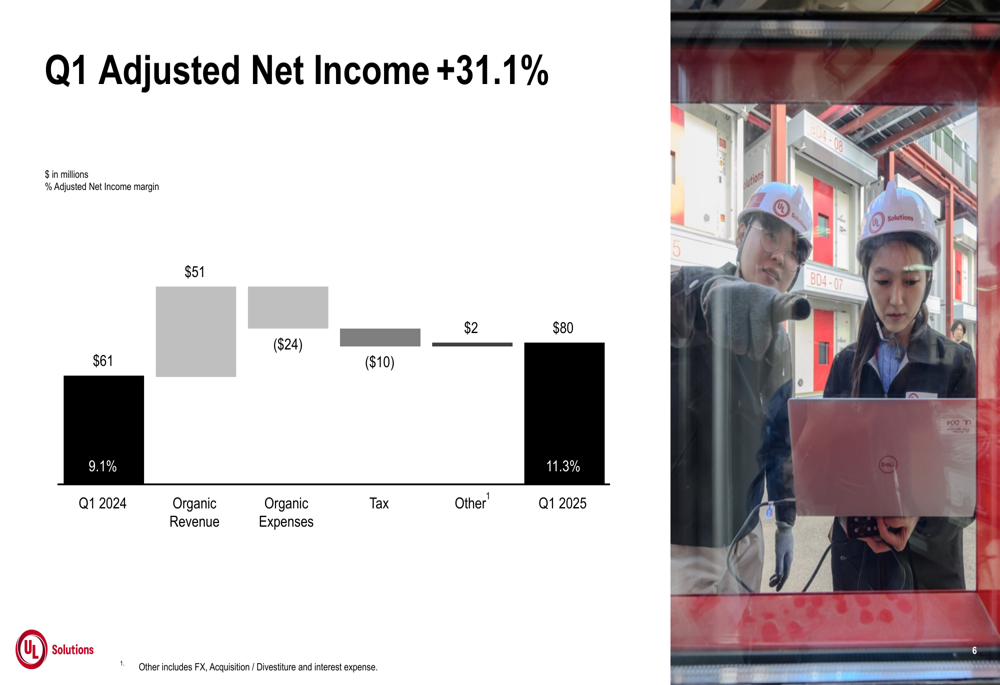
Similarly, Adjusted Net Income grew by 31.1% to $80 million, representing an 11.3% margin, up from 9.1% in Q1 2024. This improvement was primarily driven by organic revenue growth, partially offset by increases in organic expenses and taxes.
Segment Analysis
UL Solutions’ performance was strong across all three business segments, with each showing solid organic growth and margin expansion.
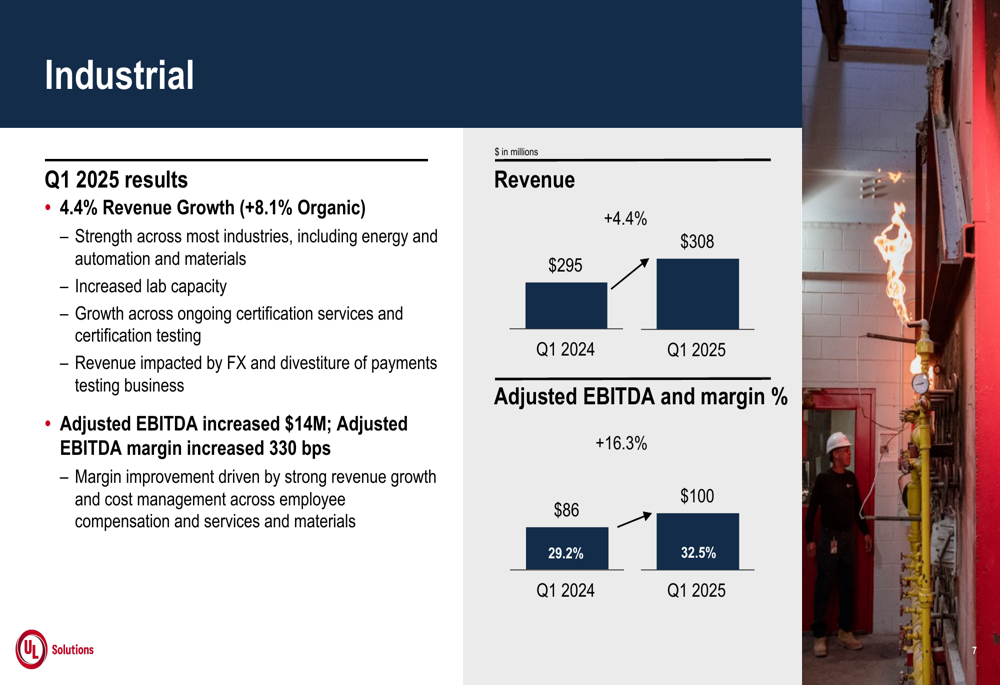
The Industrial segment, which represents approximately 44% of total revenue, delivered 4.4% revenue growth (8.1% organic) to $308 million. Adjusted EBITDA increased by $14 million to $100 million, with margin expanding 330 basis points to 32.5%. The company attributed this performance to strength across most industries including energy, automation, and materials, increased lab capacity, and growth in certification services.
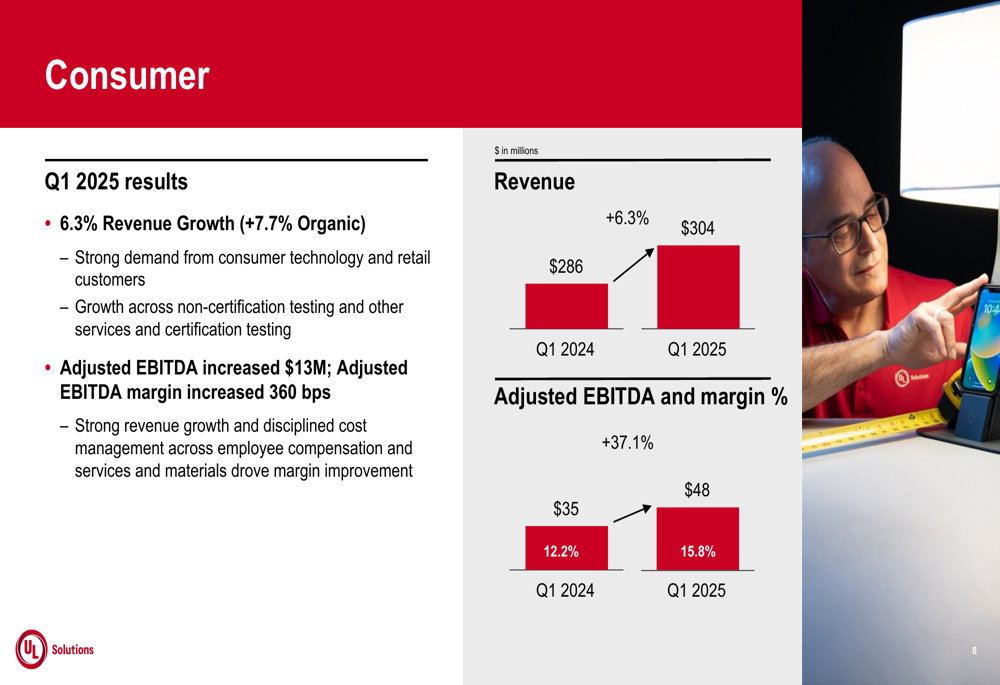
The Consumer segment, accounting for about 43% of revenue, showed 6.3% growth (7.7% organic) to $304 million. Adjusted EBITDA rose by $13 million to $48 million, with margin expanding 360 basis points to 15.8%. This growth was driven by strong demand from consumer technology and retail customers, as well as expansion in non-certification testing and other services.
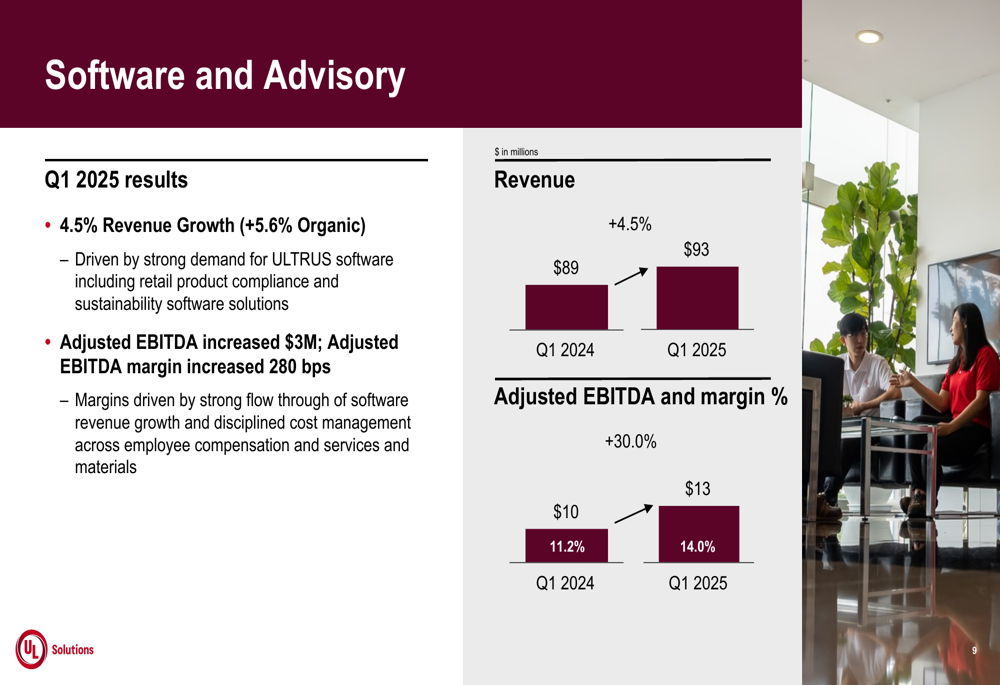
The Software (ETR:SOWGn) and Advisory segment, representing approximately 13% of revenue, achieved 4.5% growth (5.6% organic) to $93 million. Adjusted EBITDA increased by $3 million to $13 million, with margin expanding 280 basis points to 14.0%. The company highlighted strong demand for its ULTRUS software, including retail product compliance and sustainability software solutions.
Cash Flow and Financial Position
UL Solutions demonstrated strong cash generation capabilities, with Free Cash Flow of $306 million for the last twelve months ended March 31, 2025, representing a 28.6% increase compared to the same period last year. The Free Cash Flow margin improved to 10.5% from 8.8%.
As shown in the following chart, the company’s operating cash flow and free cash flow both showed significant improvement:
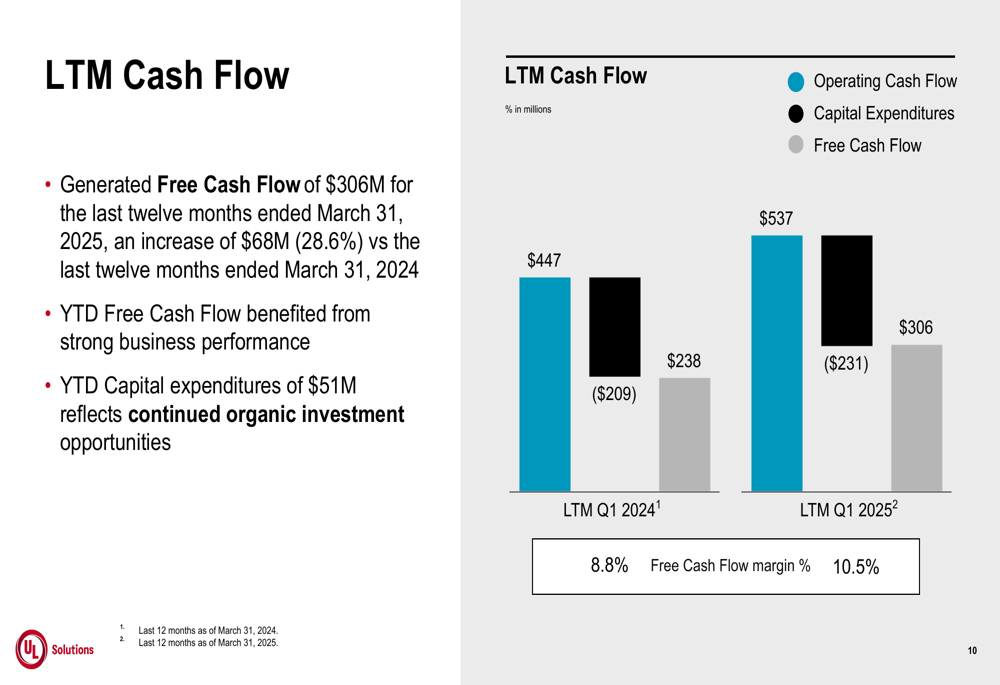
For the first quarter of 2025, UL Solutions generated $154 million in operating cash flow and $103 million in Free Cash Flow, representing 21.8% and 14.6% of revenue, respectively. Capital expenditures for the quarter were $51 million, reflecting continued investment in organic growth opportunities.
Forward-Looking Statements
UL Solutions reaffirmed its full-year 2025 outlook, projecting mid-single-digit constant currency organic revenue growth and Adjusted EBITDA margin improvement to approximately 24%. The company expects capital expenditures to be 7% to 8% of revenue and an effective tax rate of approximately 26%.
The following slide outlines the company’s guidance for the remainder of 2025:
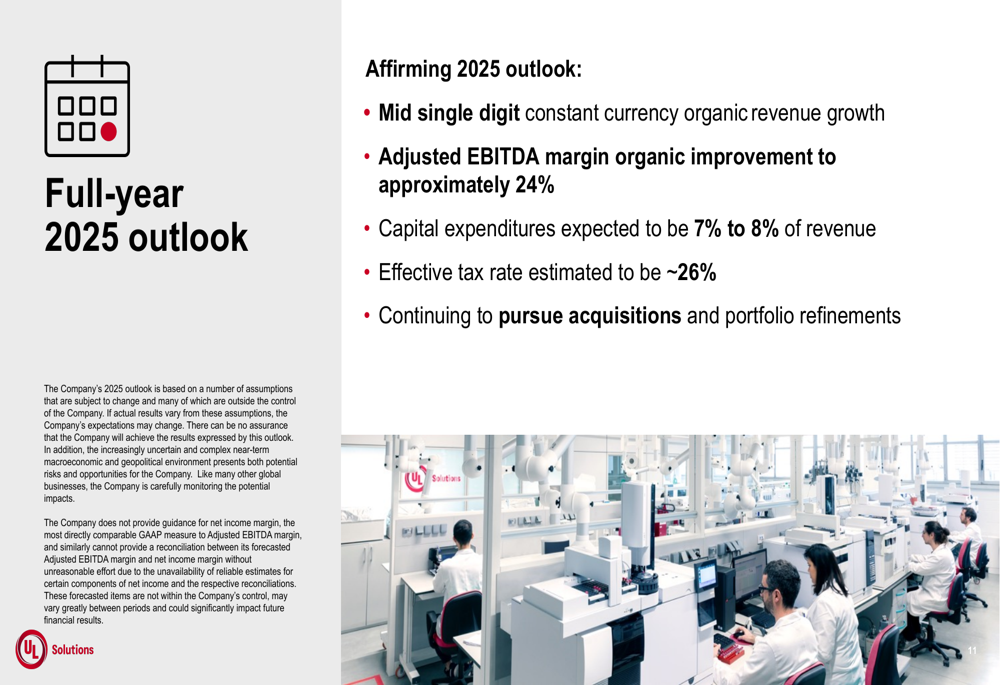
Management indicated they will continue to pursue acquisitions and portfolio refinements as part of their growth strategy. They also acknowledged the risks and opportunities presented by the complex macroeconomic and geopolitical environment.
Despite the strong quarterly performance and positive outlook, the pre-market trading decline suggests investors may have been looking for even stronger guidance or had concerns about specific aspects of the results not addressed in the presentation. The company’s ability to maintain its organic growth momentum and continue expanding margins will be key factors to watch in the coming quarters.
Full presentation:
This article was generated with the support of AI and reviewed by an editor. For more information see our T&C.