Stock market today: S&P 500 rides Apple-led tech rally to close higher

Utz Brands Inc (NYSE:UTZ) reported strong volume-driven growth in its first quarter of 2025, according to the company’s earnings presentation delivered on May 1. Despite implementing strategic price reductions, the snack food manufacturer achieved organic net sales growth of 2.9% and expanded profit margins through productivity initiatives. However, the market appeared skeptical, with shares dropping 7.75% in premarket trading following the announcement.
Quarterly Performance Highlights
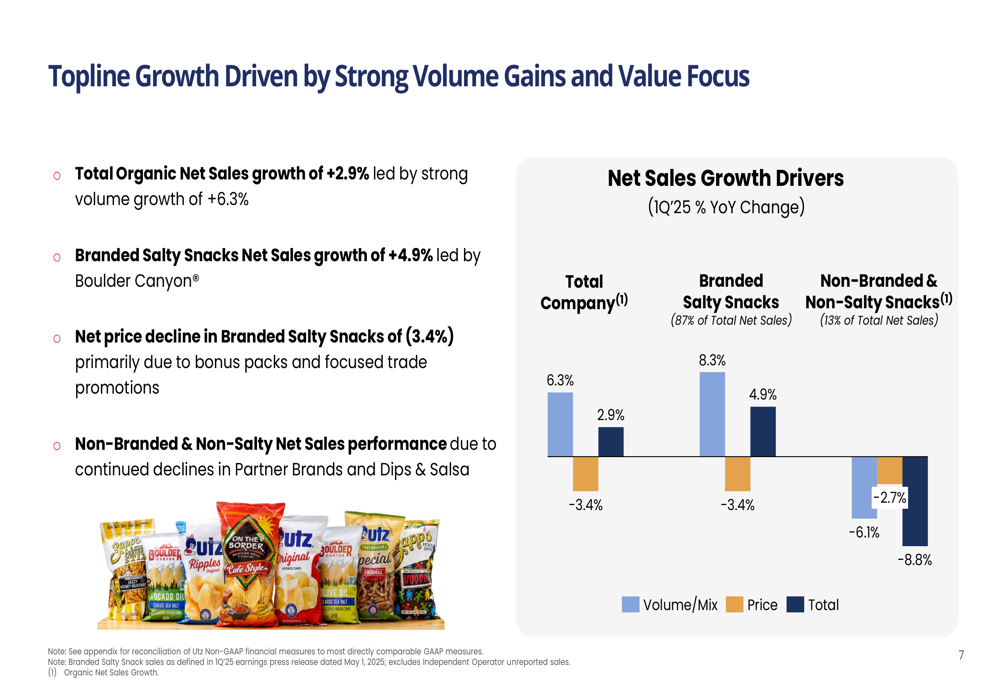
Utz delivered organic net sales growth of 2.9% in Q1 2025, reaching $352.1 million. This growth was driven by a robust 6.3% increase in volume, partially offset by a 3.4% decline in pricing. The company’s branded salty snacks segment, which now represents 87% of total sales (up from 82% in Q1 2023), grew by 4.9%.
"We delivered a strong start to 2025, with dollar and volume share gains in the salty snacks category," said Howard Friedman, Chief Executive Officer. "Our ability to grow despite category softness demonstrates our unique geographic expansion opportunity."
As shown in the following chart of quarterly revenue growth, Utz achieved increases across key financial metrics:
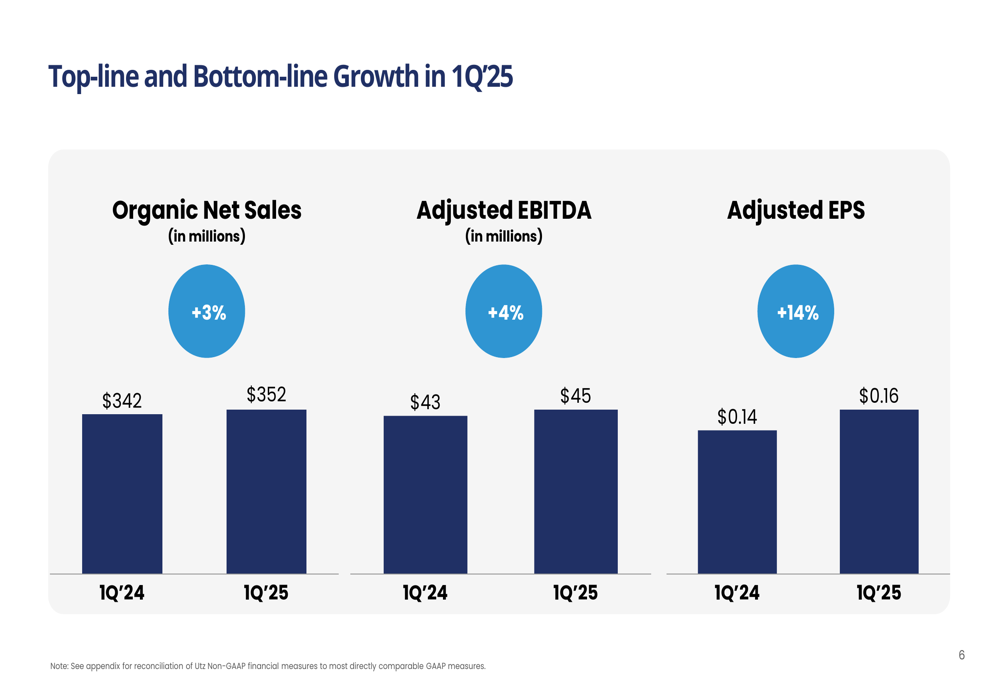
Adjusted EBITDA increased by 3.9% to $45.1 million, with margins expanding by 30 basis points. Adjusted earnings per share grew 14.3% to $0.16, driven by operating earnings growth and lower interest expense.
The company’s topline growth was primarily driven by volume gains, as illustrated in this breakdown:
Strategic Initiatives
Utz’s growth strategy centers on three key pillars: consumer value offerings, geographic expansion, and productivity improvements.
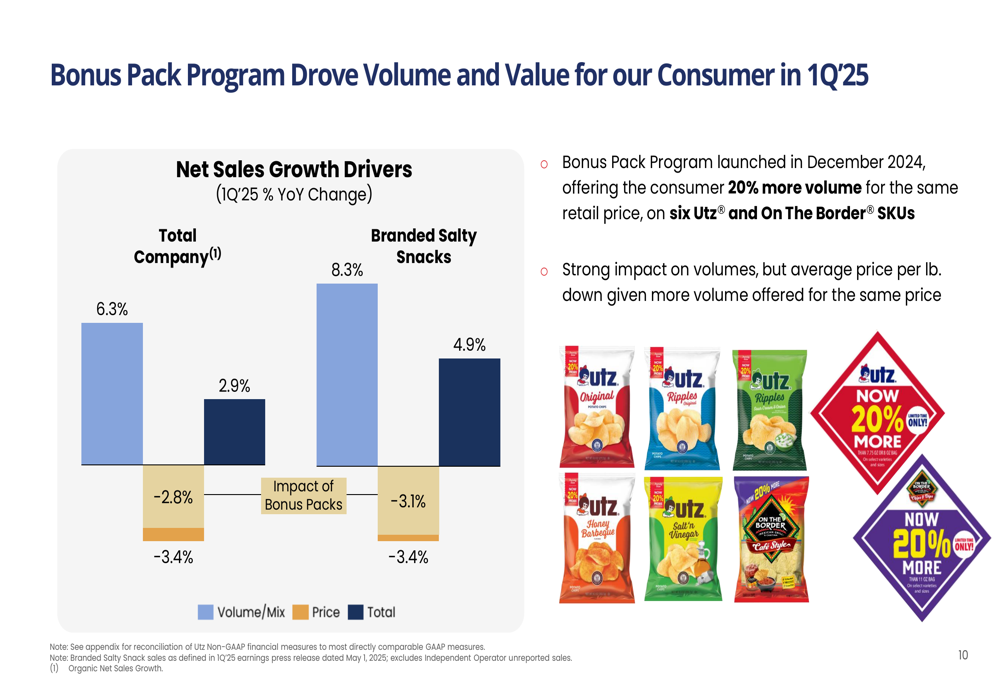
The company implemented a bonus pack program in December 2024, offering 20% more volume on six Utz and On The Border SKUs while maintaining retail prices. This initiative helped drive significant volume growth despite the resulting decline in average price per pound.
As shown in the following image of the bonus pack program:
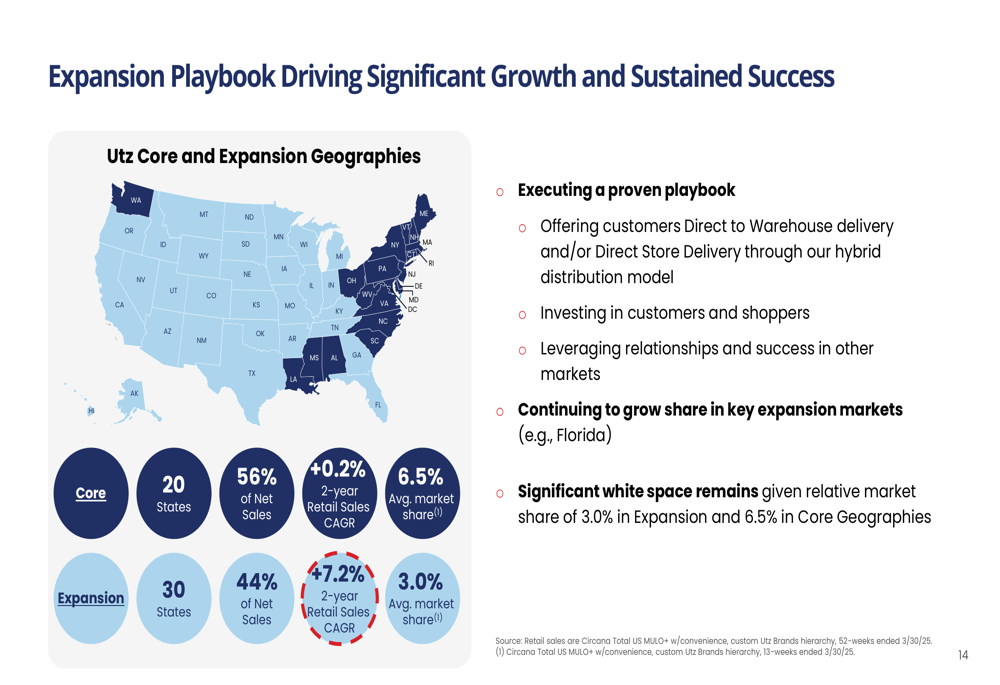
Geographic expansion remains a critical growth driver for Utz. The company divides its market into 20 core states (accounting for 56% of net sales with 6.5% market share) and 30 expansion states (with 3.0% market share). The expansion markets showed particularly strong performance, with retail volume increasing by 8.9% in Q1.
The company’s geographic strategy is illustrated in this regional breakdown:
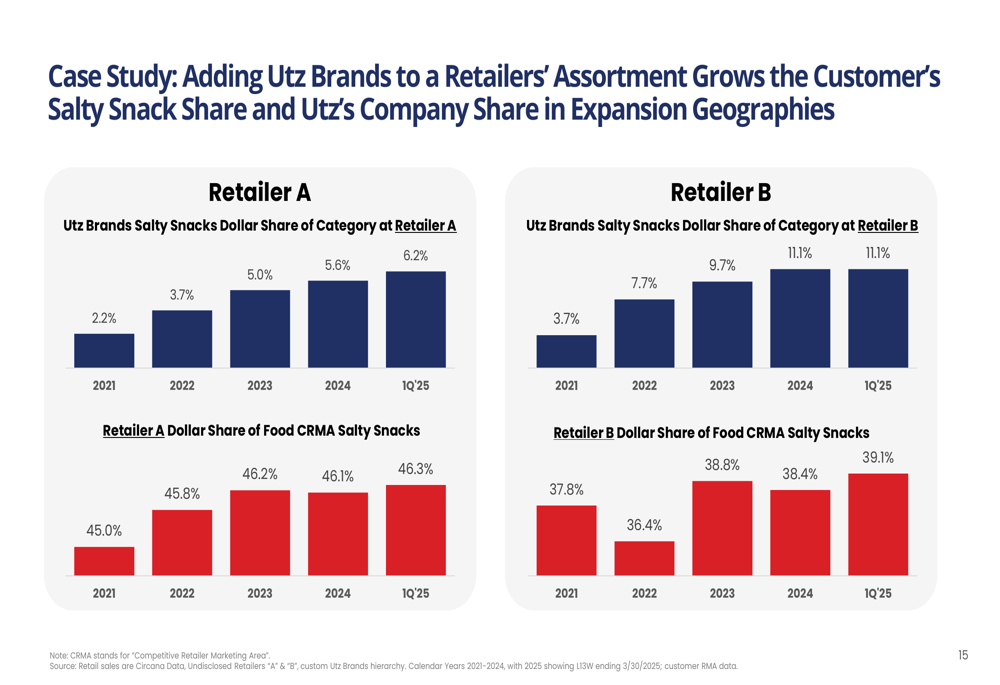
Utz presented compelling evidence that its expansion strategy benefits retail partners as well. A case study showed that retailers who added Utz brands to their assortments saw their own salty snack category share increase:
Detailed Financial Analysis
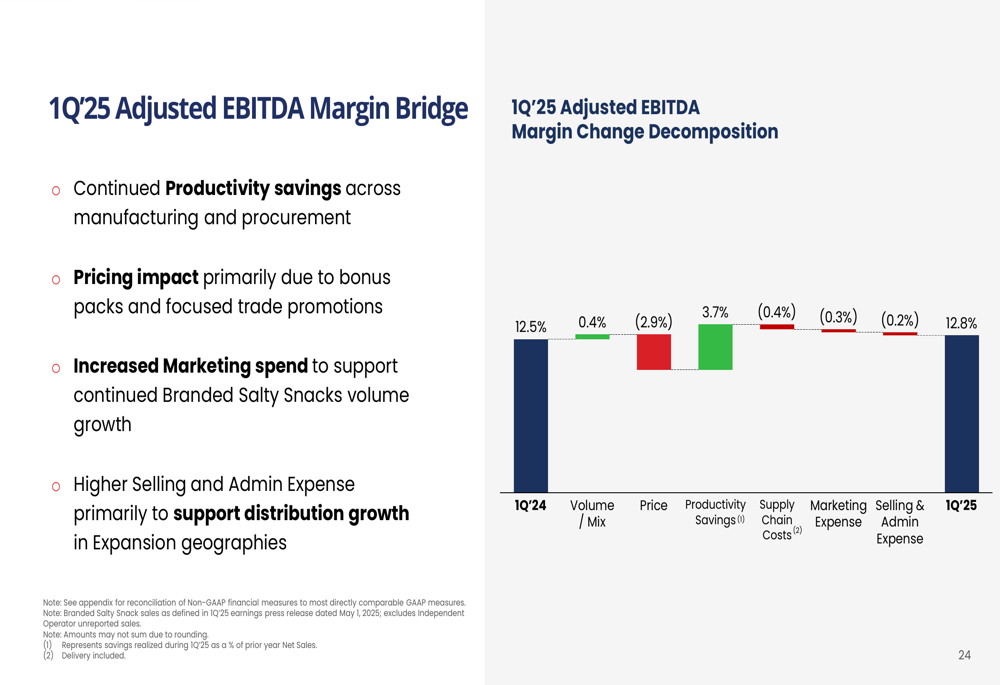
Utz’s adjusted gross profit margin expanded by 100 basis points in Q1, primarily driven by productivity initiatives across manufacturing and procurement. This improvement was partially offset by pricing impacts from the bonus pack program and increased marketing and distribution expenses to support growth in expansion geographies.
The following chart breaks down the components of Utz’s adjusted EBITDA margin expansion:
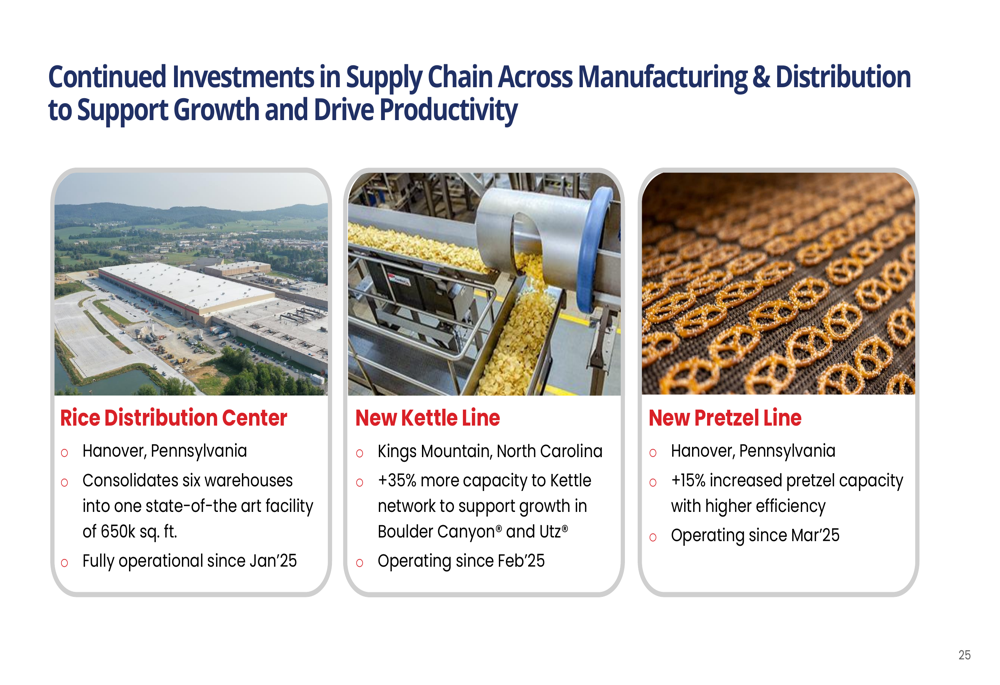
The company continues to invest in its supply chain to support growth and drive productivity. Recent investments include a new rice distribution center in Hanover, Pennsylvania, that consolidates six warehouses; a new kettle line in Kings Mountain, North Carolina, that increases capacity by 35%; and a new pretzel line in Hanover that improves efficiency by 15%.
These supply chain investments are illustrated below:
On the balance sheet side, Utz reported $62.7 million in cash and cash equivalents, with gross debt of $863.6 million and a net leverage ratio of 4.0x. The company plans to reprice its $630 million Term Loan B to lower the spread from S+275 to S+250, which is expected to reduce annual interest expenses by approximately $1.6 million.
Forward-Looking Statements
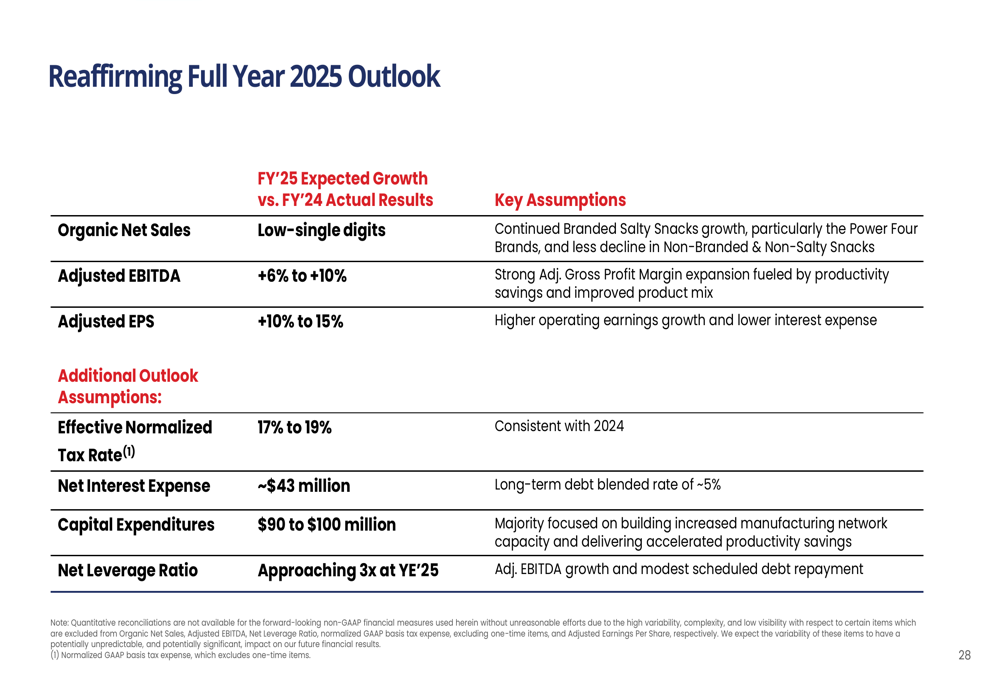
Utz reaffirmed its full-year 2025 guidance, projecting organic net sales growth in the low-single digits, adjusted EBITDA growth of 8-10%, and adjusted EPS growth of 10-15%. The company expects its net leverage ratio to approach 3x by year-end 2025.
The full-year outlook is summarized in the following slide:
The company remains on track to deliver more than $150 million in productivity savings from 2024 to 2026, which is $15 million higher than its initial Investor Day target. These savings are expected to continue fueling margin expansion and enabling reinvestment in brands and capabilities.
Despite the positive presentation, investors appeared concerned about the company’s reliance on volume growth amid pricing pressures, as evidenced by the 7.75% premarket decline following the earnings release. This reaction suggests the market may be skeptical about Utz’s ability to maintain momentum in a challenging consumer environment where value-seeking behavior continues to dominate purchasing decisions.
Full presentation:
This article was generated with the support of AI and reviewed by an editor. For more information see our T&C.