Bitcoin price today: falls to 2-week low below $113k ahead of Fed Jackson Hole

Introduction & Market Context
Valley National Bancorp (NASDAQ:VLY) released its second quarter 2025 earnings presentation on July 24, revealing a substantial improvement in profitability metrics compared to both the previous quarter and the same period last year. The bank reported a 26% increase in net income from the first quarter, reaching $133.2 million on a GAAP basis, while continuing to make progress on its strategic initiatives to diversify its loan portfolio and deposit base.
The results mark a significant recovery from the bank’s Q1 2025 performance, which saw the company miss analyst expectations with an EPS of $0.18 versus the $0.19 forecast. Valley’s stock was trading at $9.70 before the earnings release, with pre-market activity showing a slight decline of 1.03% to $9.60.
Quarterly Performance Highlights
Valley National reported second quarter 2025 net income of $133.2 million (GAAP) and $134.4 million (non-GAAP), compared to $106.1 million in Q1 2025 and $70.4 million in Q2 2024. This translated to diluted earnings per share of $0.22 (GAAP) and $0.23 (non-GAAP), a significant improvement from $0.18 in the previous quarter.
The bank’s return on average assets improved to 0.86% (GAAP) and 0.87% (non-GAAP), up from 0.69% in Q1 2025, while the efficiency ratio improved to 55.2% from 55.9% in the previous quarter and 59.6% a year ago.
As shown in the following comprehensive overview of Valley’s financial performance for Q2 2025:
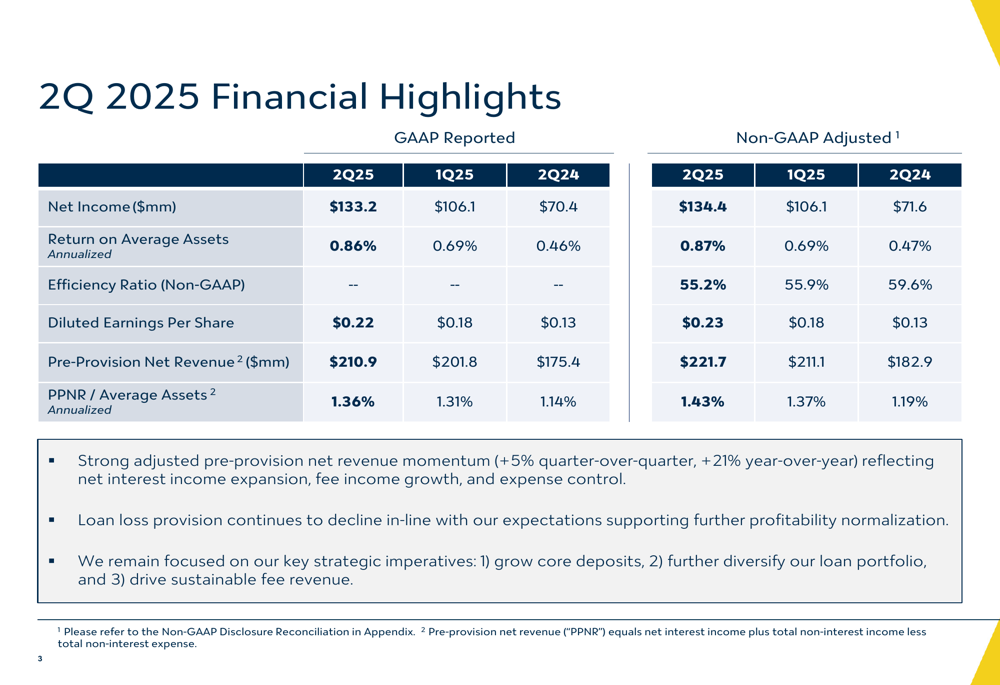
The bank’s pre-provision net revenue reached $210.9 million (GAAP) and $221.7 million (non-GAAP), compared to $201.8 million (GAAP) and $211.1 million (non-GAAP) in the first quarter. This improvement reflects the bank’s continued focus on operational efficiency and revenue growth.
Net Interest Income and Margin Expansion
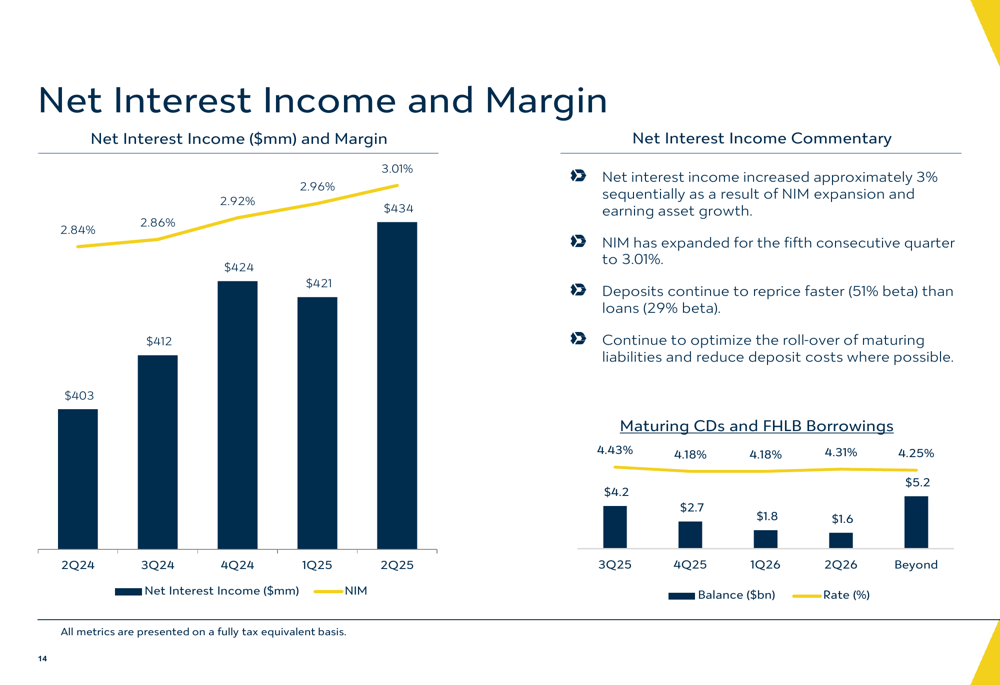
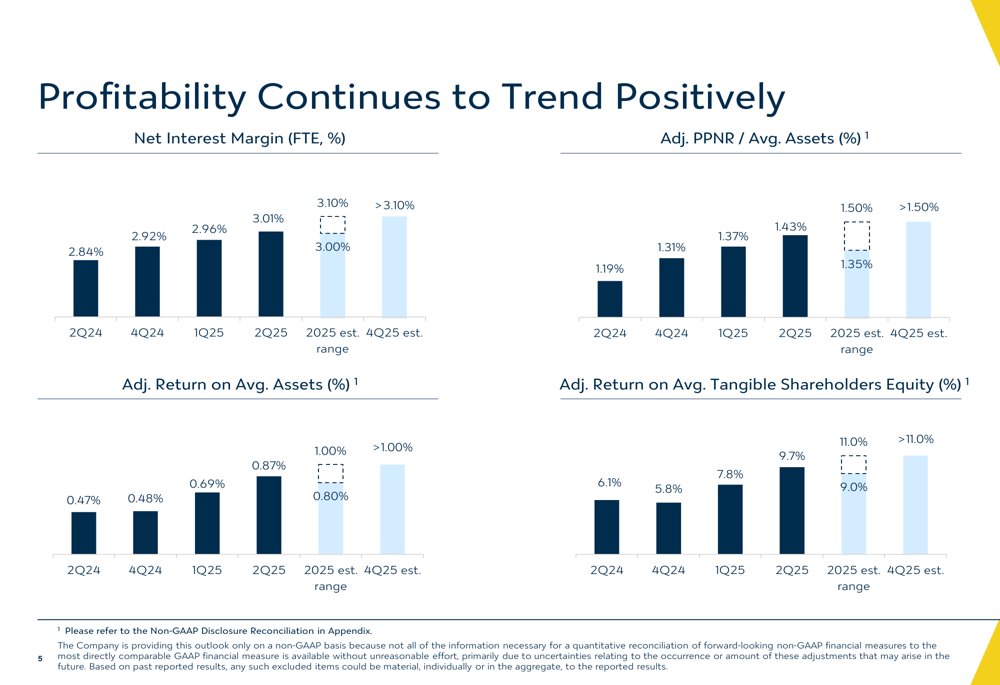
One of the most notable achievements in Valley’s Q2 results was the continued expansion of its net interest margin (NIM), which reached 3.01%, marking the fifth consecutive quarter of improvement. This represents an increase from 2.92% in Q1 2025 and 2.84% in Q2 2024.
Net interest income increased approximately 3% sequentially to $434 million, driven by both NIM expansion and earning asset growth. The bank’s presentation highlighted favorable repricing of maturing CDs and FHLB borrowings as contributing factors to the margin improvement.
The following chart illustrates Valley’s consistent NIM expansion trend over the past five quarters:
Balance Sheet Strength and Diversification
Valley National continues to strengthen its balance sheet while reducing concentration risks. The bank’s loan portfolio grew to $49.4 billion as of June 30, 2025, up from $48.7 billion at the end of the first quarter. This growth was primarily driven by residential and consumer loans, which increased by $0.7 billion during the quarter.
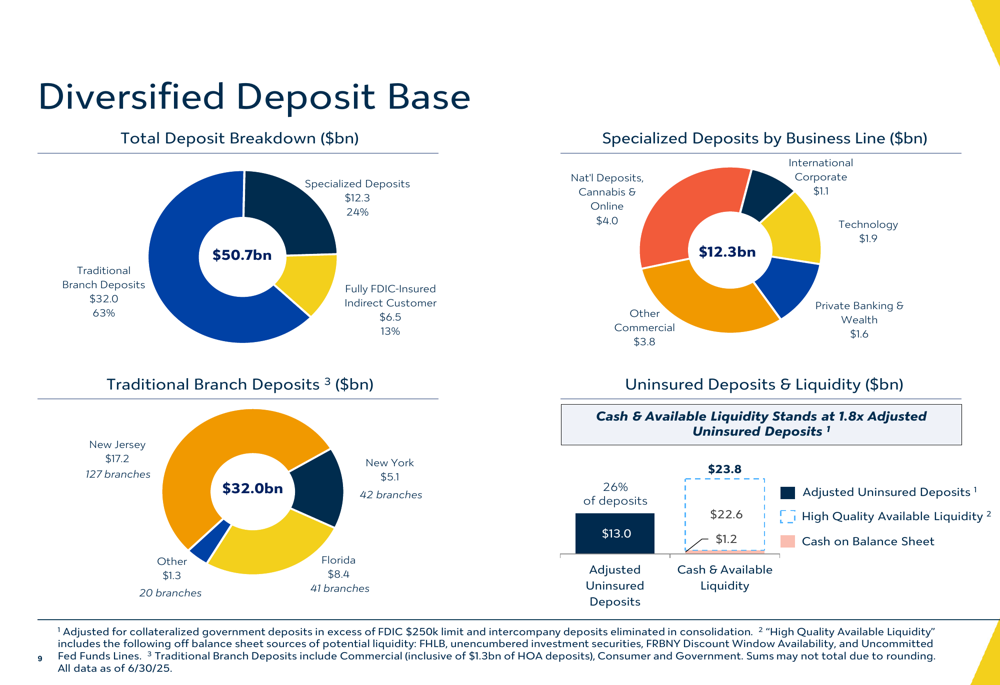
The bank’s deposit base stood at $50.7 billion at quarter-end, up from $50.0 billion in the previous quarter. Valley has made significant progress in diversifying its deposit sources, with 87% of deposits now coming from direct customer relationships.
The following breakdown shows Valley’s diversified deposit base by category and region:
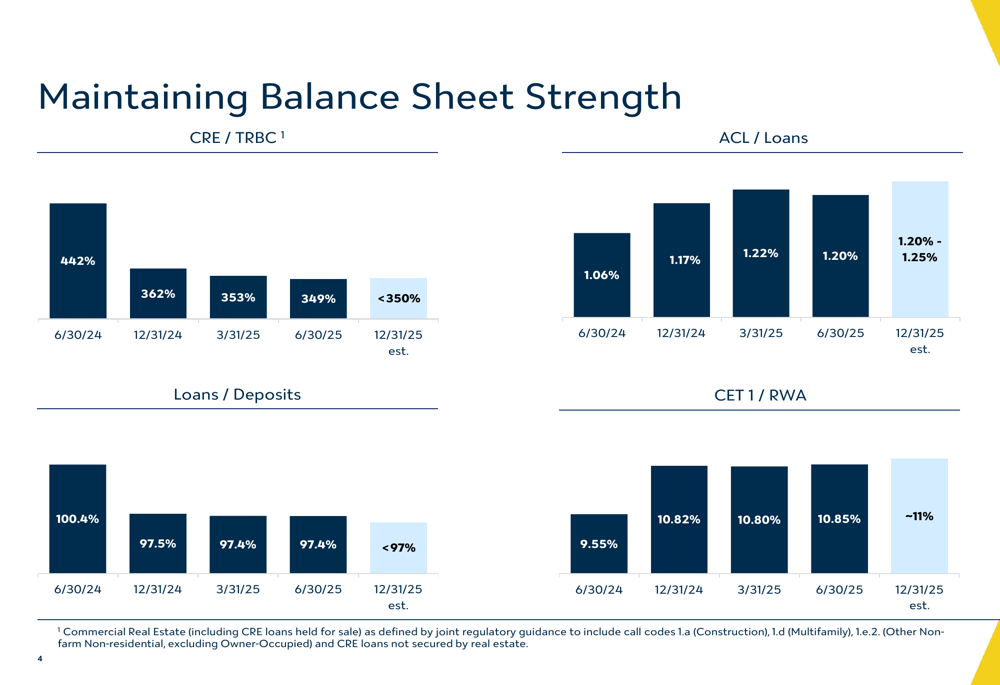
Valley’s loan-to-deposit ratio improved to 97% from 100.4% a year ago, reflecting the bank’s strategic focus on growing core deposits. The bank has also continued to build its allowance for credit losses, which stood at 1.20% of total loans as of June 30, 2025.
The presentation highlighted the bank’s progress in improving key balance sheet metrics, including a projected reduction in commercial real estate concentration to less than 350% of total risk-based capital by year-end 2025, down from 442% a year ago:
Asset Quality and Credit Metrics
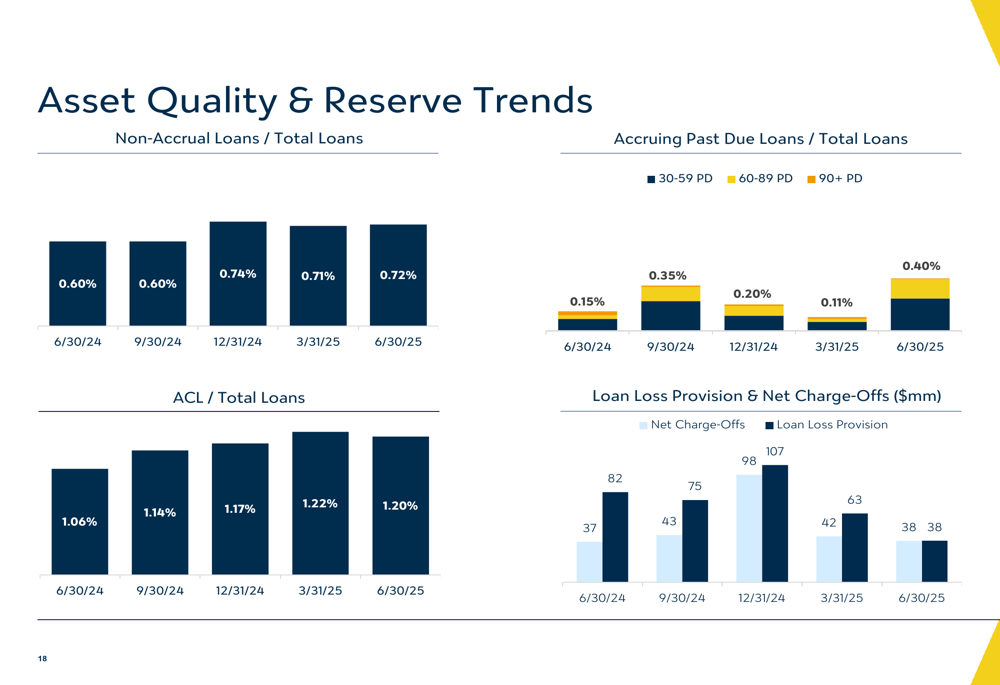
Valley National maintained stable asset quality metrics in the second quarter. Non-accrual loans represented 0.72% of total loans, slightly up from 0.71% in the first quarter but still reflecting a controlled credit environment. The bank’s allowance for credit losses to total loans ratio stood at 1.20%, down slightly from 1.22% in the previous quarter but up from 1.06% a year ago.
The following chart shows Valley’s asset quality and reserve trends over the past five quarters:
Strategic Initiatives
Valley continues to execute on its strategic initiatives to diversify its loan portfolio and revenue streams. The bank has made significant progress in growing its Commercial & Industrial (C&I) loan portfolio, which reached $10.9 billion as of June 30, 2025, up from just $2.7 billion in 2017. This growth has been accompanied by geographic diversification, with increased C&I lending in Florida and other southeastern markets.
The bank’s profitability trends show the positive impact of these strategic initiatives, with improvements across all key metrics:
Valley has also made substantial progress in diversifying its revenue streams, shifting from gain-on-sale income to more sustainable fee-based revenue. Non-interest income (excluding gain on sale of loans) has grown at a 12% CAGR since 2017, with wealth management, deposit service charges, and capital markets activities now representing significant portions of fee income.
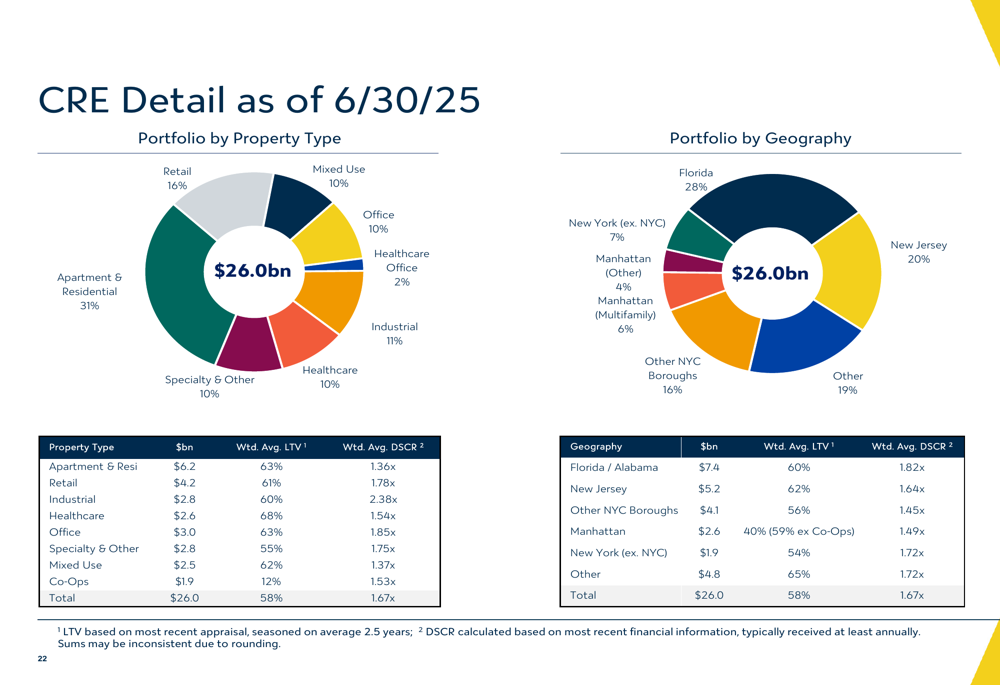
The bank’s commercial real estate portfolio, while still substantial, has become more diversified by property type and geography. The following breakdown illustrates this diversification:
Forward Guidance
Valley National updated its guidance for 2025, projecting loan growth of approximately 3%, slightly below the initial expectation of 3-5%. Net interest income growth is now expected to be 8-10%, compared to the initial guidance of 9-12%.
The bank maintained its non-interest income growth projection of 6-10% but lowered its non-interest expense growth guidance to 2-4% from the initial 3-5%, reflecting improved cost control. Credit expectations were refined, with net charge-offs projected at $100-125 million and loan loss provisions at approximately $150 million for the year.
Competitive Positioning
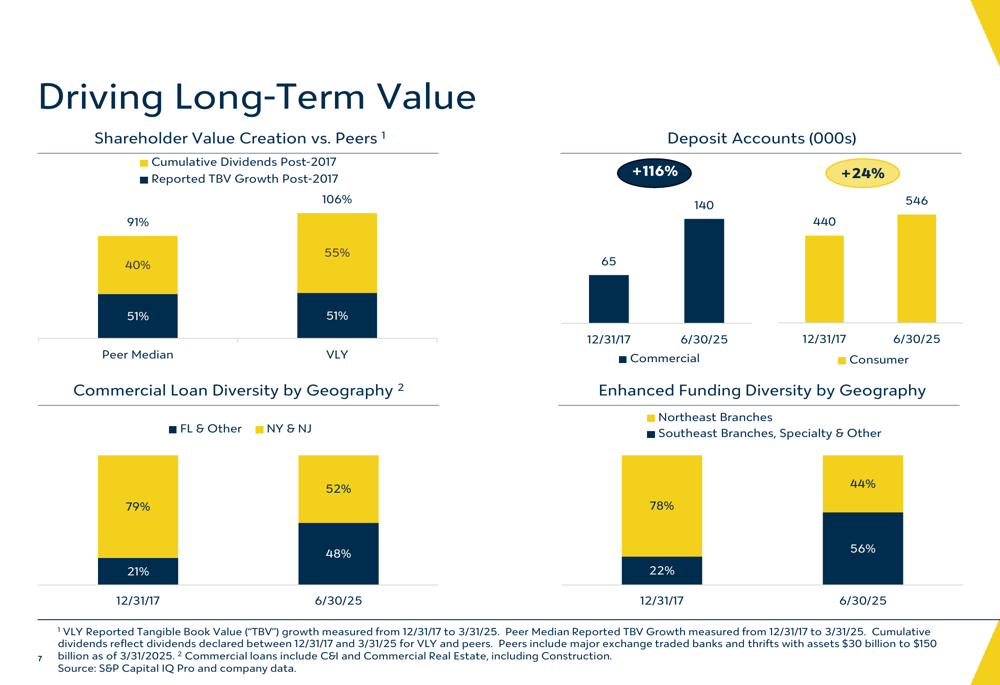
Valley National highlighted its strong performance relative to peers in creating shareholder value. Since 2017, the bank has delivered 106% tangible book value growth compared to the peer median of 51%, while providing 55% cumulative dividends versus the peer median of 40%.
The following chart illustrates Valley’s long-term value creation and diversification progress:
Conclusion
Valley National’s Q2 2025 earnings presentation demonstrates significant improvement in profitability metrics and continued progress on strategic initiatives to diversify the bank’s loan portfolio, deposit base, and revenue streams. The fifth consecutive quarter of net interest margin expansion, combined with controlled expenses and stable asset quality, positions the bank well for continued performance improvement in the second half of 2025.
While the bank has adjusted some of its full-year guidance slightly downward, the overall trajectory remains positive, with management expressing confidence in achieving sustainable growth and improved returns. Investors will likely focus on the bank’s ability to maintain its margin expansion trend and continue executing on its diversification strategy in an evolving economic environment.
Full presentation:
This article was generated with the support of AI and reviewed by an editor. For more information see our T&C.