Nvidia and TSMC to unveil first domestic wafer for Blackwell chips, Axios reports

Introduction & Market Context
Valmont Industries Inc (NYSE:VMI) presented its Q2 2025 earnings results on July 22, showcasing a period of strategic realignment amid modest sales growth. The company’s stock, which closed at $397.39 (up 1.39%) on the day of the presentation, experienced a 2.37% decline in premarket trading to $387.98, suggesting mixed investor reaction to the company’s strategic shifts.
Valmont’s presentation emphasized its alignment with key megatrends including energy transition, infrastructure investment, and global food security. The company is particularly focused on capitalizing on what it calls the "infrastructure wave" through significant investments in its utility business.
Quarterly Performance Highlights
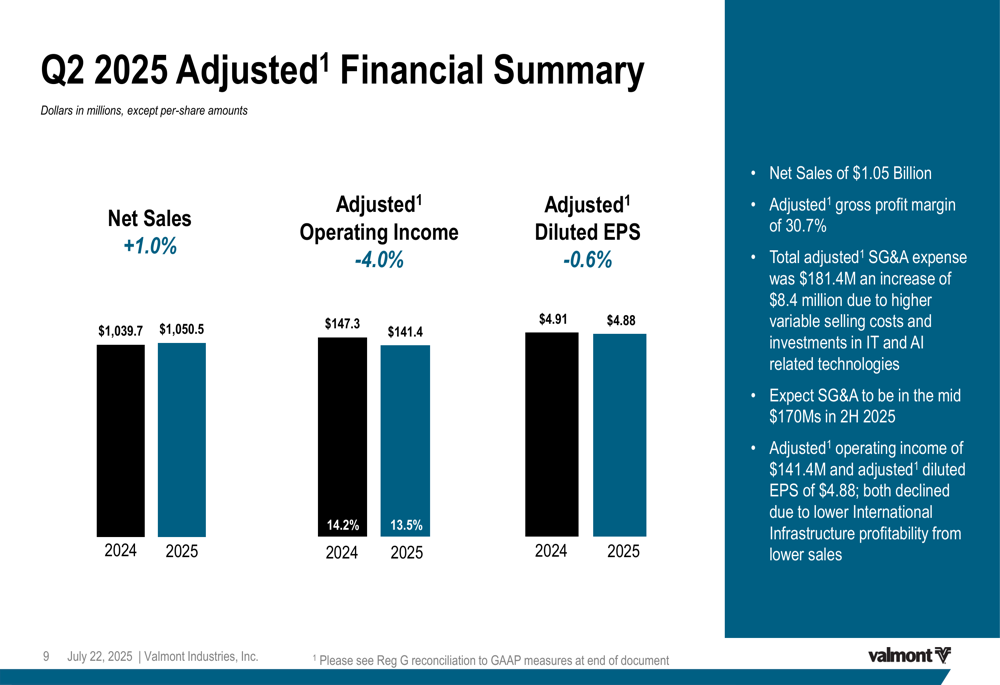
Valmont reported Q2 2025 net sales of $1.05 billion, representing a modest 1.0% increase year-over-year. While GAAP operating margin fell significantly to 2.8%, adjusted operating margin came in at 13.5%, down 70 basis points from the previous year. The company’s adjusted diluted EPS reached $4.88, a slight 0.6% decrease compared to Q2 2024.
Operating cash flows showed considerable strength, increasing 28.1% to $167.6 million, demonstrating the company’s ability to generate cash despite ongoing restructuring efforts.
As shown in the following financial summary:
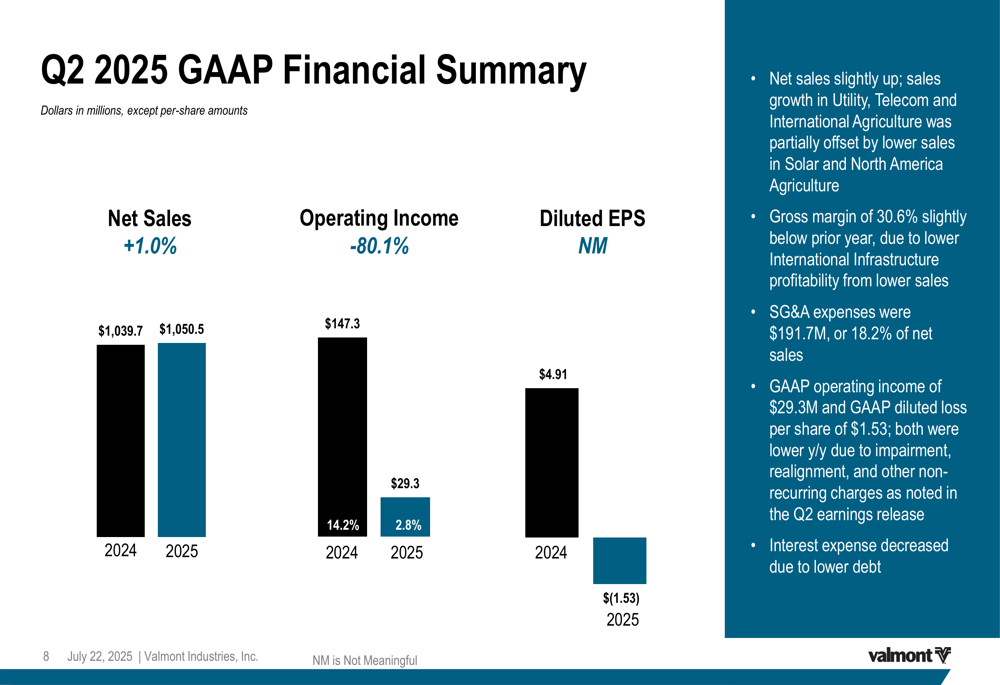
The company’s GAAP results were significantly impacted by non-recurring charges related to organizational realignment and portfolio refinements. These adjustments are clearly visible when comparing the GAAP results with adjusted figures:
Strategic Initiatives & Restructuring
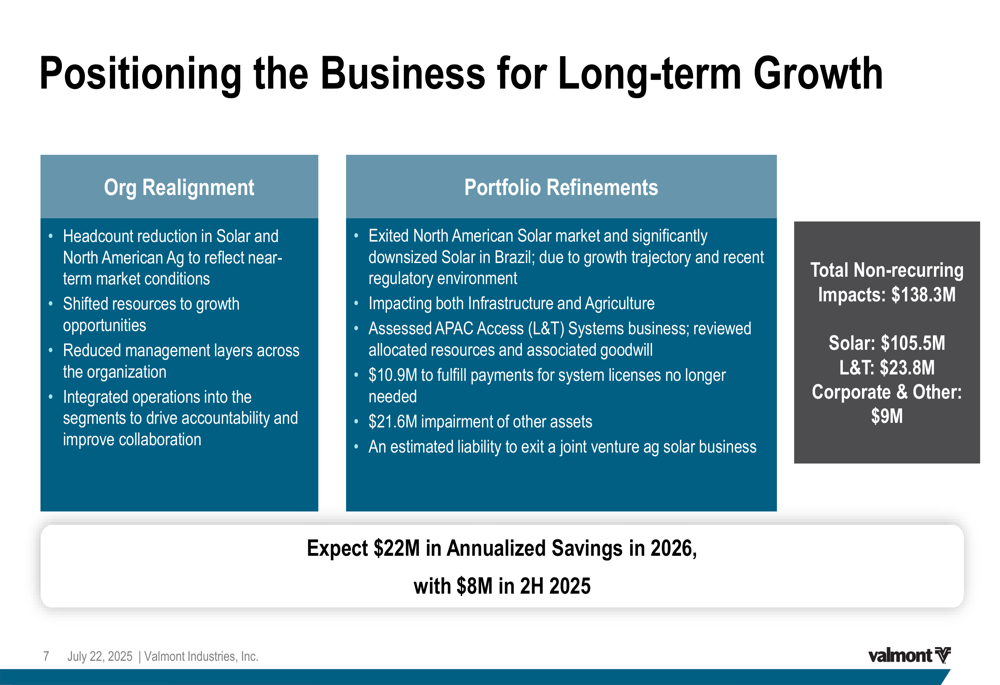
A major focus of Valmont’s Q2 presentation was its comprehensive organizational realignment and portfolio refinement strategy. The company recorded approximately $138.3 million in non-recurring charges, primarily related to exiting the North American solar market and significantly downsizing solar operations in Brazil.
The restructuring also included headcount reductions in Solar and North American Agriculture segments, shifting resources toward growth opportunities, reducing management layers, and integrating operations. Management expects these changes to generate approximately $22 million in annualized savings by 2026, with $8 million in savings anticipated in the second half of 2025.
The following slide details the company’s restructuring efforts:
Segment Performance
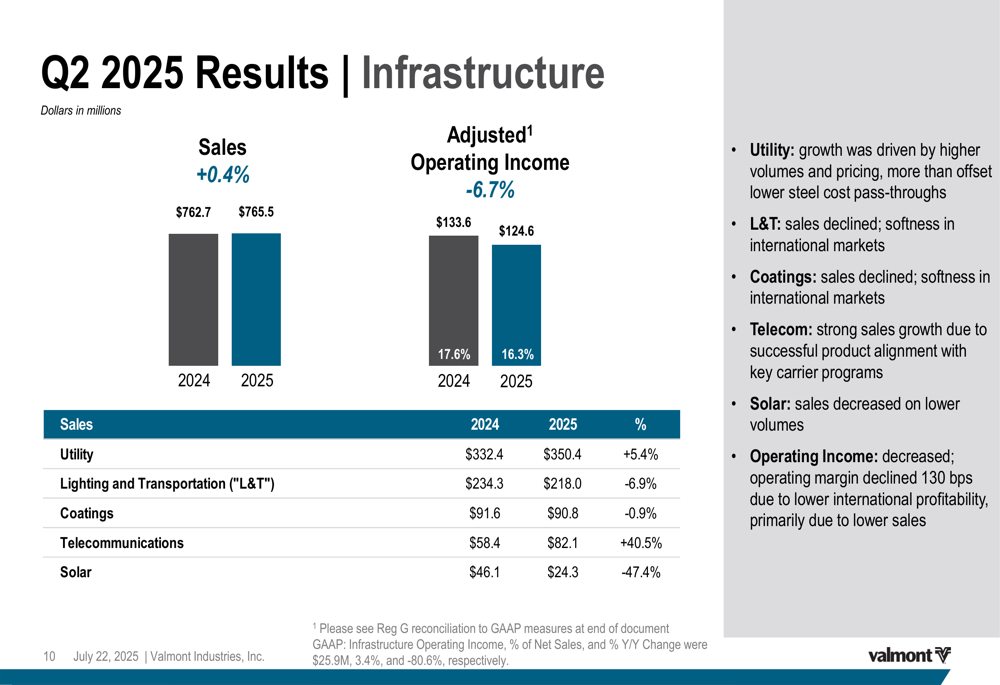
Valmont’s Infrastructure segment, which accounts for approximately 73% of total revenue, reported sales of $765.5 million, a slight increase of 0.4% year-over-year. Within this segment, performance varied significantly across subsegments. Telecommunications showed exceptional growth of 40.5%, while Utility sales increased by 5.4%. However, these gains were largely offset by declines in Lighting and Transportation (-6.9%) and Solar (-47.4%).
The segment breakdown is illustrated here:
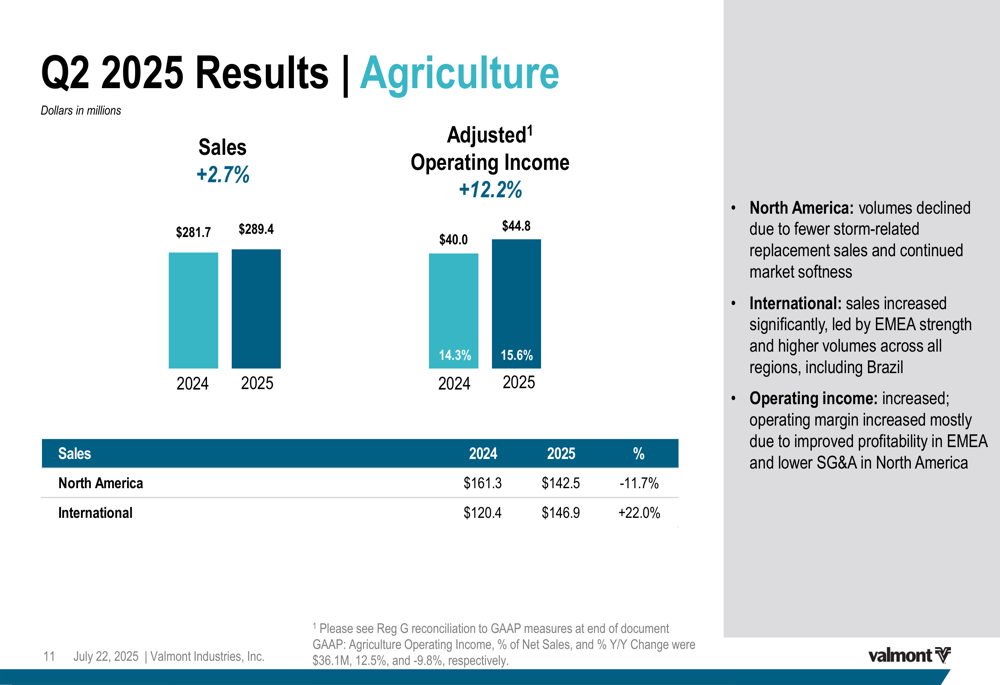
The Agriculture segment demonstrated stronger overall performance with sales of $289.4 million, up 2.7% year-over-year. This growth was driven entirely by international markets, which saw sales increase by 22.0% to $146.9 million. North American agricultural sales declined by 11.7% to $142.5 million, reflecting challenging market conditions in the region.
Capital Allocation & Financial Position
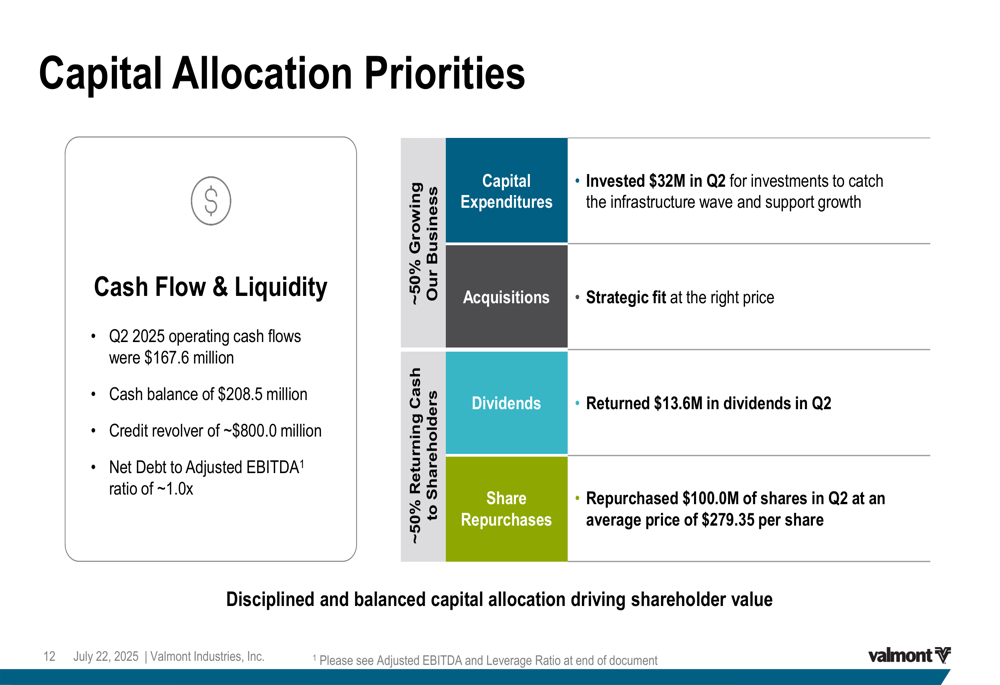
Valmont maintained a balanced approach to capital allocation, dividing resources approximately equally between business growth initiatives and shareholder returns. The company invested $32 million in capital expenditures during Q2, while returning $13.6 million to shareholders through dividends and repurchasing $100 million in shares at an average price of $279.35.
The company reported a strong financial position with a cash balance of $208.5 million and available credit of approximately $800 million. Valmont’s Net Debt to Adjusted EBITDA ratio stands at approximately 1.0x, indicating a conservative leverage profile.
The capital allocation strategy is visualized in this slide:
Financial Outlook & Guidance
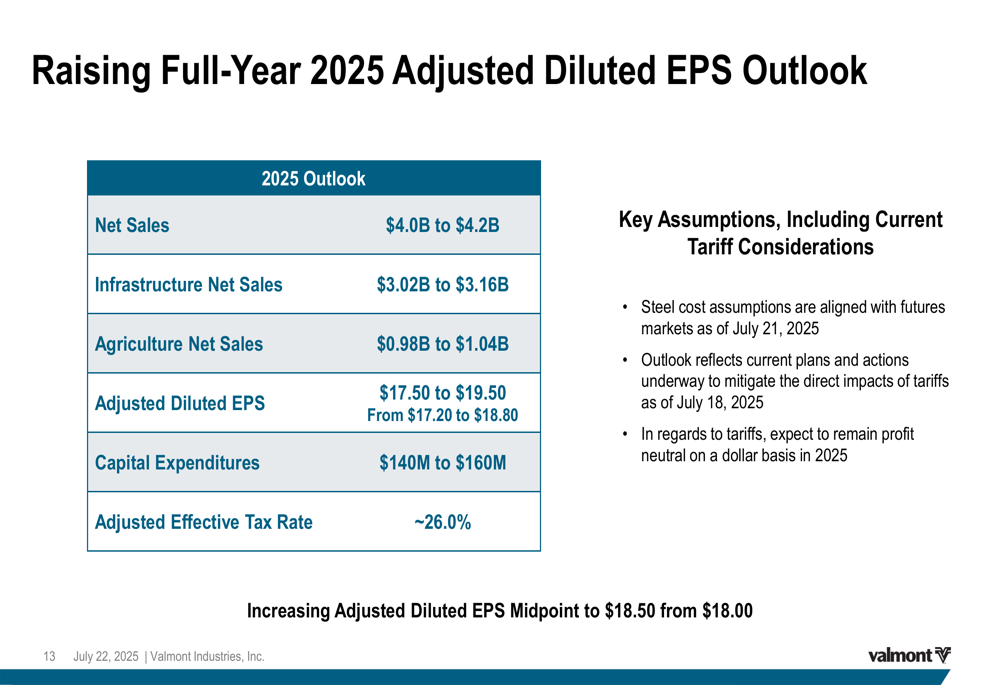
Despite the significant restructuring charges and mixed segment performance, Valmont raised its full-year 2025 adjusted diluted EPS outlook to $17.50-$19.50, up from the previous guidance of $17.20-$18.80. The company maintained its net sales projection of $4.0 billion to $4.2 billion.
Management expressed confidence in navigating potential challenges related to steel costs and tariffs, noting that their outlook reflects current plans to mitigate these impacts while remaining profit neutral on a dollar basis in 2025.
The updated guidance is detailed in the following slide:
Forward-Looking Statements
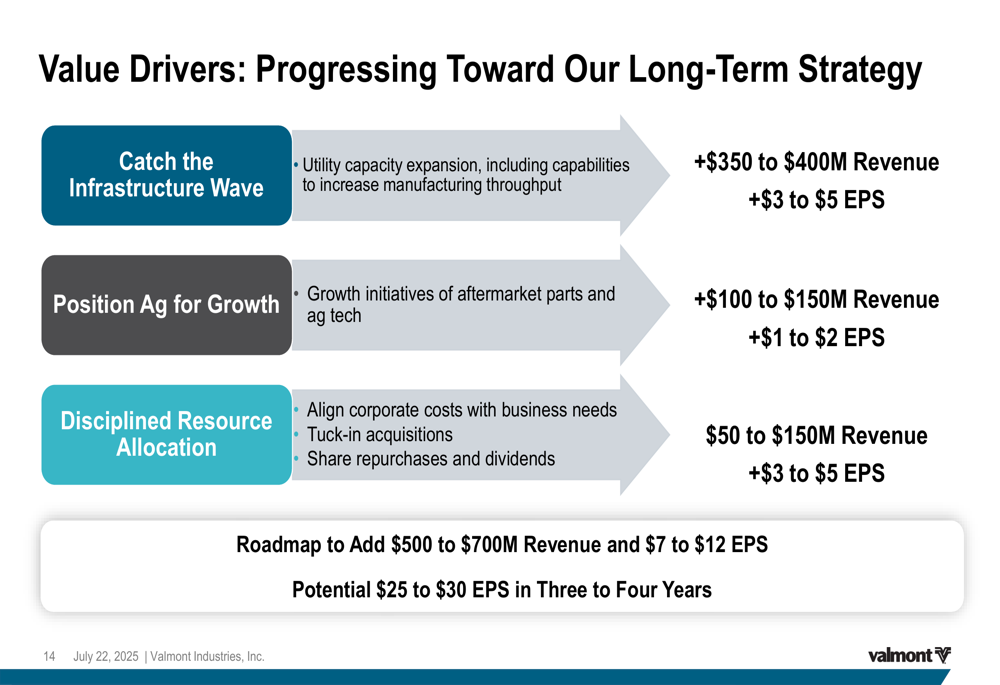
Looking beyond 2025, Valmont outlined an ambitious growth strategy centered on three key pillars: utility capacity expansion, agricultural aftermarket parts and technology initiatives, and disciplined resource allocation. The company projects these initiatives could add $500-$700 million in revenue and $7-$12 in EPS over the coming years, potentially driving EPS to $25-$30 within three to four years.
The utility segment is expected to be the primary growth driver, with management projecting $350-$400 million in additional revenue and $3-$5 in EPS contribution from this segment alone. This aligns with the company’s strategic focus on capitalizing on infrastructure investment trends.
As illustrated in this forward-looking roadmap:
Valmont’s Q2 2025 presentation reveals a company in transition, making difficult strategic decisions to exit underperforming businesses while investing heavily in areas of perceived strength and growth potential. While current financial results show only modest growth, management’s confidence in future prospects is evident in their raised guidance and ambitious long-term projections.
Full presentation:
This article was generated with the support of AI and reviewed by an editor. For more information see our T&C.