German construction sector still in recession, civil engineering only bright spot

Introduction & Market Context
Verisk Analytics Inc . (NASDAQ:VRSK) released its first quarter 2025 earnings presentation on May 7, 2025, showcasing strong financial performance driven primarily by robust subscription revenue growth. The data analytics provider, which focuses on solutions for the insurance industry, reported solid gains across key metrics despite a challenging environment for transactional revenue.
The company’s stock has been trading near its 52-week high, with recent premarket activity showing a 0.98% increase to $299.10. This positive market response follows a period of volatility after the company’s Q4 2024 results, which saw the stock dip despite revenue growth.
Quarterly Performance Highlights
Verisk reported Q1 2025 revenue of $753 million, representing a 7.9% increase on an organic constant currency (OCC) basis compared to the same period last year. This growth was primarily driven by the company’s subscription-based offerings, which now account for 83% of total revenue.
As shown in the following financial summary from the presentation:
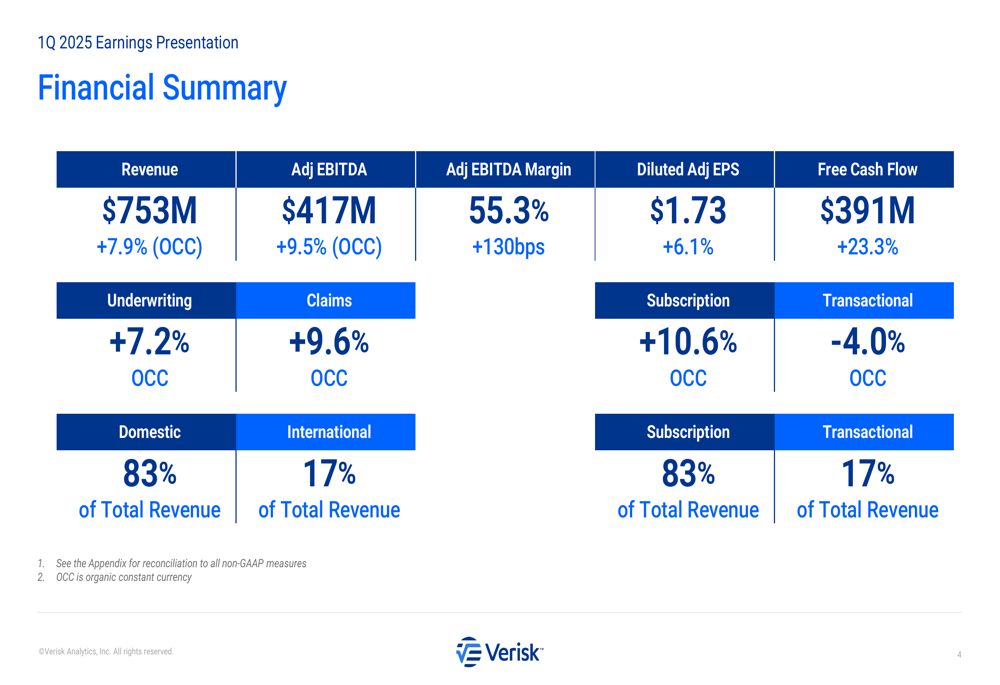
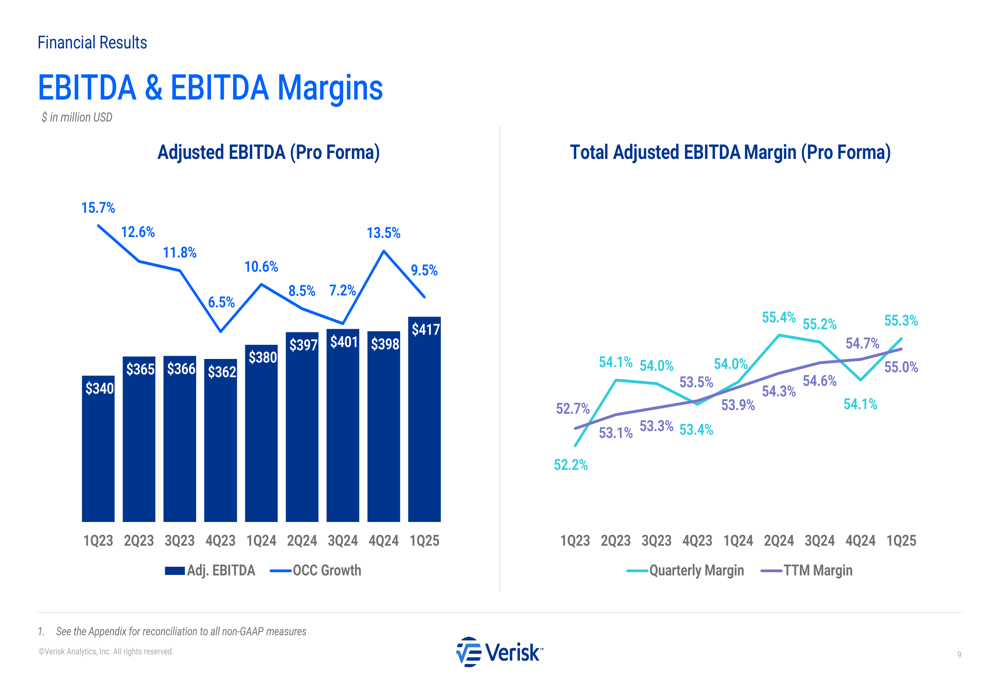
The company achieved adjusted EBITDA of $417 million, up 9.5% OCC year-over-year, with margins expanding to 55.3%, an improvement of 130 basis points. Diluted adjusted EPS reached $1.73, a 6.1% increase, while free cash flow surged by 23.3% to $391 million.
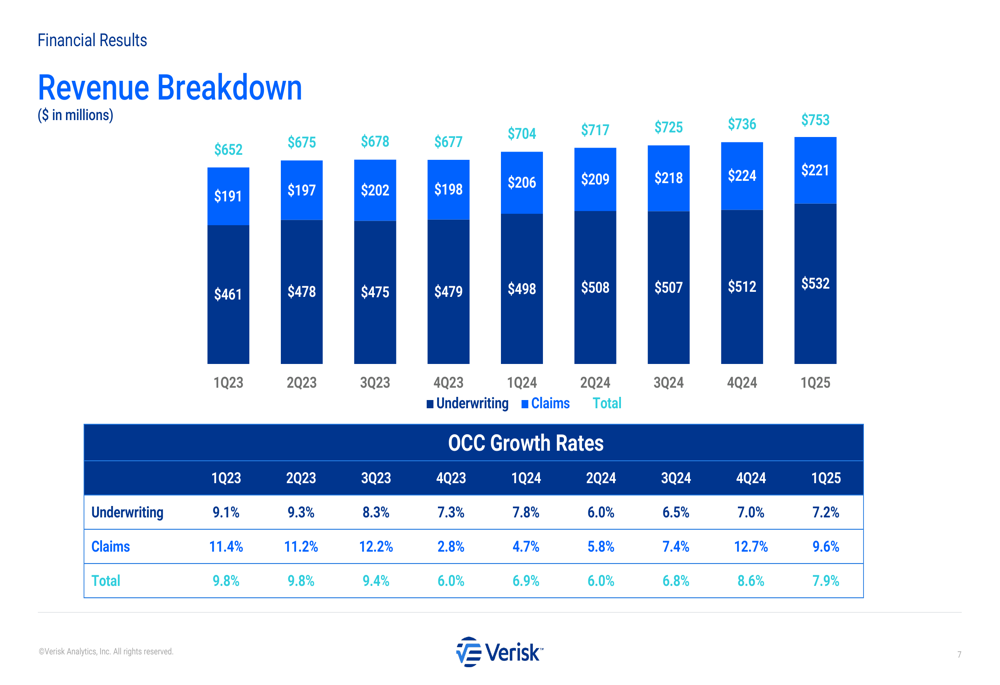
Breaking down performance by business segment, the Underwriting division grew by 7.2% OCC, while the Claims segment delivered even stronger growth at 9.6% OCC. This segment-level performance is illustrated in the revenue breakdown chart:
Detailed Financial Analysis
A closer examination of Verisk’s financial results reveals the stark contrast between subscription and transactional revenue performance. While subscription revenue grew by an impressive 10.6%, transactional revenue declined by 4.0% in the quarter.
The following chart illustrates this divergence in growth rates over recent quarters:
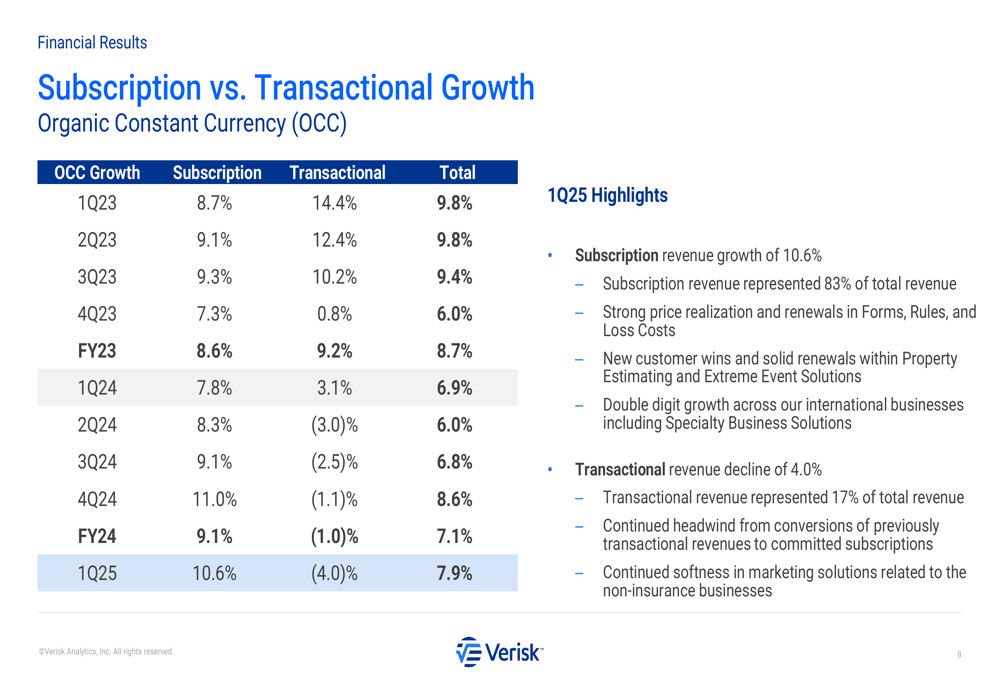
This trend highlights Verisk’s strategic focus on building recurring revenue streams, which provide greater stability and predictability. The company’s subscription-based model has shown accelerating growth in recent quarters, with the 10.6% increase in Q1 2025 representing the second consecutive quarter of double-digit growth.
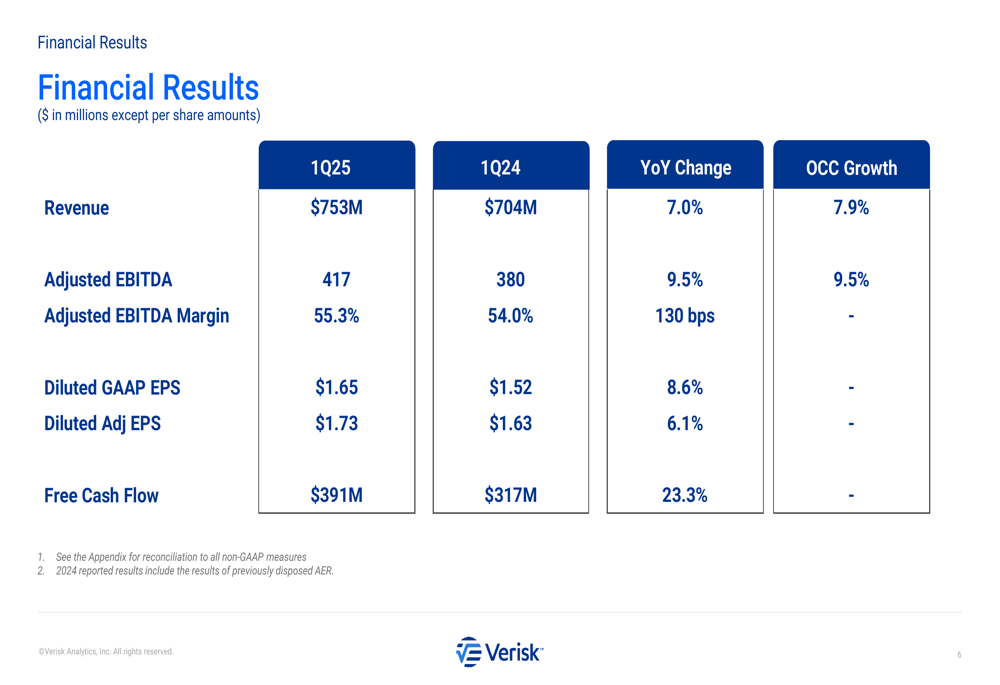
The financial results comparison between Q1 2025 and Q1 2024 provides additional context for the company’s performance:
Verisk has also demonstrated consistent improvement in profitability metrics. The company’s adjusted EBITDA margin has shown steady expansion over time, reaching 55.3% on a trailing twelve-month basis in Q1 2025, up from 54.3% a year earlier.
The following chart illustrates this margin expansion trend:
Capital Structure and Shareholder Returns
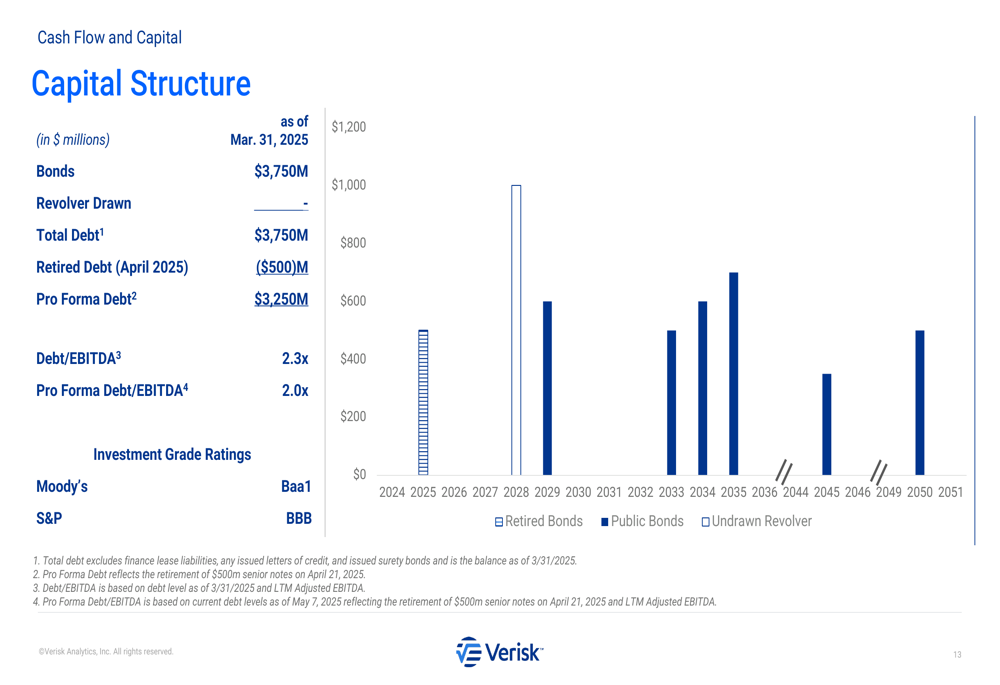
Verisk continued to focus on optimizing its capital structure and returning value to shareholders during the quarter. The company issued $700 million of 5.25% notes due in 2035 and subsequently retired $500 million of 4.0% senior notes in April 2025.
These capital actions have strengthened Verisk’s balance sheet, with pro forma debt-to-EBITDA ratio improving to 2.0x, down from 2.3x. The company maintains investment-grade credit ratings of Baa1 from Moody’s and BBB from S&P.
The debt maturity schedule below shows the company’s well-structured debt profile:
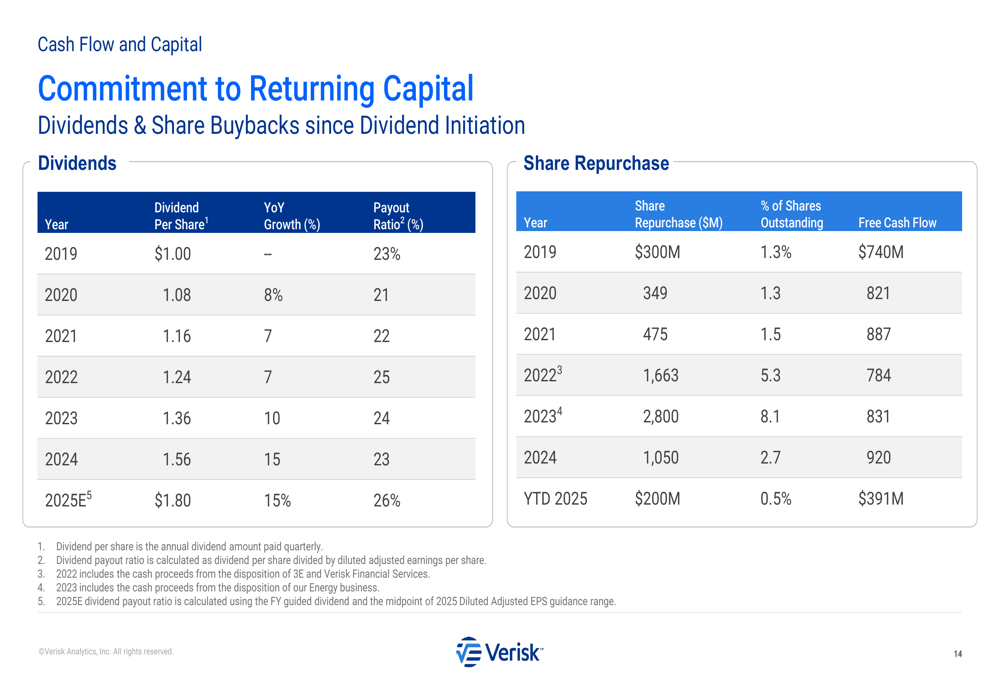
Verisk returned a total of $263 million to shareholders during the quarter, consisting of $200 million in share repurchases through an accelerated share repurchase (ASR) program and $63 million in dividends ($0.45 per share). The company has demonstrated a consistent commitment to increasing shareholder returns, as shown in the following chart:
Forward-Looking Statements
Looking ahead, Verisk reiterated its guidance for 2025, projecting revenue between $3,030 million and $3,080 million, representing organic constant currency growth of 6.0% to 8.0%. The company expects adjusted EBITDA of $1,670 million to $1,720 million, with margins between 55.0% and 55.8%.
The detailed 2025 outlook is presented below:
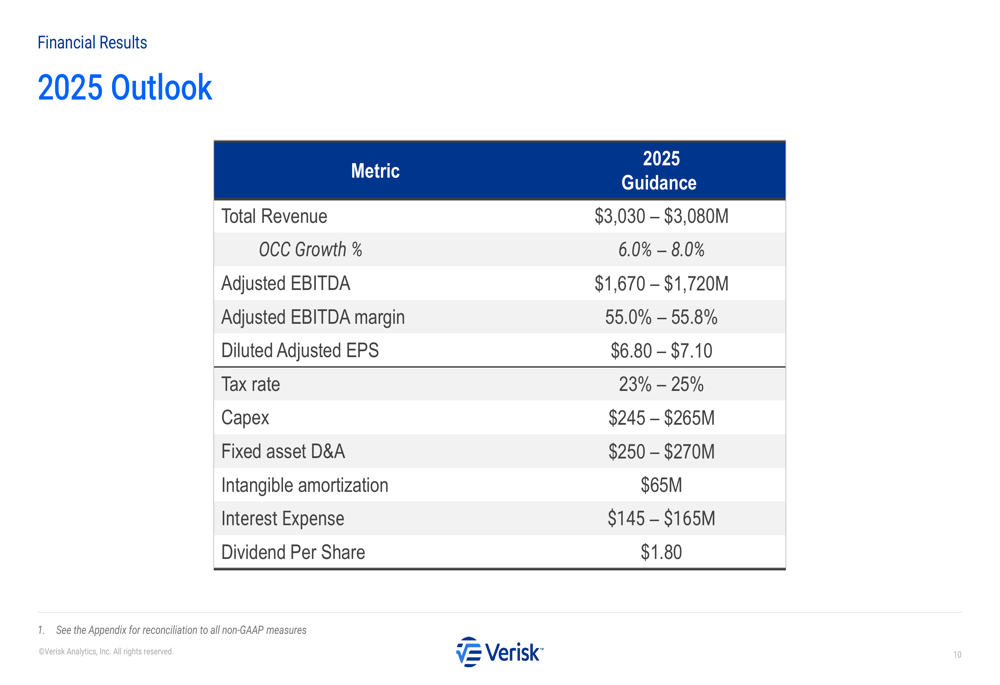
Diluted adjusted EPS is projected to be between $6.80 and $7.10, while capital expenditures are expected to range from $245 million to $265 million. The company also anticipates a dividend per share of $1.80 for the full year, representing a 15% increase from 2024.
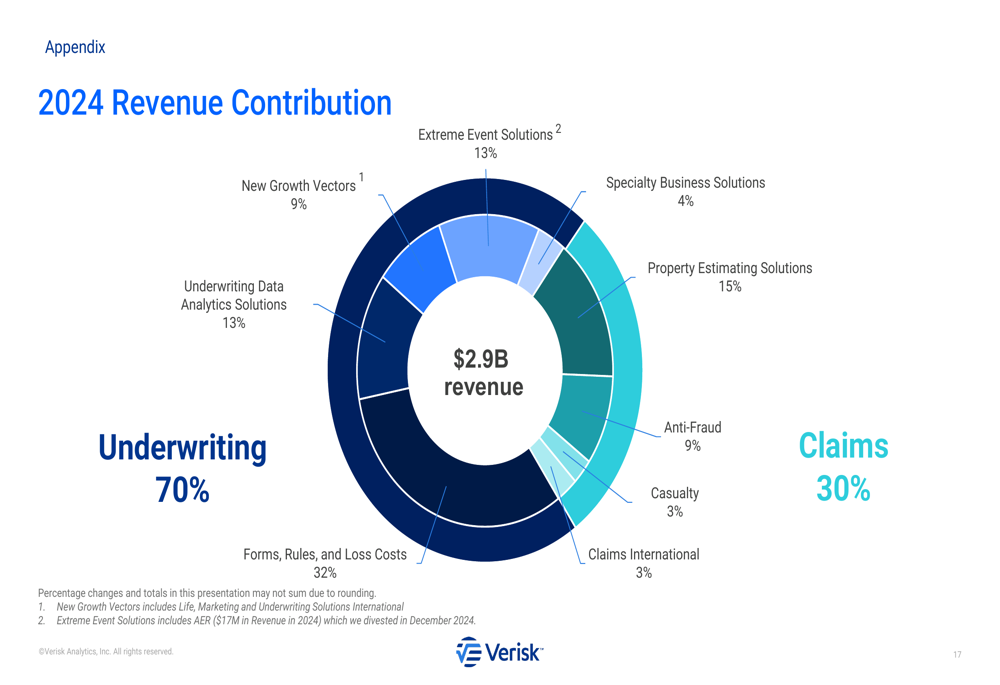
Verisk’s business model remains heavily focused on the insurance industry, with revenue contribution split between Underwriting (70%) and Claims (30%) segments. Within these segments, the company offers a diverse portfolio of solutions, as illustrated in the revenue contribution breakdown:
The company’s continued investment in data and technology solutions for the insurance industry positions it well for sustained growth, despite potential challenges in transactional revenue streams and regional insurance markets, particularly in California where wildfire risks have created market disruptions.
With its strong subscription revenue growth, expanding margins, and disciplined capital allocation strategy, Verisk appears well-positioned to deliver on its 2025 financial targets while continuing to return capital to shareholders through dividends and share repurchases.
Full presentation:
This article was generated with the support of AI and reviewed by an editor. For more information see our T&C.