Intel stock extends gains after report of possible U.S. government stake

Introduction & Market Context
Vidrala SA (BME:VID) presented its Q1 2025 results on April 29, showing a mixed financial performance characterized by declining sales but improved profitability and a strengthened balance sheet. The glass packaging manufacturer’s stock traded slightly down by 0.41% following the presentation, closing at €96.50.
The company’s results reflect ongoing challenges in the glass packaging market, with varying performance across its regional business units. While sales declined across all regions, Vidrala managed to improve its operating margins and significantly reduce debt, demonstrating effective cost management despite revenue headwinds.
Quarterly Performance Highlights
Vidrala reported Q1 2025 sales of €372.5 million, representing an 11.2% decline from the same period last year, or a 6.6% decrease at constant currency and comparable scope. Despite this revenue challenge, the company delivered EBITDA of €104.6 million, which was down 4.8% on a reported basis but up 1.4% at constant currency and comparable scope.
As shown in the following key financial metrics:
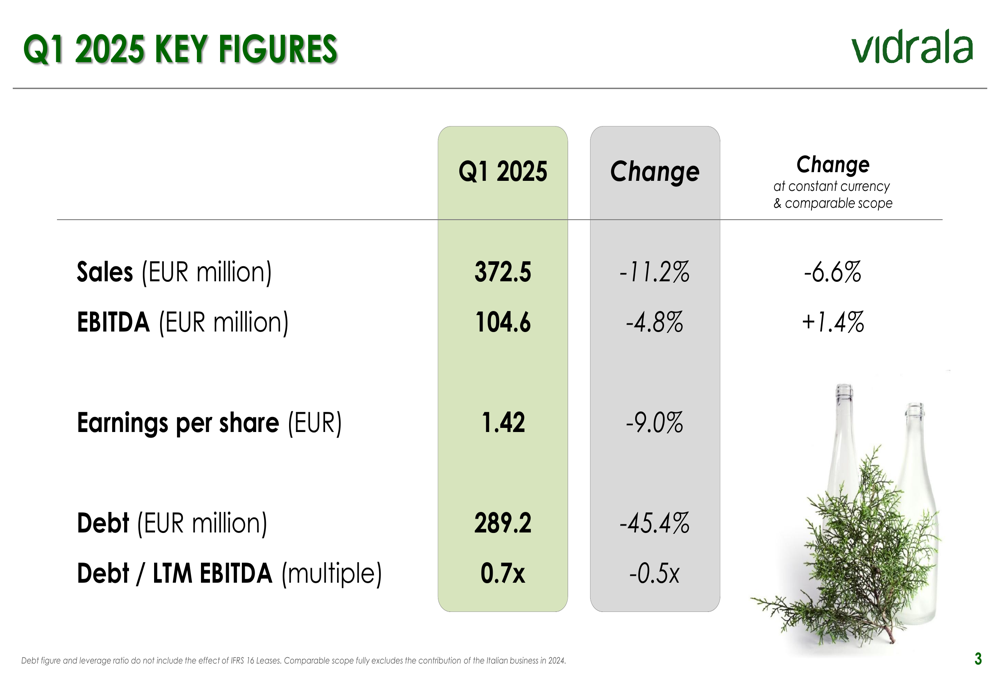
The company’s earnings per share decreased by 9.0% to €1.42, reflecting the overall sales decline. However, Vidrala made significant progress in strengthening its balance sheet, with net debt falling 45.4% to €289.2 million, resulting in a debt-to-EBITDA ratio of 0.7x, an improvement of 0.5x compared to the previous year.
One of the most notable achievements in the quarter was the expansion of operating margins, which increased from 26.2% in Q1 2024 to 28.1% in Q1 2025, representing a substantial 190 basis point improvement. This margin expansion demonstrates Vidrala’s ability to optimize operations and control costs despite top-line pressures.
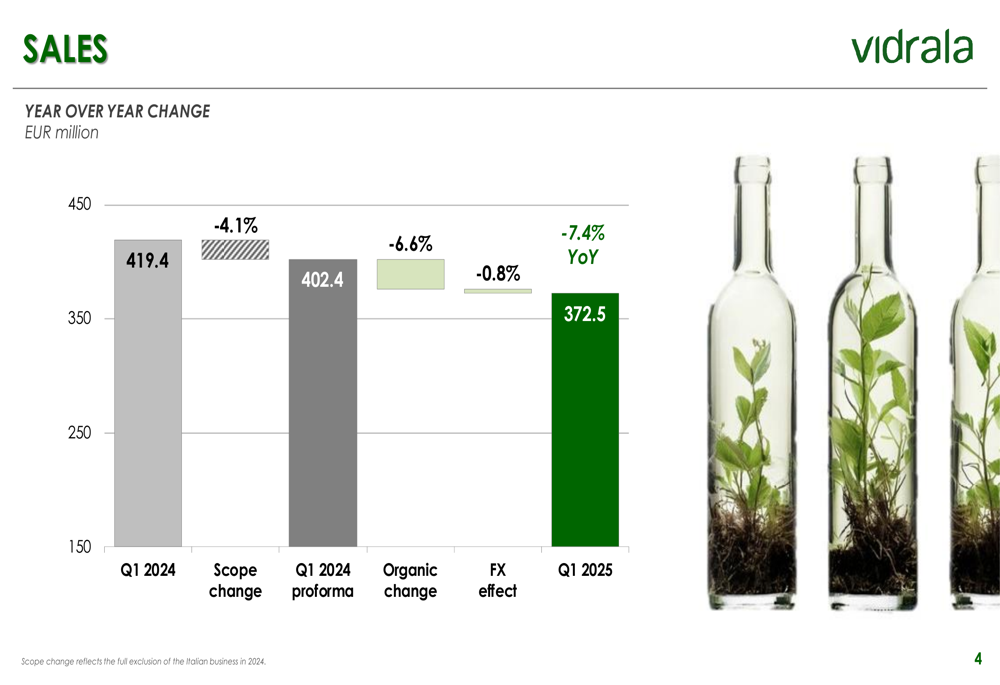
The sales decline can be better understood by examining the contributing factors:
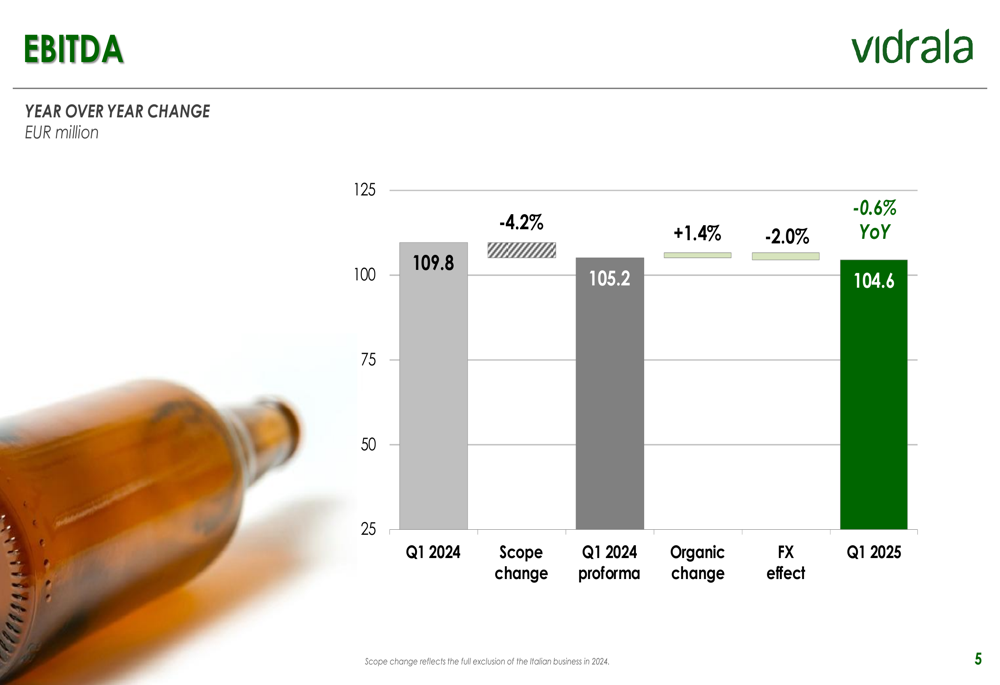
Similarly, the EBITDA performance breakdown reveals how the company managed to achieve organic growth despite currency headwinds:
Regional Business Unit Analysis
Vidrala’s performance varied significantly across its three main business units. The company’s presentation revealed that Iberia & Rest of EU operations demonstrated resilience with an 11% increase in EBITDA despite a 4% decline in sales. Meanwhile, UK & Ireland operations experienced an 8% sales decline and a 4% drop in EBITDA, while Brazil showed the most significant challenges with a 17% sales decline and a 21% reduction in EBITDA.
The following chart illustrates these regional differences in performance:
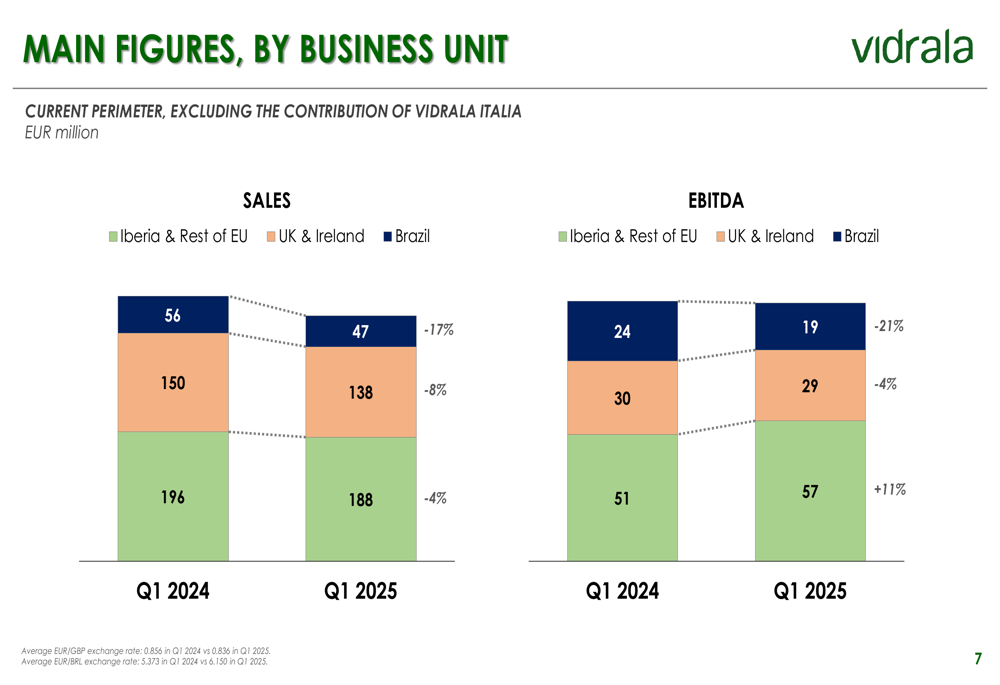
This regional disparity suggests that Vidrala faces different market dynamics and challenges across its geographic footprint. The strong performance in Iberia appears to be driving the overall margin improvement, offsetting weaknesses in other regions, particularly Brazil.
Financial Position & Debt Evolution
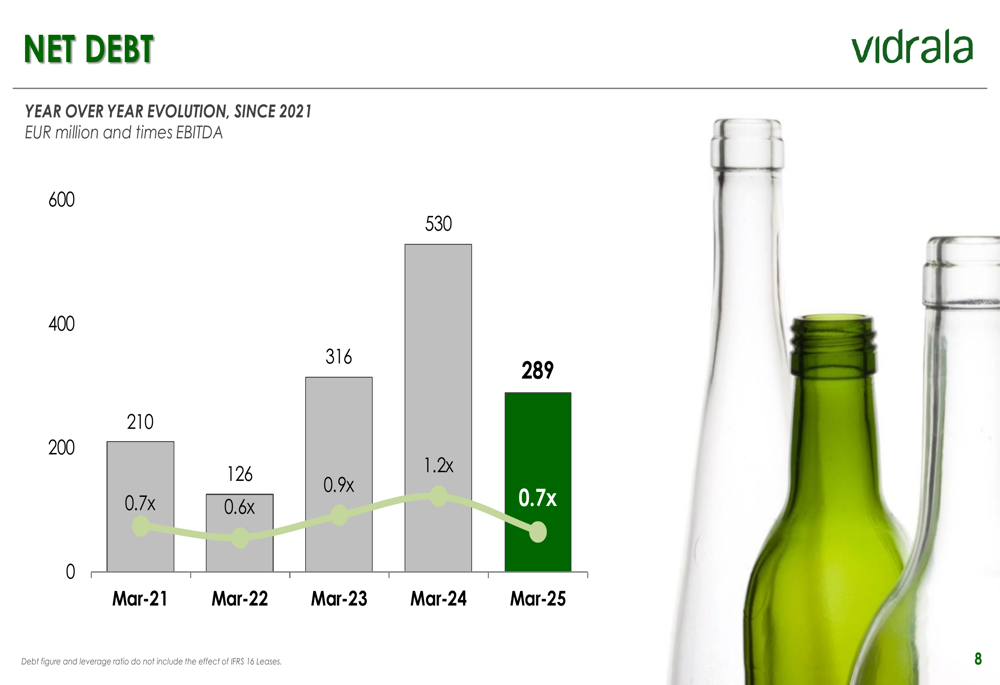
Vidrala has maintained its focus on financial discipline, significantly reducing its debt position compared to the previous year. The company’s net debt of €289.2 million represents a leverage ratio of 0.7x EBITDA, down from 1.2x in March 2024, reflecting strong cash generation and effective capital management.
The company highlighted its progress toward becoming a more agile and diversified business with a strong financial position to support ambitious investments. As summarized in the presentation:
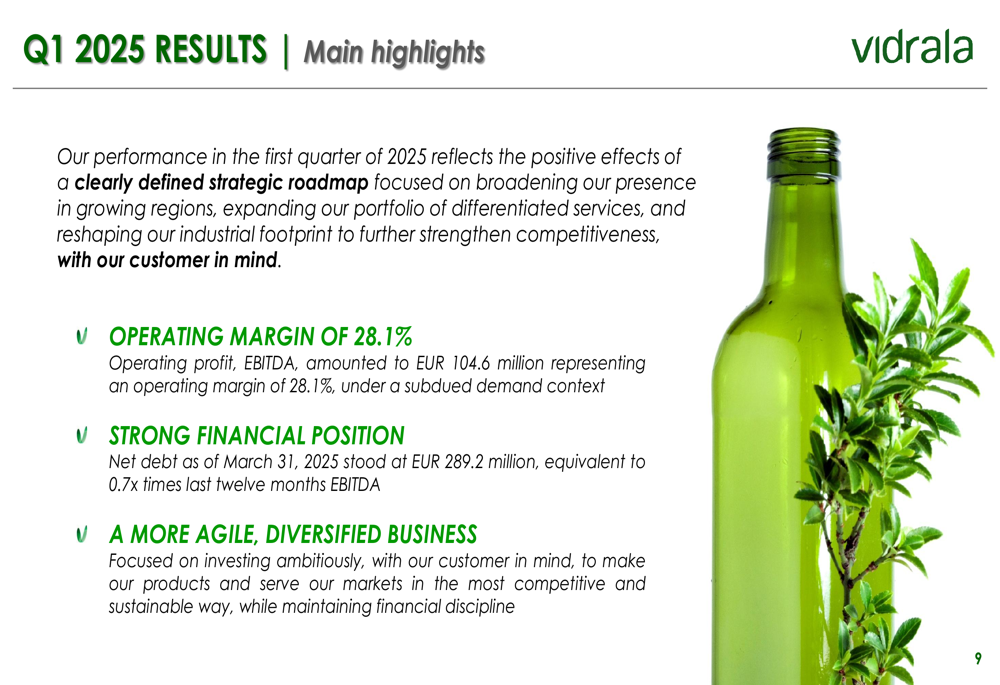
This improved financial position provides Vidrala with greater flexibility to pursue strategic initiatives and navigate market challenges. The debt reduction continues a multi-year trend of prudent financial management:
Forward Guidance & Outlook
Looking ahead, Vidrala provided a positive outlook for the full year 2025, maintaining its guidance for EBITDA to exceed €450 million, compared to €449 million in FY 2024. The company also expects to generate approximately €200 million in free cash flow, slightly above the €192 million achieved in FY 2024.
The outlook suggests that Vidrala expects to maintain its improved profitability levels despite ongoing revenue challenges:
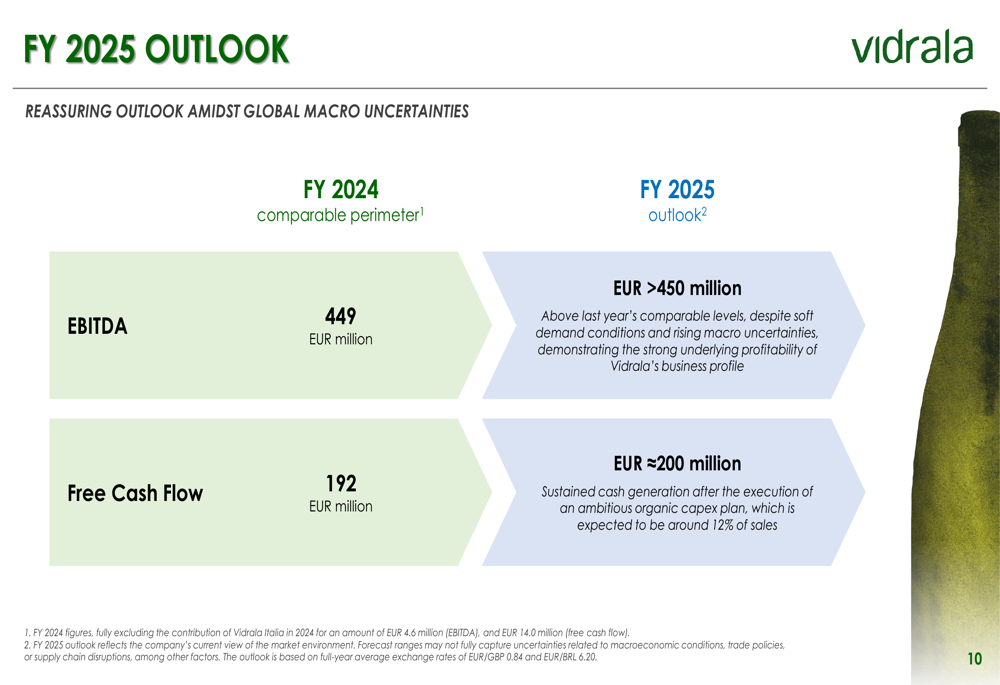
This guidance aligns with the company’s statements from its Q4 2024 earnings, where management indicated that EBITDA would remain at similar or higher levels in 2025. The consistent free cash flow projection of around €200 million also reinforces previous statements by Corporate Finance Director Inigo Mendieta that "Our free cash flow generation of around €200 million for 2025 is safe."
While Vidrala faces challenges in certain markets, particularly Brazil, the company’s focus on operational efficiency, margin improvement, and financial discipline appears to be yielding results. The significant margin expansion and debt reduction demonstrate management’s ability to navigate a challenging revenue environment while positioning the company for future growth opportunities.
Full presentation:
This article was generated with the support of AI and reviewed by an editor. For more information see our T&C.