Asahi shares mark weekly slide after cyberattack halts production

Virtus Investment Partners (NASDAQ:NYSE:VRTS) shares fell 7.47% on Friday despite reporting sequential improvement in earnings and margins in its Q2 2025 presentation. The asset manager reported adjusted earnings per share of $6.25, up from $5.73 in the previous quarter, while continuing to face challenges with net outflows.
Quarterly Performance Highlights
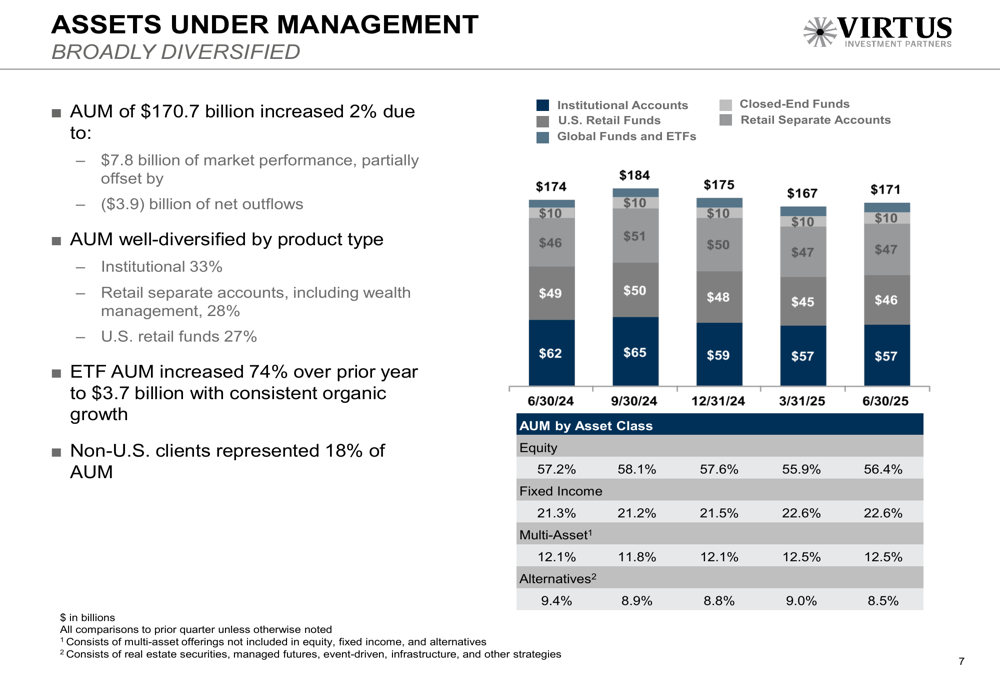
Virtus reported that assets under management (AUM) increased 2% to $170.7 billion, driven by $7.8 billion in market performance, which was partially offset by $3.9 billion in net outflows. However, average AUM decreased 4% to $167.0 billion compared to the previous quarter.
The company’s adjusted operating margin improved to 31.3% from 27.6% in Q1, which had included seasonal expenses. Adjusted earnings per diluted share rose to $6.25 from $5.73 in the prior quarter.
As shown in the following overview of Q2 2025 performance:
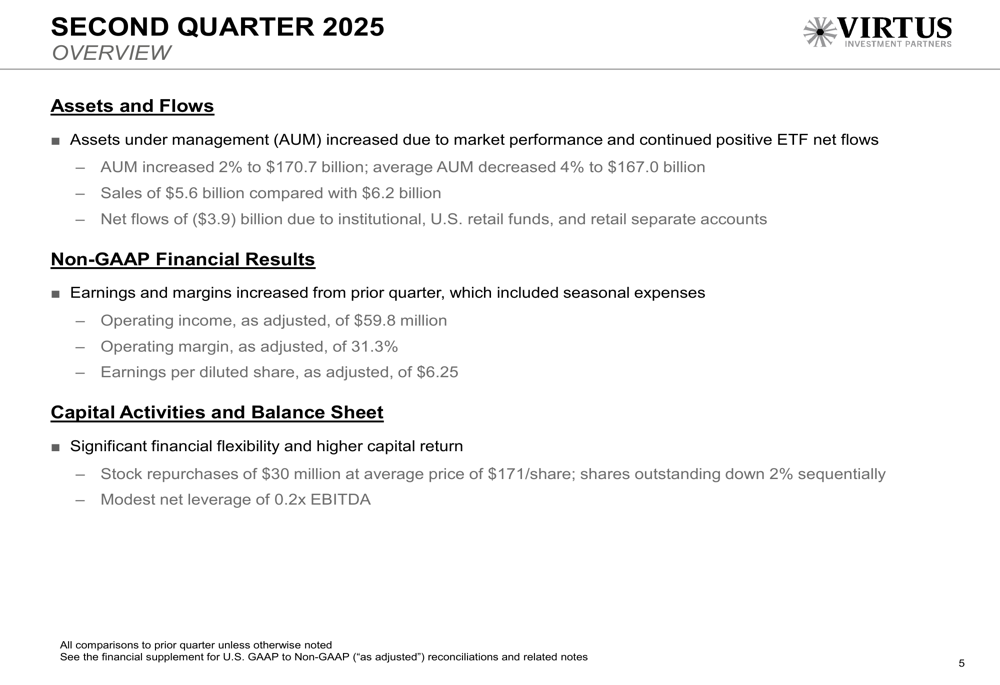
"Our second quarter results reflected improved earnings and margins from the prior quarter, which included seasonal expenses," said George R. Aylward, President and CEO, according to the presentation materials.
Detailed Financial Analysis
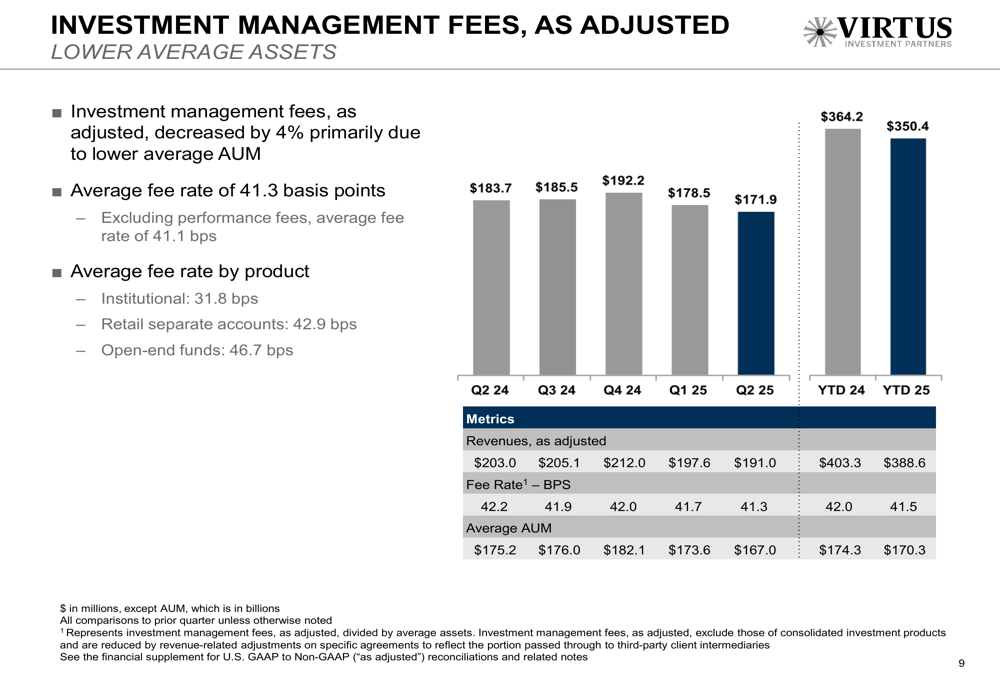
Investment management fees decreased by 4% primarily due to lower average AUM, with the average fee rate holding relatively stable at 41.3 basis points. The company maintained a well-diversified AUM by product type, with institutional accounts representing 33%, retail separate accounts 28%, and U.S. retail funds 27% of total assets.
The following chart illustrates the distribution of assets under management by product type:
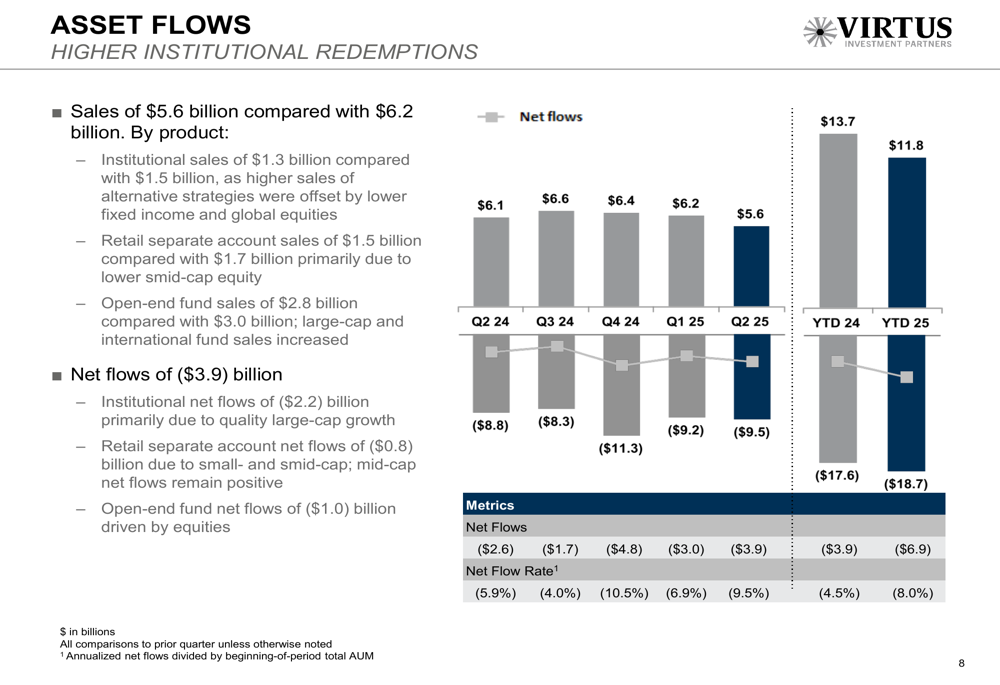
Net outflows remained a challenge at $3.9 billion for the quarter, primarily driven by institutional redemptions, retail separate accounts, and U.S. retail funds. This represents a continuation of the outflow trend seen in previous quarters.
The following chart details the asset flows for the quarter:
Employment expenses declined by $12.2 million from the first quarter due to seasonal items and lower variable incentive compensation. As a percentage of revenues, employment expenses represented 50.9% in Q2 compared to 55.4% in Q1.
Investment management fees by product show the revenue distribution across Virtus’s product lineup:
Strategic Initiatives
Despite the challenges with outflows, Virtus highlighted several strategic growth areas. The company’s ETF assets increased 74% over the prior year to $3.7 billion, indicating success in this growing segment of the market. Additionally, non-U.S. clients now represent 18% of AUM, showing progress in the company’s international expansion efforts.
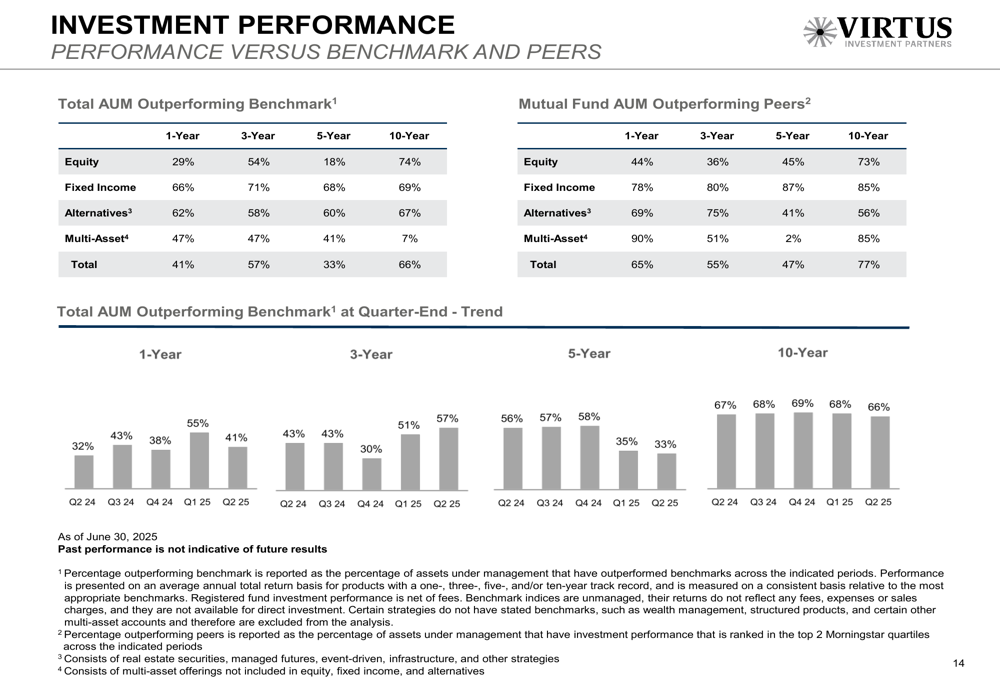
The company’s investment performance versus benchmarks and peers showed mixed results across different asset classes and time periods:
Capital Management and Balance Sheet
Virtus maintained a strong balance sheet with cash and investments of $447 million and low net leverage of 0.2x EBITDA. The company continued its share repurchase program, buying back $30 million of stock at an average price of $171 per share during the quarter, resulting in a 2% sequential decrease in shares outstanding.
The following slide details the company’s capital position and balance sheet highlights:
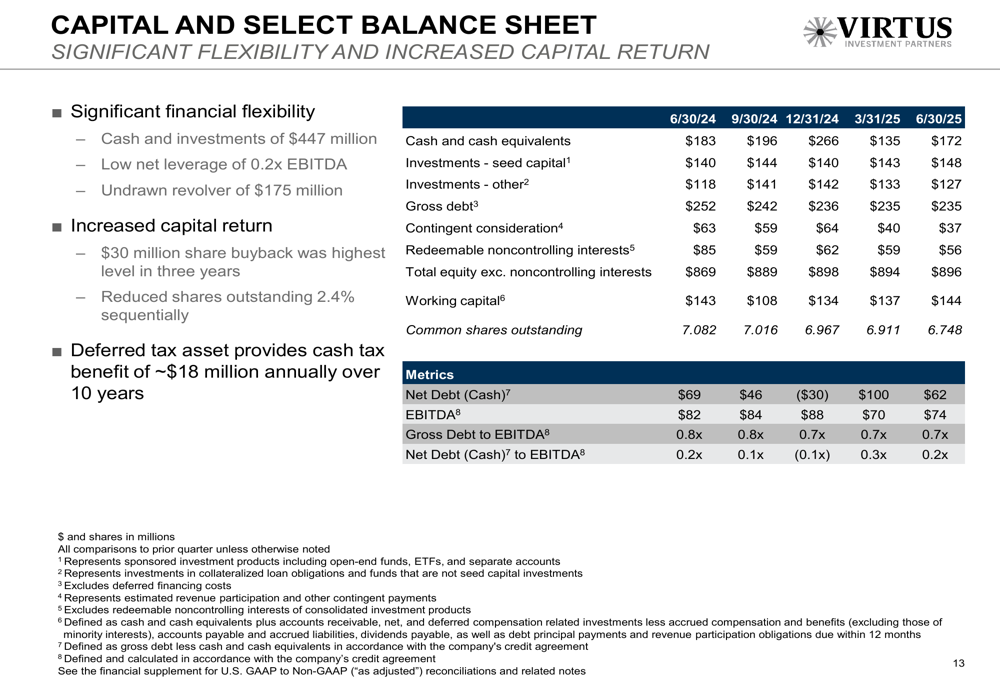
The company’s weighted average diluted shares outstanding declined 3.0% year-to-date due to share repurchases, demonstrating Virtus’s commitment to returning capital to shareholders.
Forward-Looking Statements
Despite the sequential improvement in earnings and margins, investors appeared concerned about the continued net outflows and potential pressure on future revenues. The stock’s 7.47% decline following the presentation suggests the market was looking for more substantial improvement or a clearer path to stemming the outflows.
The earnings presentation follows Virtus’s Q1 results, which saw the company miss EPS forecasts despite revenue exceeding expectations. The Q2 adjusted EPS of $6.25 represents a significant improvement from the Q1 figure of $5.73 that fell short of analyst expectations.
With its strong balance sheet and low leverage, Virtus maintains financial flexibility to navigate market challenges while continuing to invest in growth areas like ETFs and international expansion. However, the persistent net outflows remain a key challenge for the asset manager in an increasingly competitive industry environment.
Full presentation:
This article was generated with the support of AI and reviewed by an editor. For more information see our T&C.