Street Calls of the Week

Introduction & Market Context
VNV Global AB (VNV) presented its Q2 2025 investor update on July 17, showcasing a portfolio increasingly characterized by profitability and growth across key sectors. The investment company, which focuses on network-effect businesses, reported a net asset value (NAV) of $598 million, representing a 5.6% increase in USD terms from the previous quarter.
Trading at 18.71 SEK per share as of the presentation date, VNV Global continues to trade at a significant discount to its NAV of 43.4 SEK per share, representing a 61% discount to the underlying asset value.
Quarterly Performance Highlights
VNV Global’s portfolio demonstrated improved profitability metrics, with 81% of investments now EBITDA positive, up from 62% in Q2 2024. This shift toward profitability represents a key milestone in the company’s investment strategy.
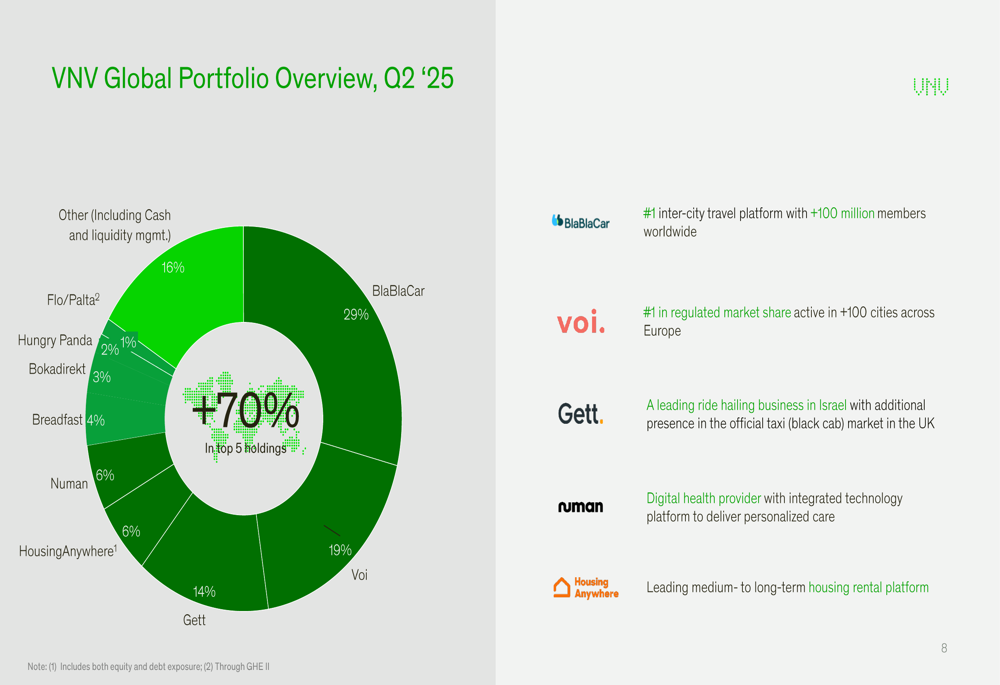
The company’s NAV stood at $598.3 million (SEK 5,683 million) or $4.57 per share (SEK 43.39 per share) as of June 30, 2025. The portfolio remains concentrated, with the top five holdings representing over 70% of total value.
As shown in the following portfolio breakdown:
VNV’s investment strategy continues to focus on businesses with strong network effects across various stages of development. The portfolio is heavily weighted toward mobility (64%), followed by marketplace (20%), digital health (8%), and other sectors (8%).
The increasing profitability across the portfolio is clearly illustrated in this comparative chart:
Portfolio Company Updates
BlaBlaCar, VNV’s largest holding at 29% of the portfolio, closed 2024 with nearly 100 million passengers and announced a €100 million financing round. The company also acquired Obilet and reported strong performance in early 2025, exceeding budget targets for both revenue and profitability.
The company’s value proposition and key metrics are detailed here:
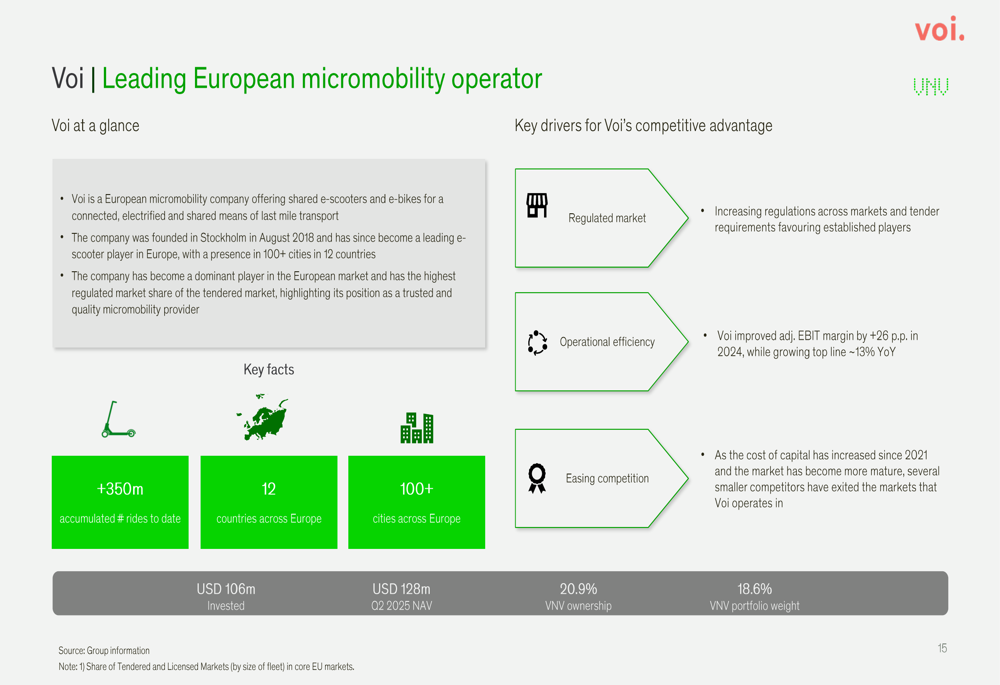
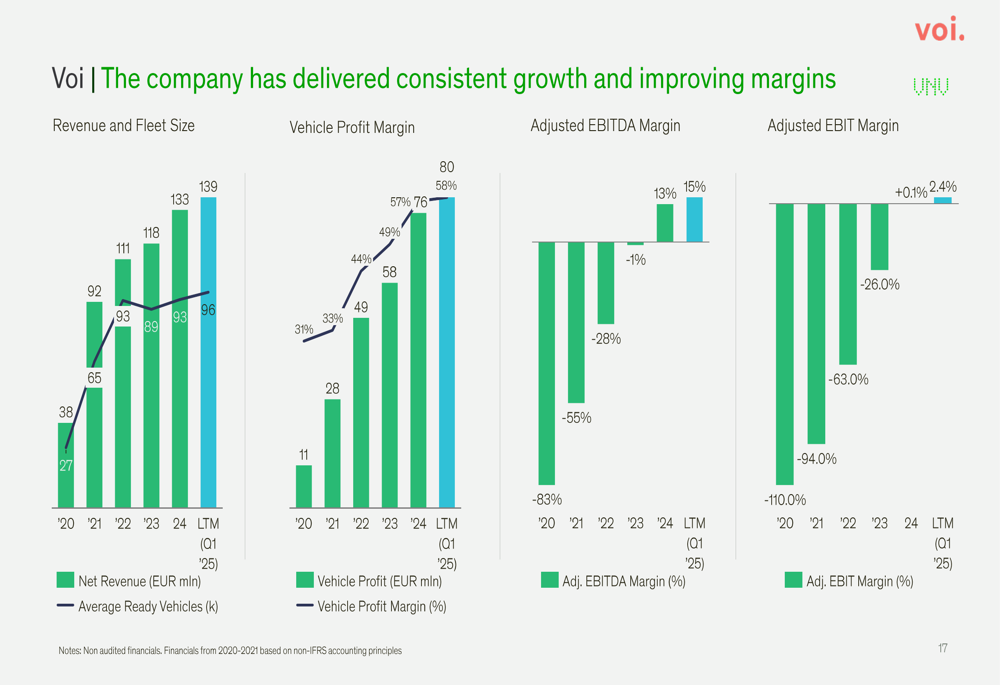
Voi, representing 19% of the portfolio, achieved its first profitable year in 2024 with adjusted EBITDA of €17.2 million. The micromobility operator reported LTM net revenues of €138.6 million as of Q1 2025, with adjusted EBITDA of €21.2 million. The company also secured €50 million through a 4-year bond with a 6.75% spread on EURIBOR.
Voi’s recent developments and geographical presence are shown below:
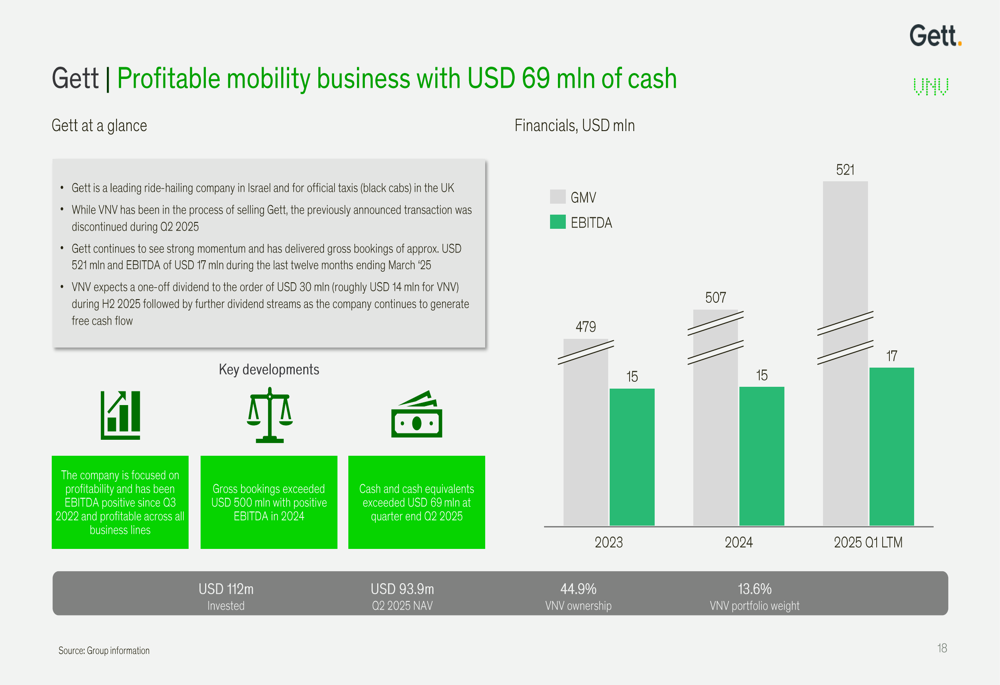
Gett, VNV’s third-largest holding at 14% of the portfolio, delivered gross bookings of approximately $521 million and EBITDA of $17 million for the twelve months ending March 2025. The company has $69 million in cash and plans a one-off dividend of approximately $30 million in H2 2025, with VNV expected to receive around $14 million.
The company’s performance metrics are illustrated here:
Numan, a digital health platform representing 5.6% of VNV’s portfolio, has evolved from a men’s health focus to a leading unisex healthcare provider. The company more than doubled its revenue to approximately $90 million in 2024 and management is guiding for around 150% growth this year.
Numan’s growth trajectory and product offerings are detailed below:
Strategic Positioning
VNV Global maintains a stage-agnostic investment approach, making investments from seed stage to late-stage growth. The company’s permanent capital structure allows for long holding periods, which has historically led to significant value appreciation.
The company has a strong track record of successful exits, including Tinkoff Bank (42% IRR, 8x multiple), Avito (37% IRR, 34x multiple), and Hemnet (50% IRR, 8x multiple). This exit history demonstrates VNV’s ability to identify and nurture high-potential businesses.
VNV’s NAV has shown consistent growth since 2012, with an IRR of approximately 11.8%. However, the company’s share price has consistently traded at a discount to NAV, creating a potential opportunity for investors who believe in the underlying value of the portfolio.
Forward-Looking Statements
Looking ahead, VNV Global is positioned to benefit from the increasing profitability of its portfolio companies. With 81% of investments now EBITDA positive, the company is shifting from a growth-at-all-costs approach to sustainable profitability.
Key developments to watch include:
1. BlaBlaCar’s performance following its €100 million financing round and Obilet acquisition
2. Voi’s continued profitability trajectory after achieving its first profitable year in 2024
3. Gett’s planned dividend distribution of approximately $30 million in H2 2025
4. Numan’s ambitious growth targets of 150% for the current year
The company’s debt position stands at $89.6 million (SEK 6.5 per share), which will need to be managed alongside the growing portfolio. However, with increasing profitability across investments and potential for dividends from portfolio companies like Gett, VNV appears well-positioned to address these obligations.
As mobility and digital health sectors continue to evolve, VNV’s concentrated portfolio in these areas presents both opportunities and risks. The company’s long-term, permanent capital approach allows it to weather market fluctuations while supporting portfolio companies through various growth stages.
Full presentation:
This article was generated with the support of AI and reviewed by an editor. For more information see our T&C.