Tyson Foods to close major Nebraska beef plant amid cattle shortage - WSJ

Introduction & Market Context
Vulcan Materials Company (NYSE:VMC), the nation’s largest producer of construction aggregates, presented its first quarter 2025 results on April 30, highlighting significant margin expansion across its business segments. The company’s stock closed at $245.35 on April 29, with a slight increase in premarket trading following the presentation.
The construction materials giant continues to benefit from its strategic positioning in high-growth markets across the United States, with particular strength in regions receiving substantial infrastructure funding. Following a strong performance in Q4 2024, when the company beat analyst expectations with an EPS of $2.17 against a forecast of $1.78, Vulcan’s Q1 2025 results reinforce its growth trajectory.
Quarterly Performance Highlights
Vulcan Materials reported a 27% increase in adjusted EBITDA to $411 million for Q1 2025, with EBITDA margin expanding by 420 basis points to 25.1%. This impressive performance was primarily driven by pricing power and cost control rather than volume growth.
As shown in the following quarterly highlights:
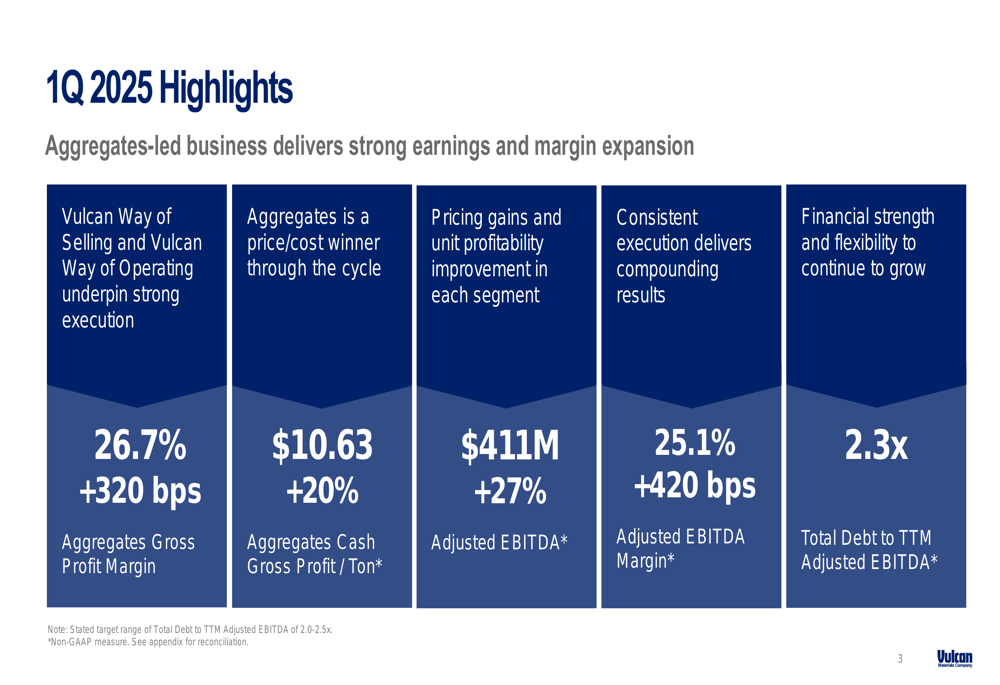
The company’s core aggregates business saw its gross profit margin increase by 320 basis points to 26.7%, while aggregates cash gross profit per ton jumped 20% to $10.63. This strong margin performance came despite a 1% decrease in aggregates volume, demonstrating Vulcan’s ability to drive profitability through pricing and operational efficiency.
The detailed aggregates performance metrics reveal how the company achieved this margin expansion:
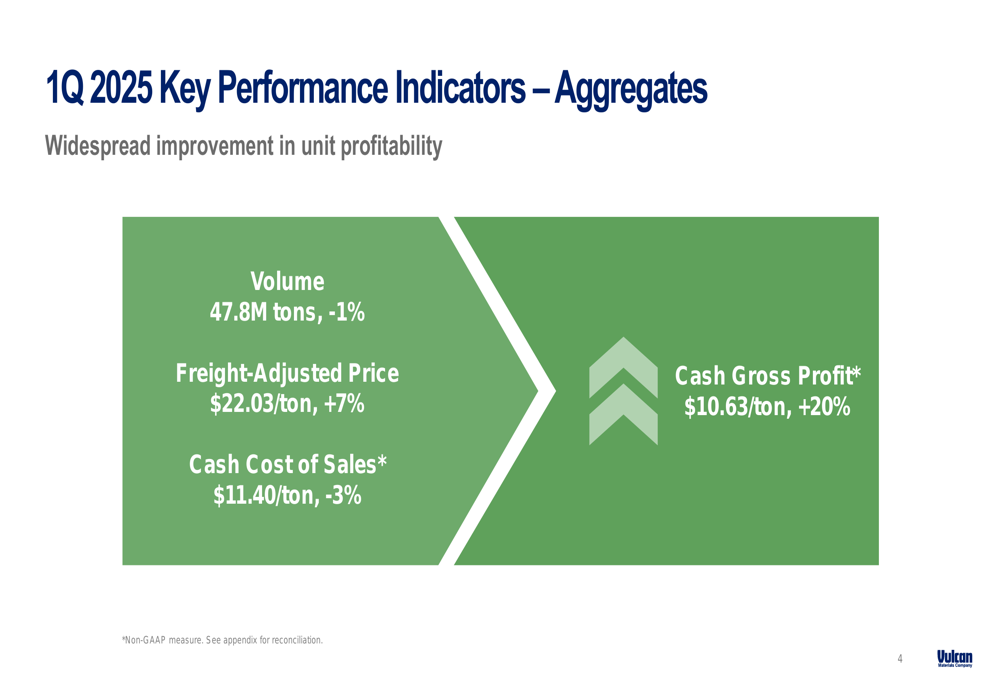
Vulcan’s freight-adjusted price increased by 7% to $22.03 per ton, while cash cost of sales decreased by 3% to $11.40 per ton. This combination of price increases and cost reductions resulted in the 20% increase in cash gross profit per ton.
Detailed Financial Analysis
A key strength for Vulcan has been its consistent pricing power in aggregates, as illustrated in the following chart showing the steady upward trajectory in freight-adjusted pricing over the past two years:
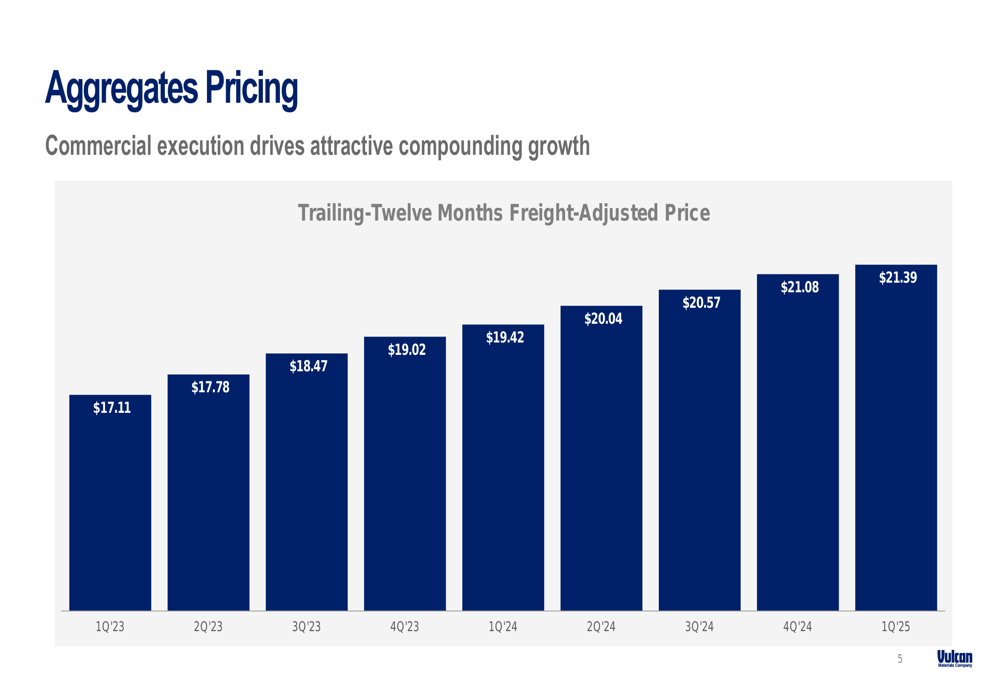
The trailing twelve months freight-adjusted price has increased from $17.11 in Q1 2023 to $21.39 in Q1 2025, representing a 25% increase over this period. This pricing discipline has been crucial to offsetting inflationary pressures and driving margin expansion.
Vulcan’s downstream businesses also delivered impressive results. The asphalt segment achieved a 19% increase in cash gross profit per ton to $7.54, driven by a 4% increase in both volume and average sales price. More notably, the concrete segment saw a remarkable 77% increase in cash gross profit per cubic yard to $20.01, with volume up 15% and average sales price up 4%.
The detailed performance of these downstream segments is shown here:
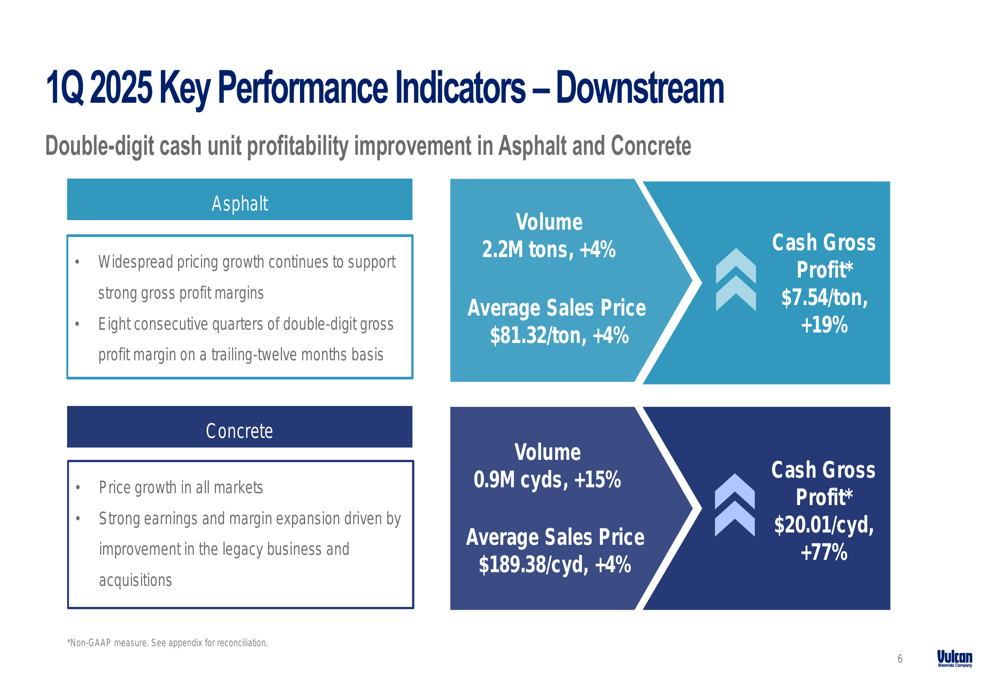
The company highlighted that its asphalt business has now achieved eight consecutive quarters of double-digit gross profit margin on a trailing twelve-month basis. Meanwhile, the concrete segment’s strong earnings and margin expansion were attributed to improvements in both the legacy business and recent acquisitions.
Strategic Initiatives & Market Positioning
Vulcan’s capital allocation strategy continues to focus on both organic growth and strategic acquisitions. During the presentation, the company outlined how it has deployed capital:
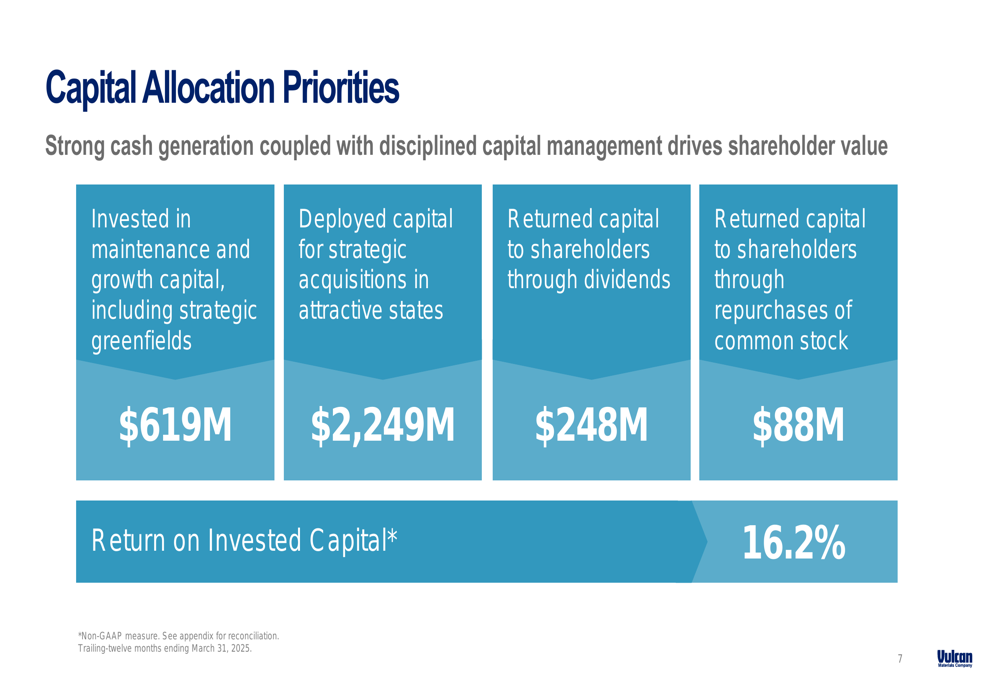
The company invested $619 million in maintenance and growth capital, including strategic greenfield projects, while deploying $2.25 billion for strategic acquisitions in attractive states. It also returned capital to shareholders through $248 million in dividends and $88 million in stock repurchases. These investments have yielded a return on invested capital of 16.2%.
A key competitive advantage for Vulcan is its strategic geographic positioning in high-growth markets across the United States:
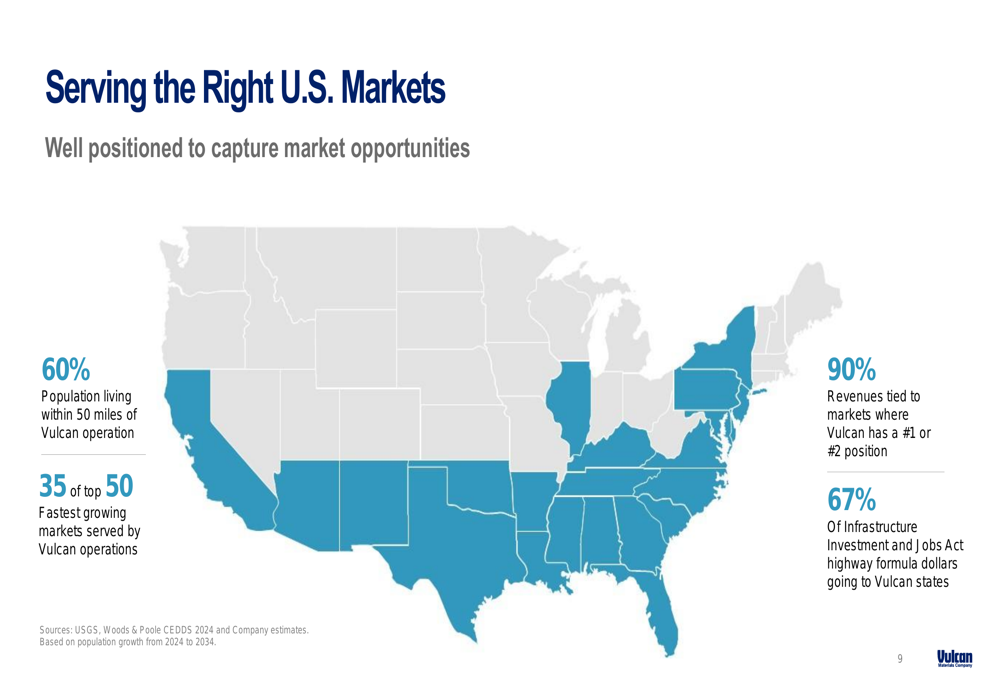
The company highlighted that 60% of the U.S. population lives within 50 miles of a Vulcan operation, and it serves 35 of the top 50 fastest-growing markets in the country. Additionally, 90% of Vulcan’s revenues come from markets where it holds a #1 or #2 position, and 67% of Infrastructure Investment and Jobs Act highway formula dollars are allocated to states where Vulcan operates.
Forward-Looking Statements
Looking ahead, Vulcan Materials reaffirmed its full-year 2025 outlook, projecting adjusted EBITDA of $2.35 to $2.55 billion, which represents a 19% increase at the midpoint compared to 2024:
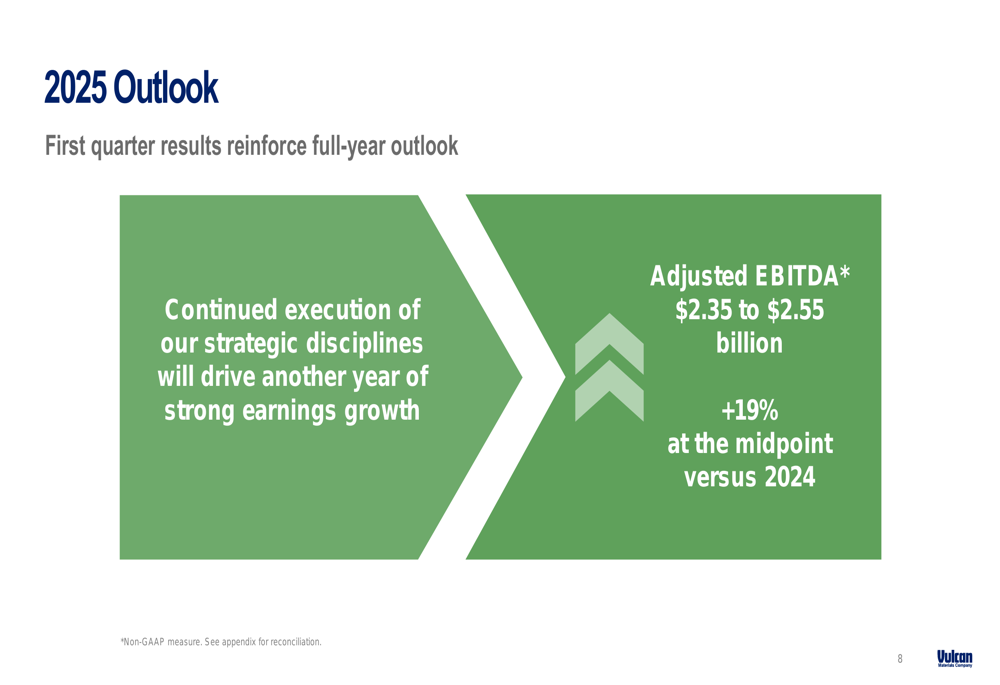
This guidance aligns with the outlook provided in the company’s Q4 2024 earnings call, suggesting confidence in continued strong performance throughout the year. The projection is supported by anticipated 5-7% aggregate price increases and a 3-5% rise in shipments, as mentioned in previous communications.
Management emphasized that the company is well-positioned for continued growth and value creation, citing its durable business model, clear competitive advantages, and strong cash flow generation supported by an investment-grade balance sheet.
With its strategic market positioning and demonstrated ability to expand margins even in a challenging volume environment, Vulcan Materials appears poised to capitalize on infrastructure spending and construction activity across its key markets throughout 2025.
Full presentation:
This article was generated with the support of AI and reviewed by an editor. For more information see our T&C.