Marvell shares spike amid report SoftBank explored possible takeover

Introduction & Market Context
WEX Inc. (NYSE:WEX) reported its third-quarter 2025 results on October 30, showcasing revenue growth across all business segments despite macroeconomic headwinds. The payment solutions provider’s stock closed at $154.06, down 0.37% on the day, though it saw a slight uptick of 0.93% in premarket trading.
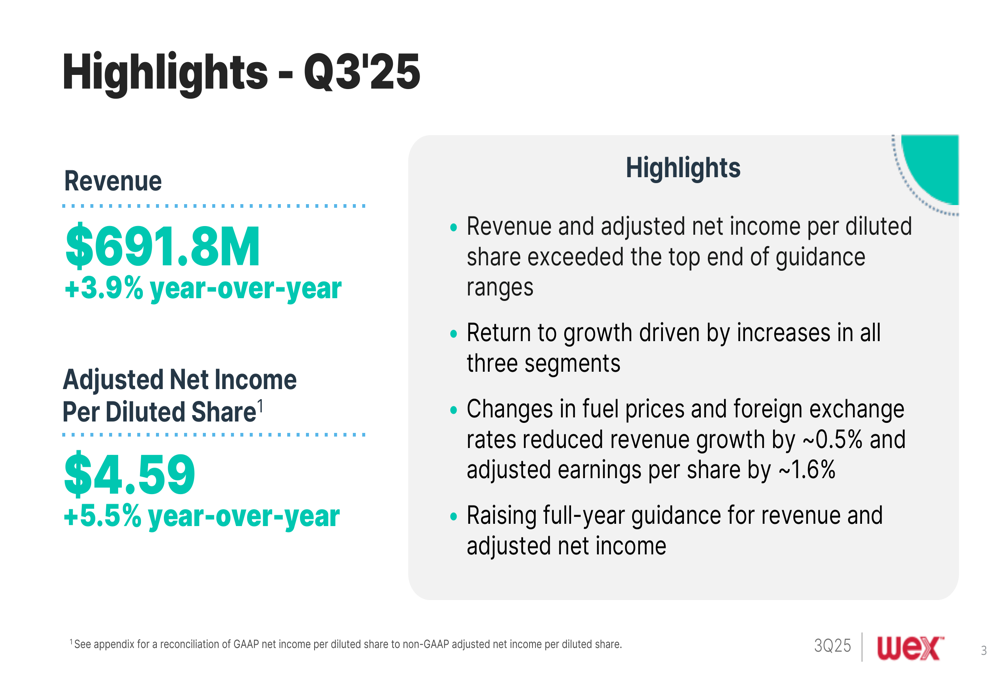
The company’s performance exceeded analyst expectations, with revenue reaching $691.8 million and adjusted earnings per share of $4.59, representing year-over-year growth of 3.9% and 5.5%, respectively. These results come amid ongoing challenges in the trucking sector and pressures from fluctuating fuel prices and foreign exchange rates.
Quarterly Performance Highlights
WEX delivered solid financial results in the third quarter, with both revenue and adjusted net income surpassing guidance. The company highlighted that growth was driven by all segments, though partially offset by fluctuations in fuel prices and foreign exchange rates.
As shown in the following quarterly highlights:
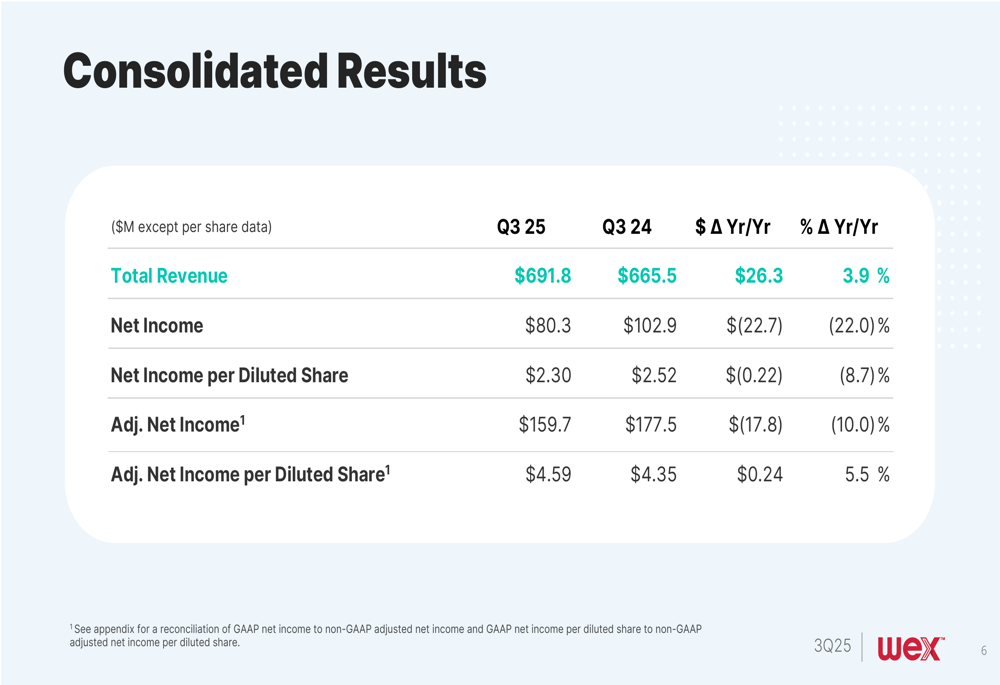
The consolidated financial results provide a more detailed view of WEX’s performance. While total revenue and adjusted net income per diluted share showed positive growth, net income decreased by 22.0% year-over-year to $80.3 million. This decline was primarily due to non-operational factors, as the company’s core business segments continued to perform well.
The following chart illustrates the consolidated financial results:
Segment Analysis
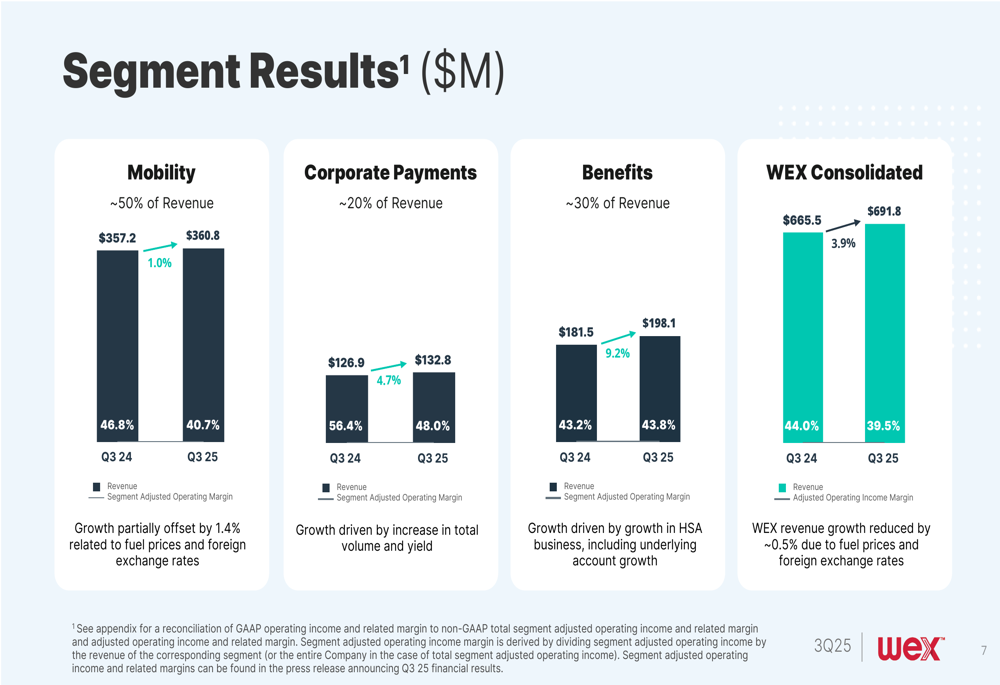
WEX operates through three main business segments: Mobility, Corporate Payments, and Benefits. Each segment contributed to the company’s overall growth in the third quarter, though with varying performance levels.
The Benefits segment led the way with 9.2% revenue growth, driven by expansion in the Health Savings Account (HSA) business. The Corporate Payments segment followed with 4.7% growth, while the Mobility segment showed more modest growth of 1.0%, partially impacted by fuel price fluctuations.
The segment breakdown reveals the relative contribution and performance of each business unit:
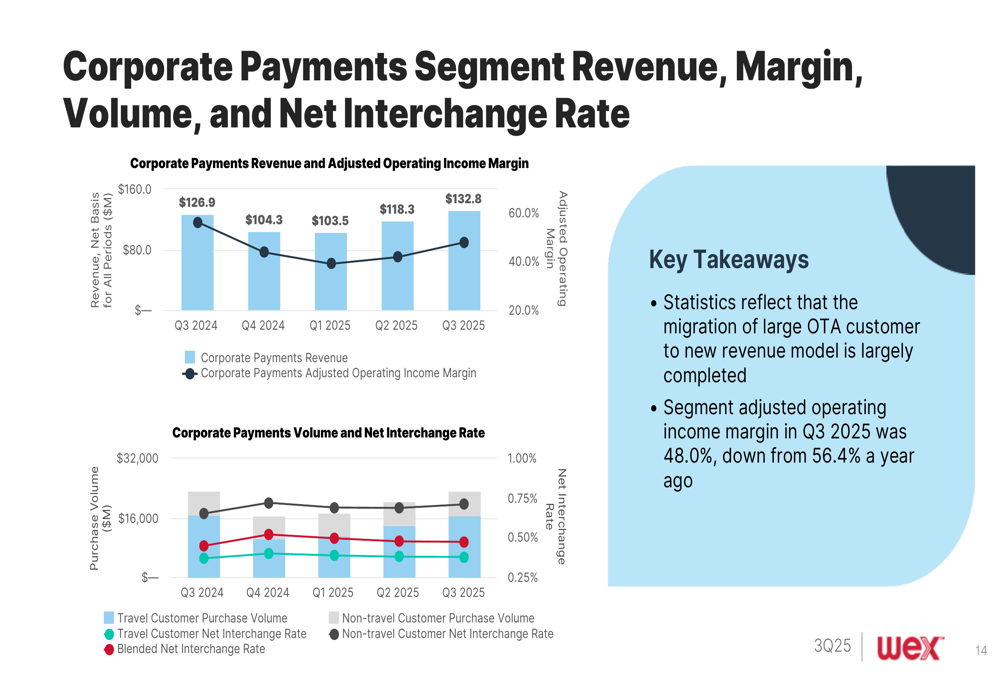
The Corporate Payments segment, which represents approximately 20% of WEX’s revenue, experienced changes in its business model. The company noted that the migration of a large online travel agency (OTA) customer to a new revenue model is largely completed. However, this transition appears to have affected margins, as the segment adjusted operating income margin decreased from 56.4% in Q3 2024 to 48.0% in Q3 2025.
The following chart provides additional insights into the Corporate Payments segment:
Balance Sheet and Capital Allocation
WEX maintained a strong financial position with a corporate cash balance of approximately $128 million and borrowing capacity of $954 million on its credit facility. The company’s leverage ratio stood at 3.25x, within its long-term target range of 2.5-3.5x.
The following chart illustrates WEX’s cash flow and leverage trends:
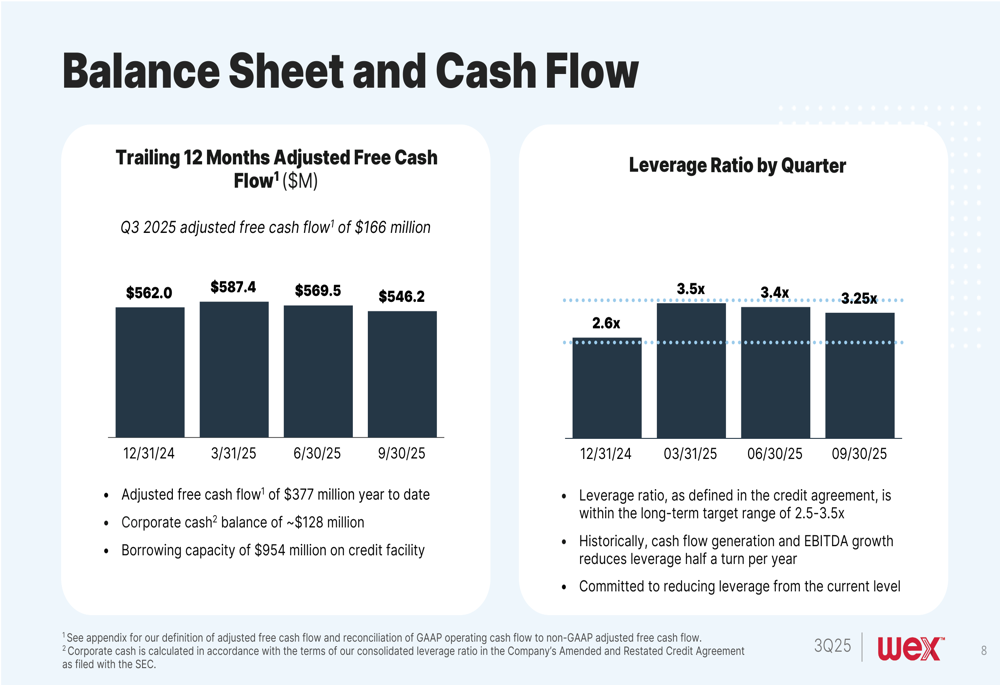
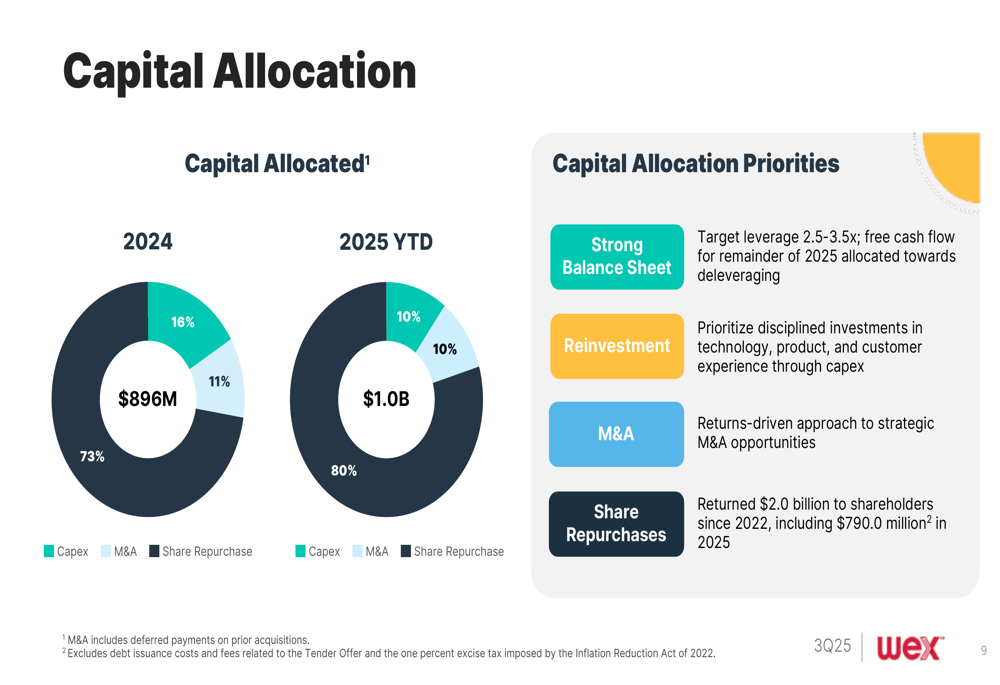
Capital allocation remains a key focus for WEX, with the company directing significant resources toward share repurchases. In 2025 year-to-date, WEX allocated 80% of its capital to share repurchases, 10% to M&A activities, and 10% to capital expenditures. The company has returned $790 million to shareholders in 2025 and $2.0 billion since 2022.
The capital allocation priorities are illustrated in the following chart:
Forward Guidance and Outlook
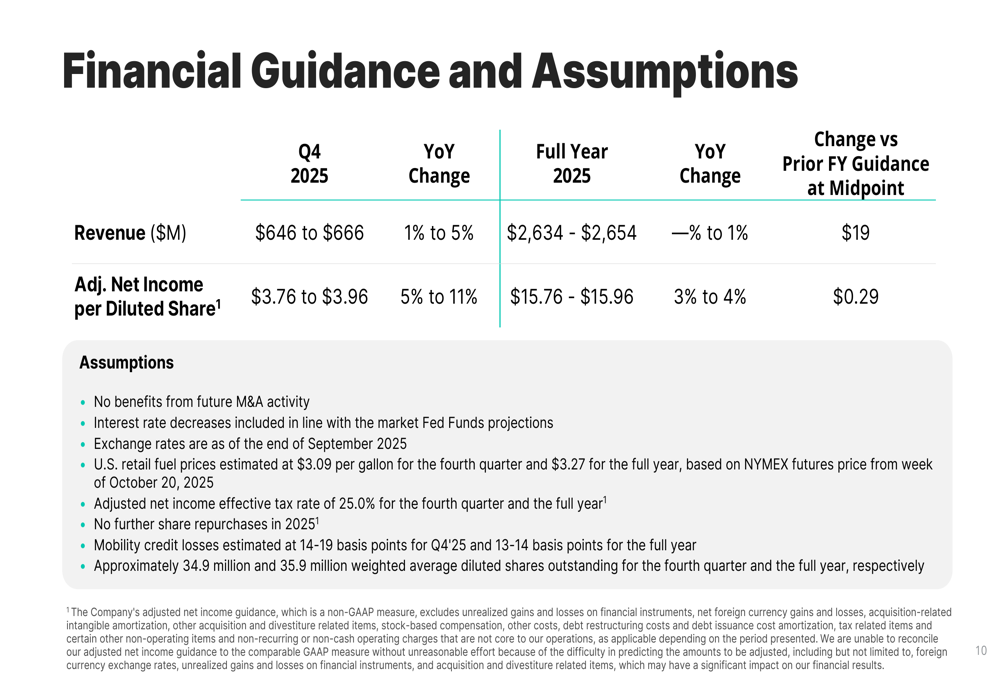
Based on its strong third-quarter performance, WEX raised its full-year 2025 guidance for both revenue and adjusted net income. For the fourth quarter, the company expects revenue between $646 million and $666 million, representing year-over-year growth of 1% to 5%. Adjusted net income per diluted share is projected to be between $3.76 and $3.96, a 5% to 11% increase from the previous year.
For the full year 2025, WEX forecasts revenue of $2,634 million to $2,654 million and adjusted net income per diluted share of $15.76 to $15.96. This represents an increase from the previous guidance, reflecting the company’s confidence in its business momentum.
The detailed financial guidance is presented in the following chart:
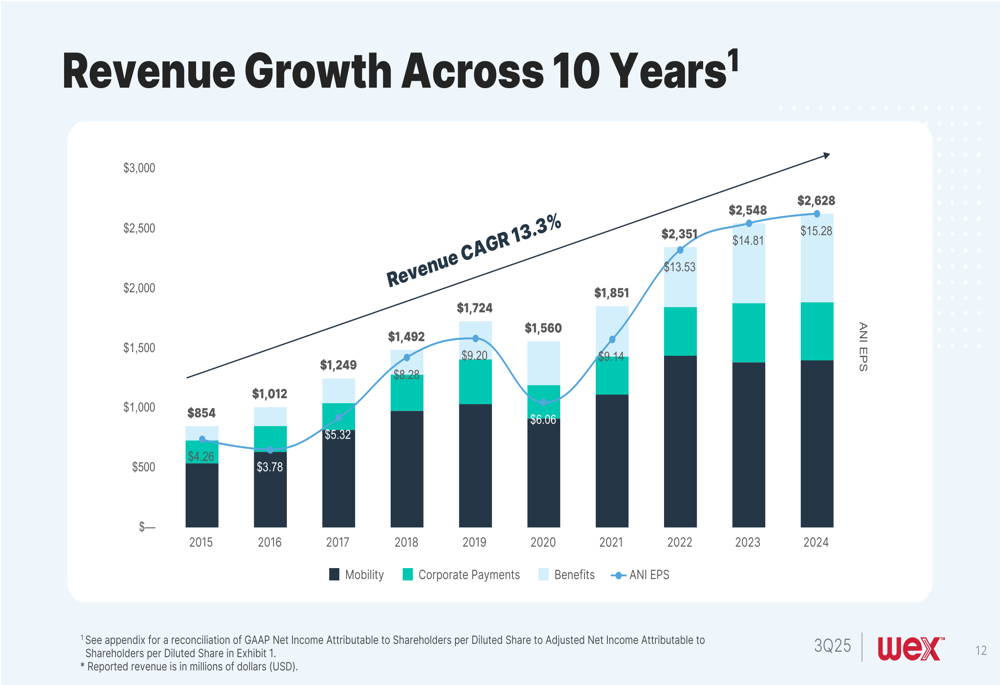
WEX’s long-term growth trajectory remains positive, as evidenced by its 10-year revenue CAGR of 13.3%. The company has consistently grown its revenue from $854 million in 2015 to $2,628 million in 2024, demonstrating its ability to expand its business over time.
The following chart illustrates WEX’s revenue growth over the past decade:
Looking ahead, WEX’s customer-centric strategy focuses on three key pillars: amplifying the core business through targeted investments, expanding reach by extending into adjacent workflows, and accelerating innovation to drive productivity and operating leverage. This approach, supported by the company’s core competencies in payment intelligence, workflow optimization, scale, and industry expertise, positions WEX to continue its growth trajectory despite macroeconomic challenges.
Full presentation:
This article was generated with the support of AI and reviewed by an editor. For more information see our T&C.