Novo Nordisk, Eli Lilly slide after Trump comments on weight loss drug pricing

Introduction & Market Context
WIIT SpA (BIT:WIIT), a European cloud services provider, presented its H1 2025 financial results on August 4, 2025, showcasing strong growth across all key metrics. The company, which positions itself as a premium cloud provider "built in Europe, designed for what matters most," saw its shares trade at €16.14 on the day of the announcement, down 0.87%.
The results highlight WIIT’s successful geographic expansion strategy and its focus on high-value contracts, which has driven significant margin improvements despite some strategic customer churn. The company continues to strengthen its presence across key European markets, with Germany now representing its largest revenue segment.
Quarterly Performance Highlights
WIIT reported impressive growth across all major financial metrics for the first half of 2025, with adjusted revenue increasing by 17.3% year-over-year to €85.3 million, up from €72.7 million in H1 2024.
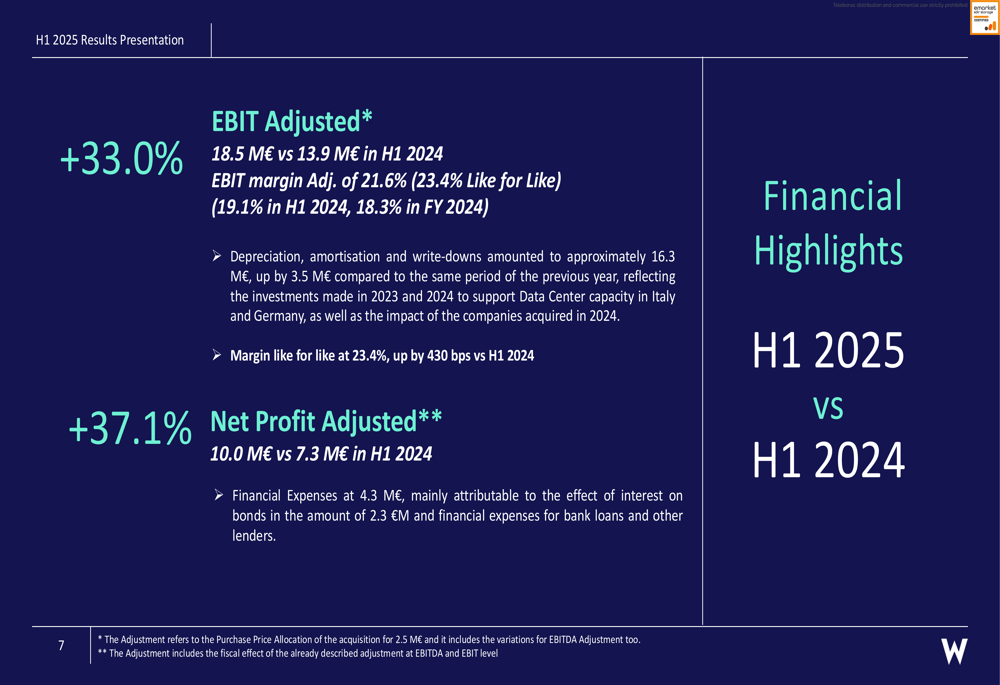
The company’s profitability metrics showed even stronger improvement, with adjusted EBITDA surging 30.3% to €34.8 million and adjusted net profit jumping 37.1% to €10.0 million compared to the same period last year.
As shown in the following financial highlights from the presentation:
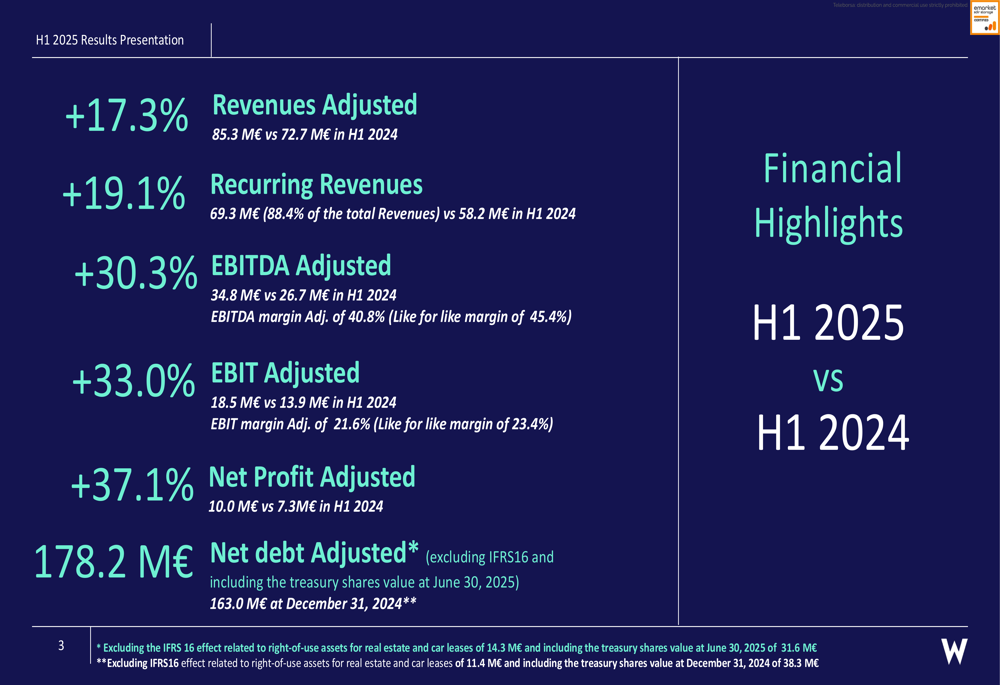
Particularly noteworthy is the company’s recurring revenue performance, which grew 19.1% to €69.3 million and now represents 88.4% of total revenues. This high percentage of recurring revenue provides WIIT with strong visibility and stability for future periods.
The adjusted EBITDA margin expanded significantly to 40.8% (45.4% on a like-for-like basis), up from 36.7% in H1 2024, demonstrating the company’s ability to scale efficiently and focus on higher-margin services.
Geographic Performance
WIIT’s geographic diversification strategy is clearly reflected in its H1 2025 results, with operations across Italy, Germany, and Switzerland all contributing to growth, though with varying profitability profiles.
Germany has emerged as the company’s largest market, accounting for 53.3% of group revenues at €45.5 million, while also delivering the highest EBIT margin at 26.1%. Italy contributed 33.9% of revenues with a strong EBITDA margin of 53.5%, while Switzerland represented 12.8% of revenues with more modest profitability metrics.
The following breakdown illustrates the company’s performance by country:
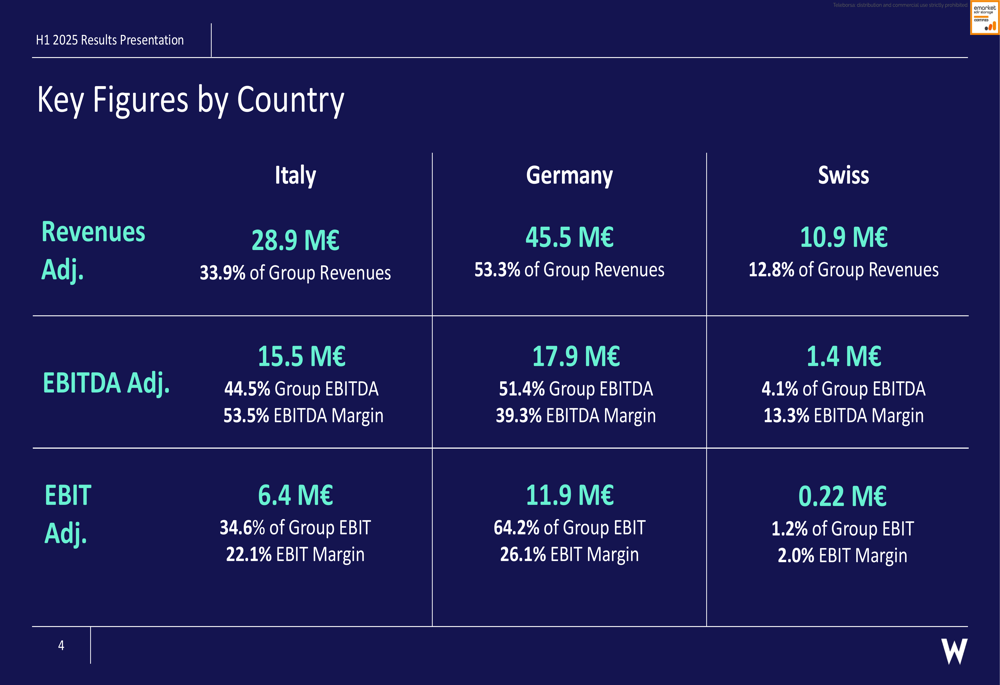
The German operations showed particularly strong EBITDA margin improvement, reaching 39.3% compared to 33.4% in H1 2024. On a like-for-like basis excluding acquisitions, the German EBITDA margin excluding Gecko reached an impressive 47.8%, representing a 10.6 percentage point increase from the previous year.
Detailed Financial Analysis
WIIT’s revenue growth was driven by both organic expansion and strategic acquisitions. The company highlighted that its adjusted recurring revenues grew 19.1% year-over-year to €69.3 million, with organic growth of 4.9% (9.1% excluding churn).
As shown in the following revenue breakdown:
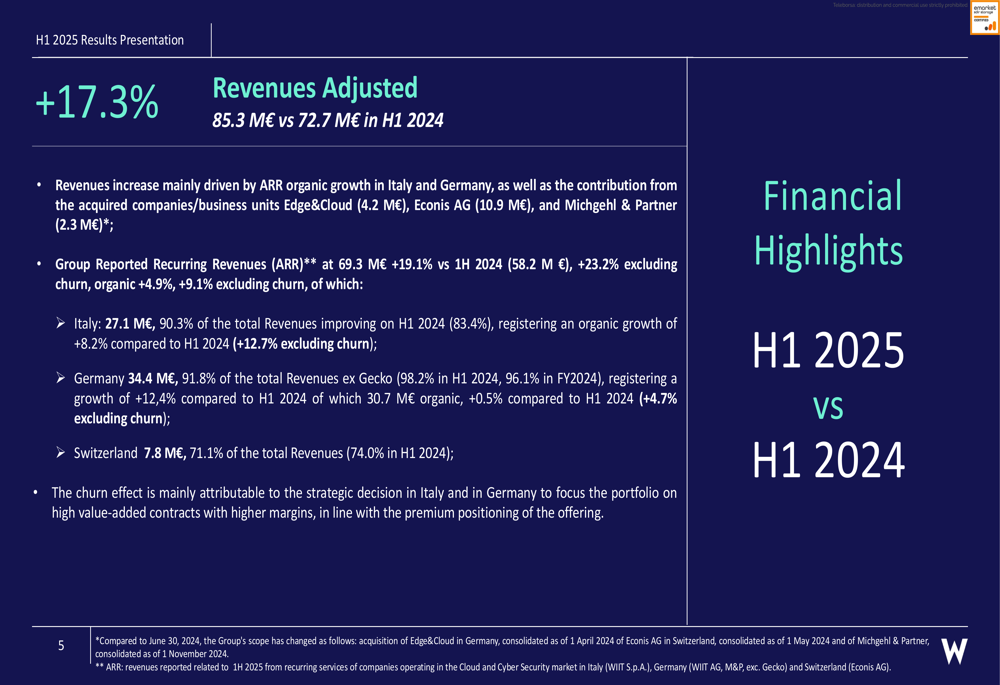
The company’s strategic decision to focus on higher-margin contracts led to some customer churn, particularly in Italy and Germany. However, this strategic shift has clearly paid off in terms of profitability, as evidenced by the significant margin expansion across all geographies.
WIIT’s EBITDA performance was particularly strong, with adjusted EBITDA growing 30.3% to €34.8 million and the margin expanding to 40.8%.
The following EBITDA analysis provides further details:
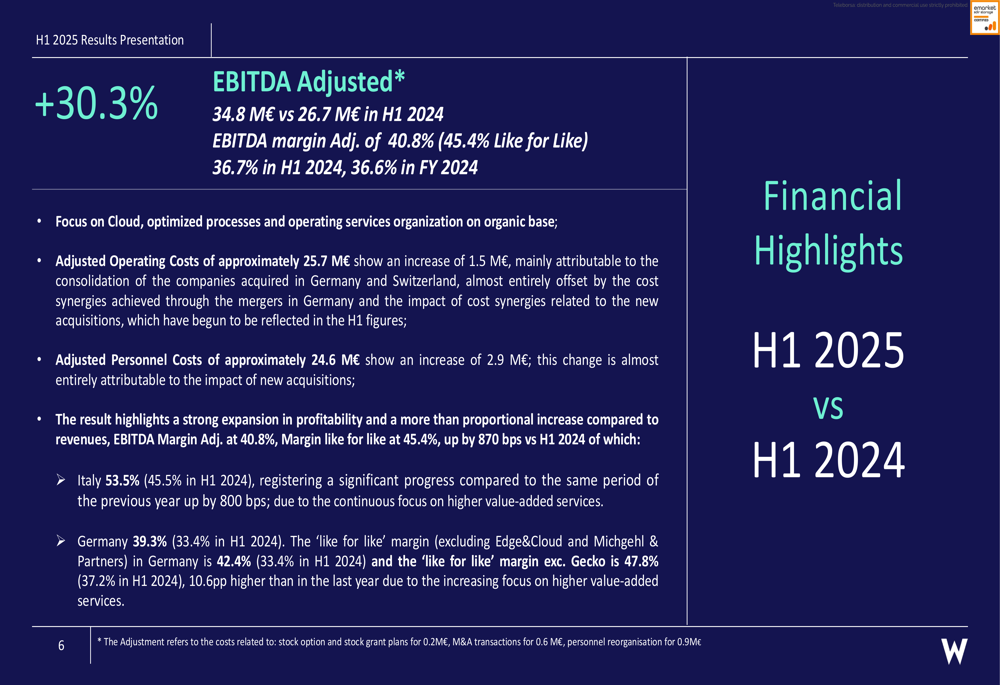
The company’s operating costs increased by only €1.5 million to approximately €25.7 million, with most of this increase attributable to newly acquired companies. Cost synergies from mergers in Germany and recent acquisitions have already begun to positively impact the H1 figures.
EBIT and net profit also showed strong growth, with adjusted EBIT increasing 33.0% to €18.5 million and adjusted net profit rising 37.1% to €10.0 million.
Financial Position & Outlook
WIIT’s net debt stood at €224.1 million (including IFRS16 of €14.2 million and excluding treasury shares valued at €31.6 million), compared to €212.7 million as of December 31, 2024. The company generated operating cash flow of €19.2 million during the period.
Capital expenditures totaled approximately €20.5 million, with €13.1 million related to maintaining existing infrastructure and supporting new contracts, and €7.4 million primarily related to rental rights and vehicles.
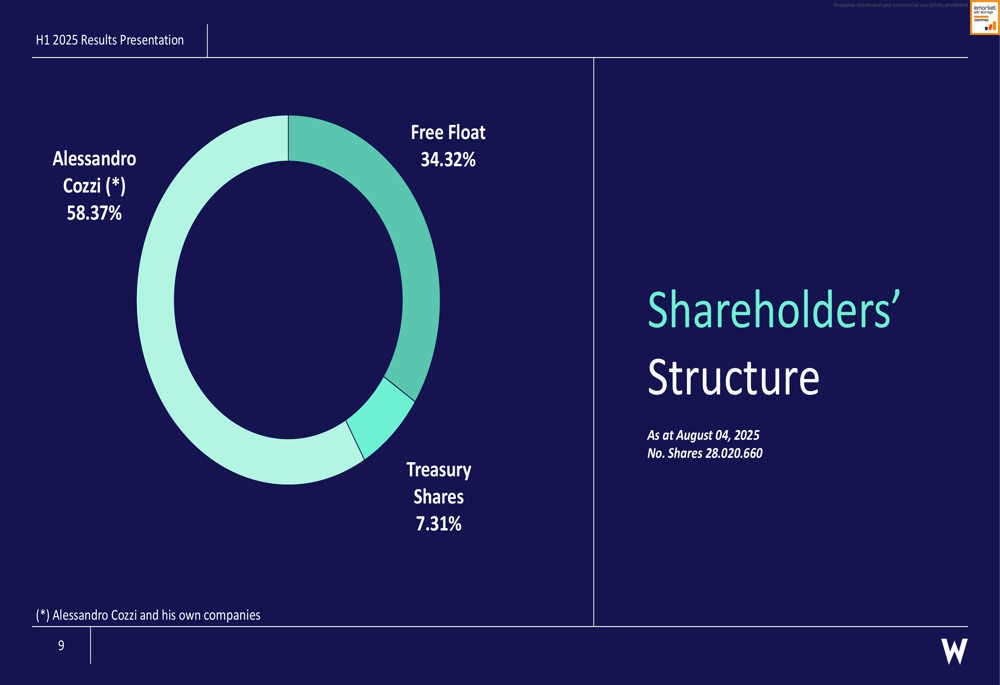
The company’s shareholder structure remains stable, with CEO Alessandro Cozzi controlling 58.37% of the shares, while 34.32% represents the free float and 7.31% are treasury shares.
WIIT’s focus on high-value cloud services and strategic acquisitions positions it well for continued growth in the European market. The company’s ability to expand margins while growing revenue demonstrates the effectiveness of its premium positioning strategy, which appears set to continue driving financial performance in the coming quarters.
Full presentation:
This article was generated with the support of AI and reviewed by an editor. For more information see our T&C.