Fannie Mae, Freddie Mac shares tumble after conservatorship comments

Wyndham Hotels & Resorts (NYSE:WH) showcased its resilient business model and strong first-quarter performance in its April 30, 2025 investor presentation, emphasizing how its asset-light franchise approach positions the company to weather economic uncertainty while continuing to expand its global footprint.
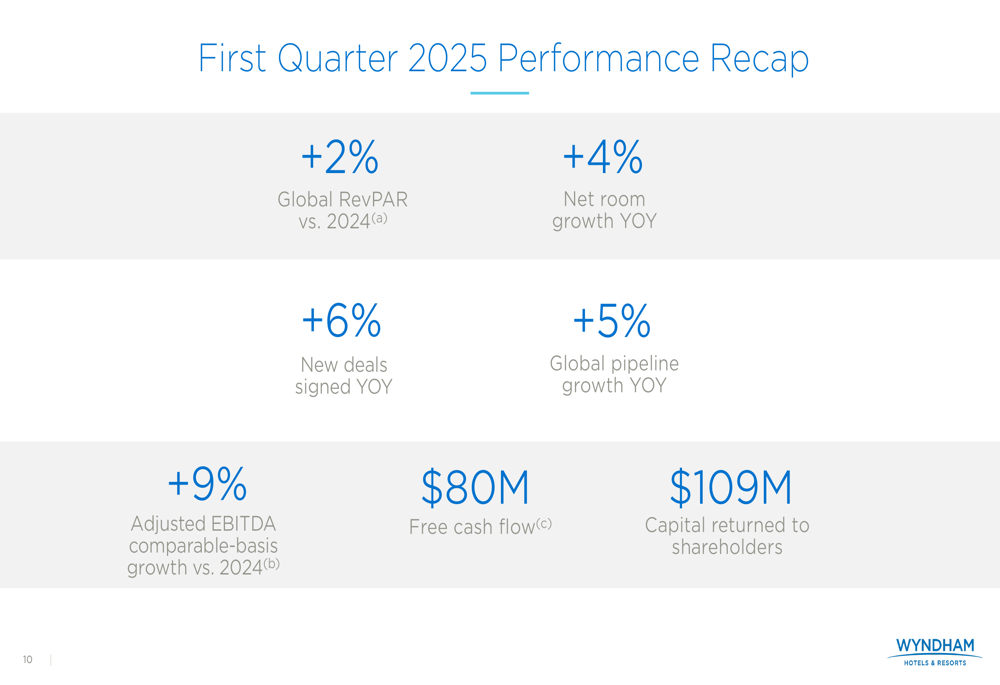
Q1 2025 Performance Highlights
The world’s largest hotel franchisor reported solid growth across key metrics for the first quarter of 2025. Global RevPAR increased 2% year-over-year, while the company achieved 4% net room growth. New deals signed rose 6% compared to the same period last year, contributing to a 5% year-over-year expansion in the global development pipeline.
Most notably, Wyndham delivered 9% growth in Adjusted EBITDA on a comparable basis versus Q1 2024, generated $80 million in free cash flow, and returned $109 million to shareholders through dividends and share repurchases.
This performance builds on the momentum seen in previous quarters. In Q3 2024, Wyndham had reported a 7% increase in adjusted EBITDA and a 10% rise in adjusted EPS, demonstrating consistent execution of its growth strategy.
Business Model Advantages
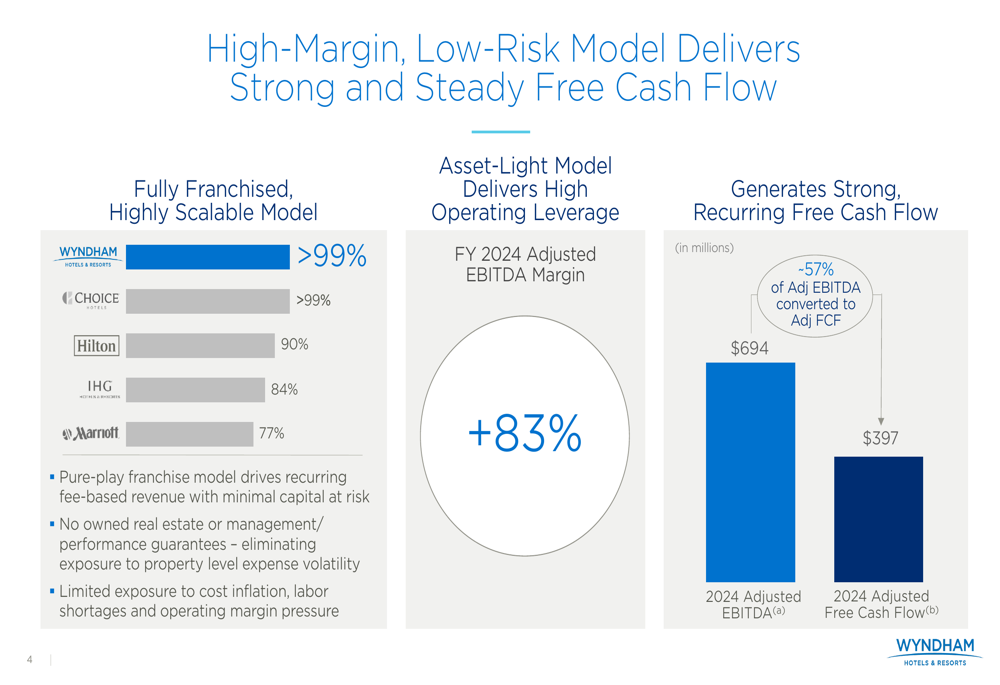
Wyndham’s presentation highlighted its high-margin, low-risk business model as a key differentiator in the hospitality industry. The company operates a fully franchised model with over 99% of its properties under franchise agreements, compared to competitors like Hilton (90%), IHG (84%), and Marriott (77%).
This asset-light approach delivered an impressive 83% adjusted EBITDA margin for fiscal year 2024, with $694 million in adjusted EBITDA and $397 million in adjusted free cash flow, representing a conversion rate of approximately 57%.
The company’s portfolio consists of approximately 9,300 hotels with 907,000 rooms across 95+ countries and 25 brands. Wyndham’s focus on select-service properties, primarily in drive-to destinations (90%) with a heavy leisure guest mix (70%), provides additional resilience against economic headwinds.
Growth Strategy and Pipeline Expansion
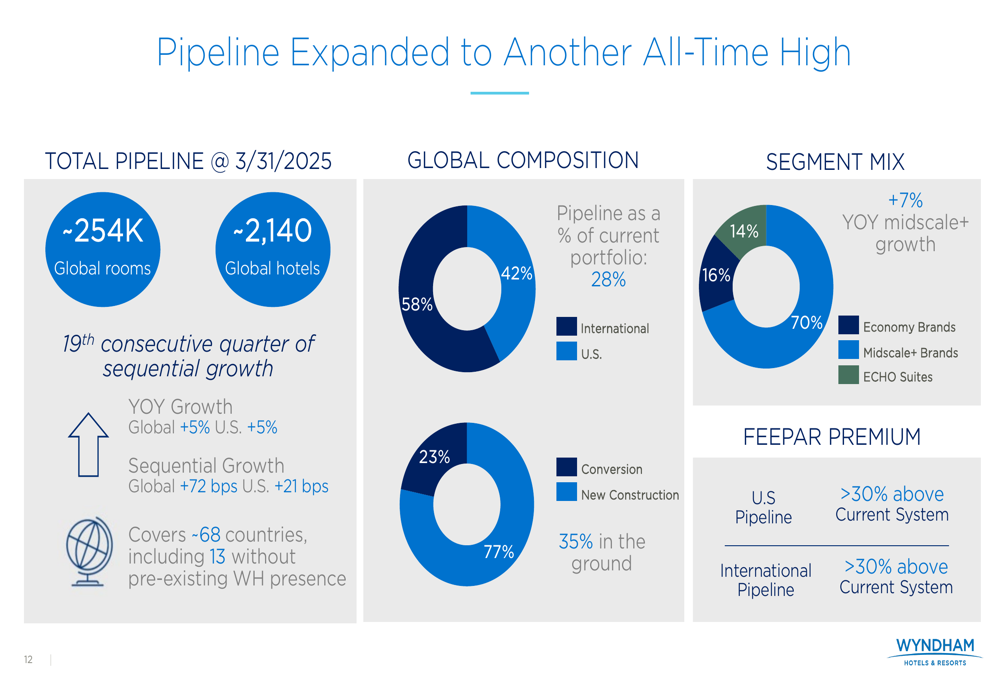
Wyndham’s development pipeline reached another all-time high in Q1 2025, marking the 19th consecutive quarter of sequential growth. The pipeline now stands at approximately 254,000 rooms across 2,140 hotels, representing 28% of the company’s current portfolio.
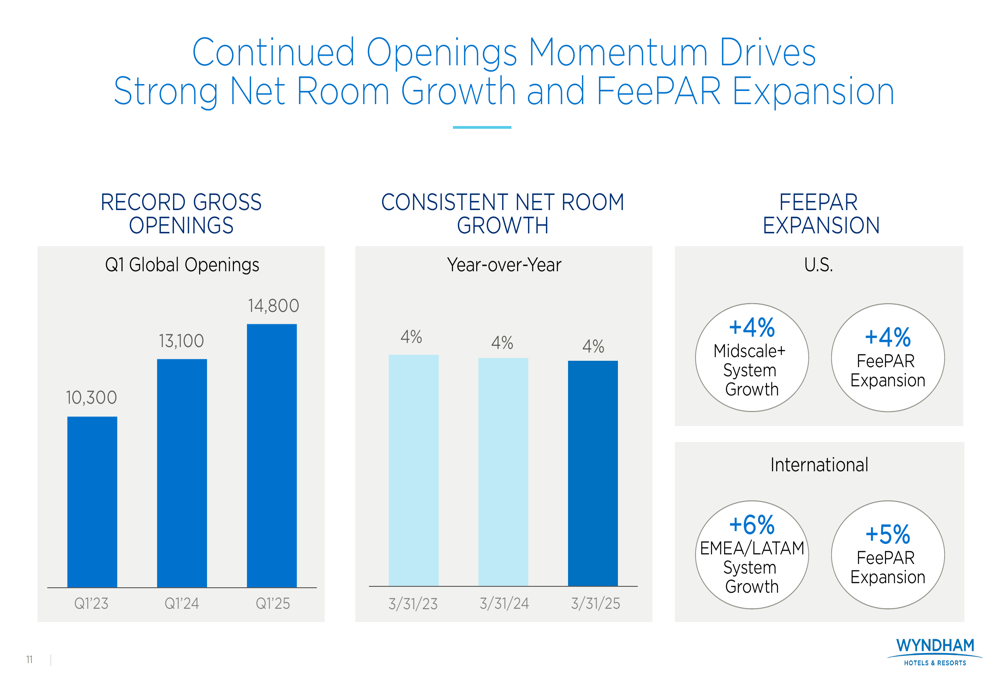
The company has demonstrated consistent momentum in room openings, with Q1 2025 global openings reaching 14,800 rooms, up from 13,100 in Q1 2024 and 10,300 in Q1 2023. This strong performance in gross openings has supported the 4% year-over-year net room growth.
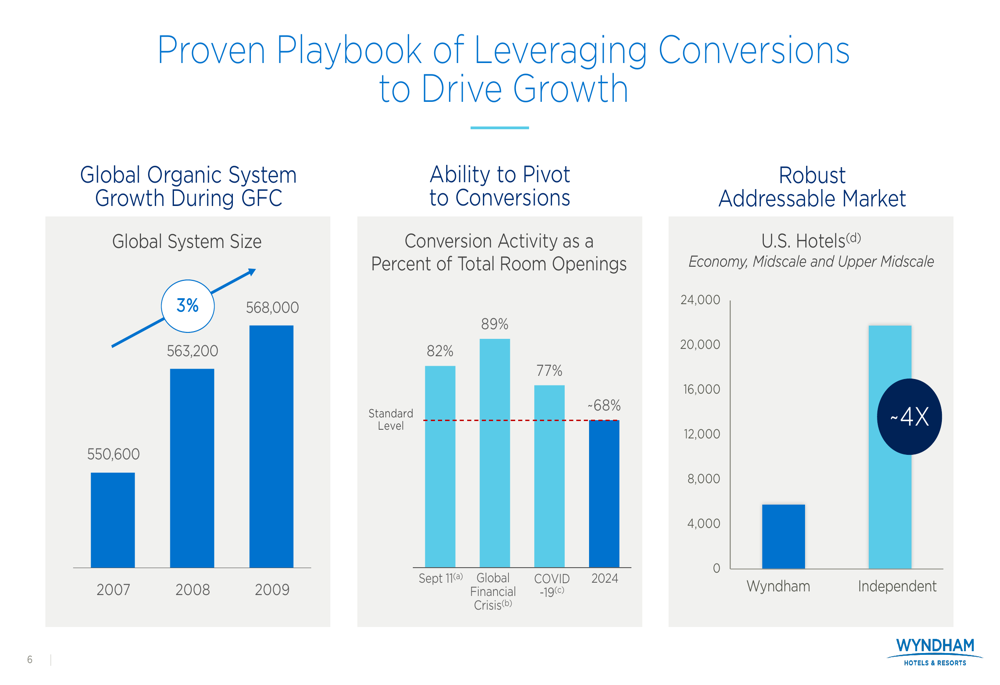
A key element of Wyndham’s growth strategy is its ability to pivot to conversion properties during economic downturns. The presentation highlighted how conversion activity increased during previous economic challenges, reaching 82% of total room openings during the September 11 period, 89% during the Global Financial Crisis, and 77% during COVID-19, compared to approximately 68% in 2024.
Positioning for Economic Uncertainty
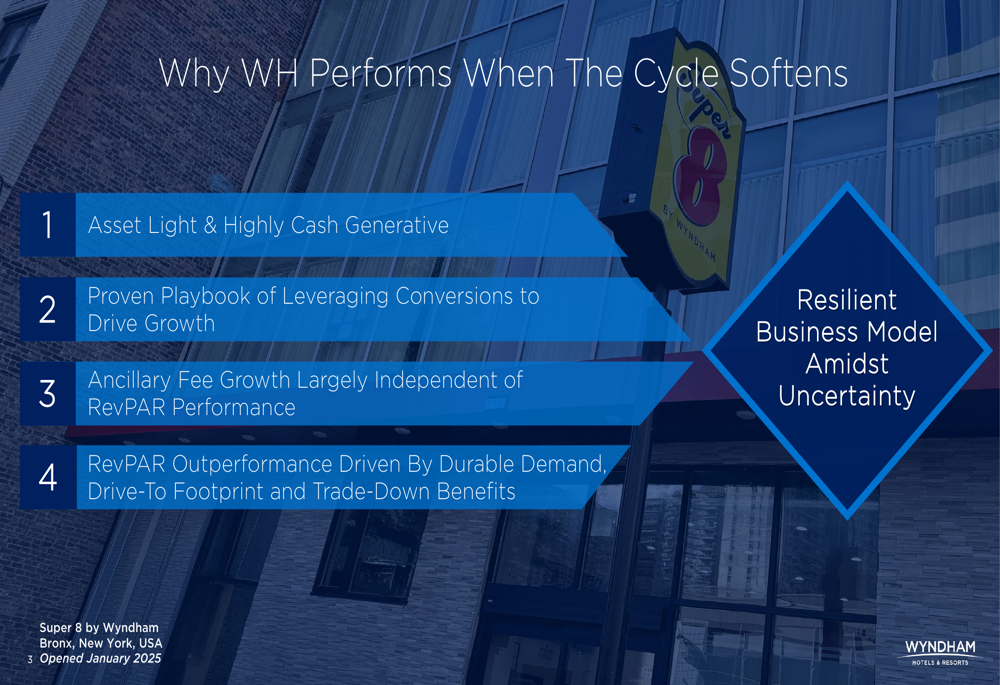
Wyndham dedicated significant attention to explaining why its business model performs well when economic cycles soften. The presentation emphasized four key factors: the asset-light and highly cash-generative nature of the business, a proven playbook of leveraging conversions to drive growth, ancillary fee growth that is largely independent of RevPAR performance, and RevPAR outperformance driven by durable demand, drive-to footprint, and trade-down benefits.
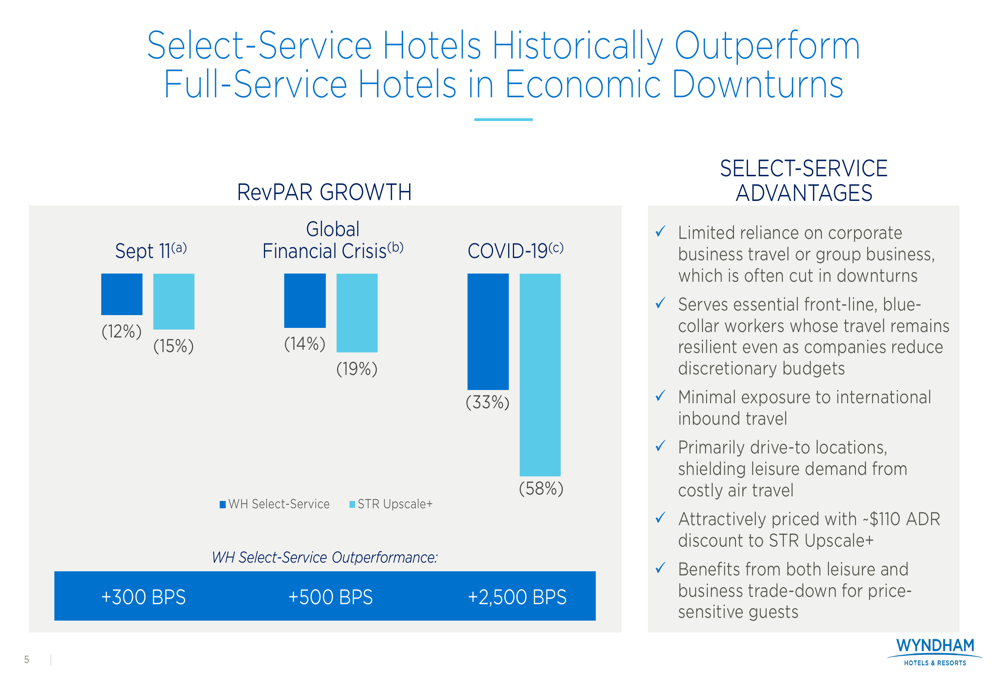
Historical data presented showed that Wyndham’s select-service hotels have consistently outperformed full-service hotels during economic downturns. During the September 11 period, Wyndham’s select-service RevPAR declined 12% compared to 15% for upscale and above segments. Similarly, during the Global Financial Crisis, Wyndham saw a 14% decline versus 19% for upscale+, and during COVID-19, a 33% decline versus 58%.
Forward-Looking Statements
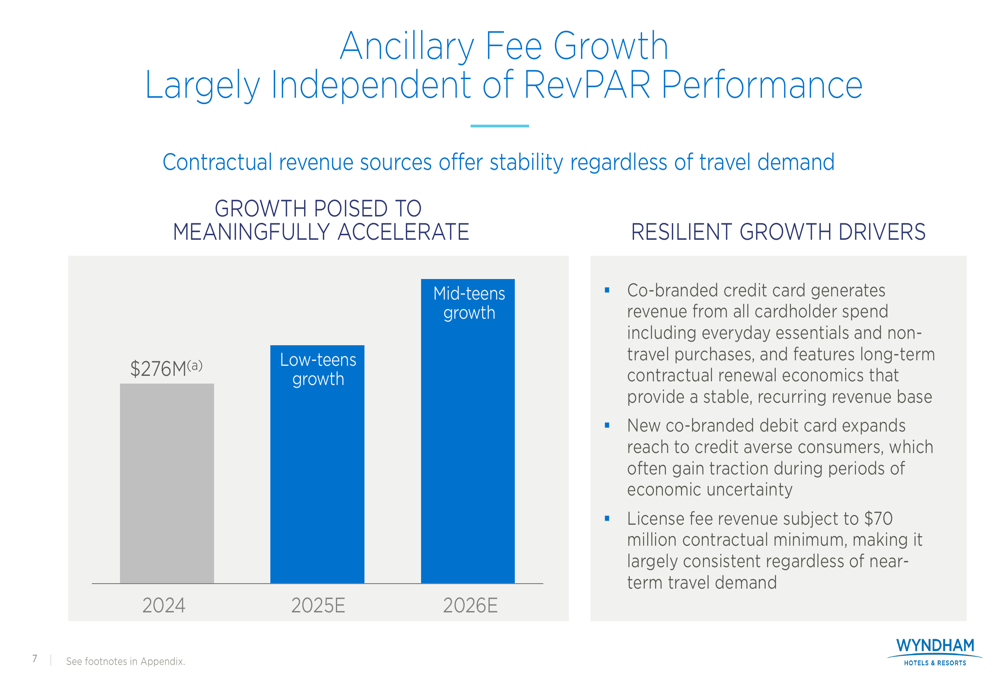
Looking ahead, Wyndham expects its ancillary fee growth to meaningfully accelerate, projecting low-teens growth in 2025 and mid-teens growth in 2026, up from approximately $276 million in 2024. This growth is expected to be driven by the company’s co-branded credit card, a new co-branded debit card targeting credit-averse consumers, and license fee revenue that is subject to a $70 million contractual minimum.
The company’s strategic focus on maintaining its asset-light, fee-based franchise business model appears well-aligned with current market conditions, as it continues to generate high margins and substantial free cash flow while expanding its global footprint.
Wyndham’s stock closed at $86.10 on April 30, 2025, down 0.93% for the day, but showed signs of recovery in after-hours trading with a 0.94% increase. The company’s shares have traded between $67.67 and $113.07 over the past 52 weeks, reflecting both challenges and opportunities in the evolving hospitality landscape.
Full presentation:
This article was generated with the support of AI and reviewed by an editor. For more information see our T&C.