Gold is 2025’s best performer. UBS sees more upside
Investing.com-- Bank of America strategist Michael Hartnett says the U.S. government’s continued high spending may require interest rate cuts to avoid an unsustainable debt burden.
With annual interest payments nearing $1 trillion—roughly 4% of U.S. GDP—Hartnett notes these costs would stabilize only if the Fed funds rate falls below 3%.
“Unwillingness/inability to reduce govt spend [is] likely why Trump needs Fed to cut,” Hartnett wrote, adding that the next Federal Reserve governor may be forced to introduce Yield Curve Control to manage long-term borrowing costs and prevent disorderly debt markets.
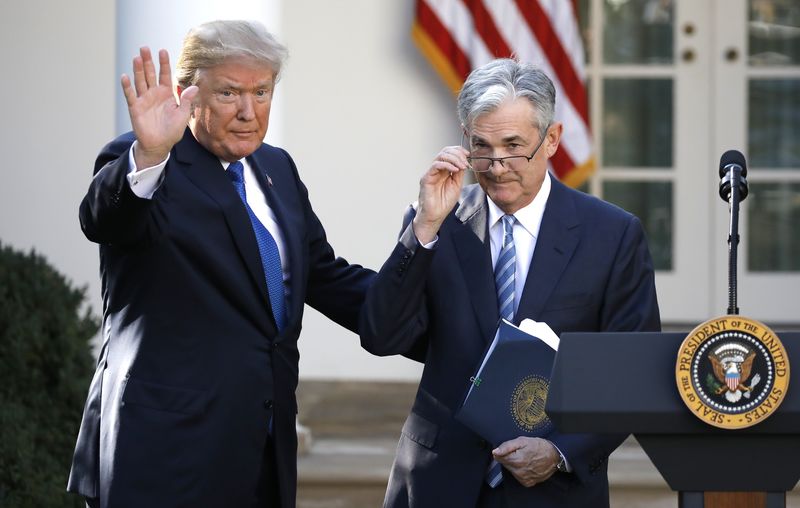
Trump recently became the fourth U.S. president in history to visit the Federal Reserve, evoking parallels to FDR’s 1937 appearance at the opening of the Fed building. At current spending levels, Hartnett quips, “the U.S. government will spend the equivalent of the Fed’s $2.6 billion renovation in the next 3 hours and 12 minutes.”
On markets, Hartnett sees bank stocks as the best expression of an ongoing shift from U.S. to global fiscal excess. Year-to-date, bank equities have gained 62% in Europe, 37% in the U.K., and 17% in the U.S.
However, bond vigilantes may emerge if long-term yields climb above key thresholds—5.6% in the U.K., 5.1% in the U.S., and 3.2% in Japan.
Hartnett also points to China as an outlier, where bond yields have fallen and a 60/40 asset allocation still works. China’s H-shares are up 58% over the past two years, outpacing both the S&P 500 and global equities.
He highlights a divergence between Wall Street and Main Street. Markets have embraced the idea of a Trump pivot to lower tariffs, taxes, and rates, with the S&P 500 up 9% year-to-date.
But Trump’s job approval is back near April lows, and while “Trump ‘bro billionaire’ stocks” have surged 71% since the election, “Trump small-cap ‘base’ stocks” are down 1%.
Bonds attract strong inflows
In a week to Wednesday, bond and money-market funds attracted the largest share of investment inflows, while cryptocurrency funds recorded their biggest four-week cumulative inflow ever at $12.2 billion, according to Bank of America.
For the week ended July 23, bond funds saw inflows of $25.9 billion, their largest weekly inflow since June 2020. Cash funds attracted $13.7 billion, stocks drew $5.8 billion, crypto funds received $3.6 billion, and gold funds gained $1.6 billion, BofA reported, citing EPFR Global data.
Materials sector funds extended their inflow streak to nine consecutive weeks, the longest since April 2024, accumulating $5.4 billion. Financial sector funds received $1.5 billion, contributing to their strongest five-week cumulative inflow this year at $6.7 billion.
By region, U.S. stocks experienced outflows for the second consecutive week, losing $7.7 billion. European stocks recorded their sixth straight week of inflows at $1.1 billion, while emerging market stocks saw inflows for the third consecutive week, gaining $2 billion.
Japanese stocks had outflows for the second week in a row, totaling $700 million.