TSX gains after CPI shows US inflation rose 3%
- Within the S&P 500, there are several stocks with an annual dividend yield of more than 5%.
- Those that stand out for the dividend belong to sectors such as consumer staples, consumer discretionary, and communication.
- In this piece, we'll take a look at three high-dividend paying stocks that have a bullish technical setup.
The S&P 500 boasts a selection of stocks offering dividend yields exceeding 5%, providing potential income opportunities for investors. Sectors like utilities (NYSE:XLU), financials (NYSE:XLF), and consumer staples (NYSE:XLP) dominate this list.
While these stocks offer attractive dividend yields, it's crucial to consider their overall performance and current trends. Some stocks may be trapped in trading ranges, limiting their upside potential.
But in this piece, we'll examine three stocks combining high dividend yields with strong technical indicators to identify promising investment opportunities. These stocks have demonstrated resilience within their trading ranges and offer potential upside if they break through resistance levels.
1. Verizon
Verizon Communications (NYSE:VZ) is in the business of providing communications, technology, information, and entertainment products and services to consumers and businesses worldwide.
It was formerly known as Bell Atlantic Corporation and changed its name to Verizon Communications in June 2000. The company was incorporated in 1983 and is headquartered in New York.

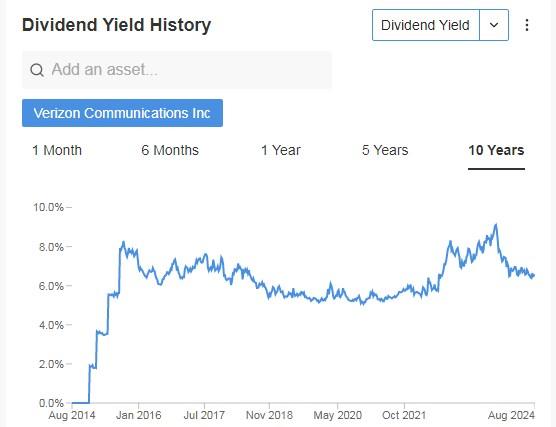
Its annual dividend yield is 6.56% and it maintains dividend payments for 41 consecutive years, demonstrating its financial stability.
Source: InvestingPro
It will present its results on October 22. Verizon reported an increase in its second-quarter financial performance backed by substantial growth in wireless revenue. It also had a 69% increase in its subscriber base, which now exceeds 3.8 million.
The EBITDA was $12.3 billion (up 2.8% year-over-year), and free cash flow and operating efficiency improved, with a notable $3.2 billion reduction in net debt.
Its Beta is 0.39, meaning that its shares move in the same direction as the S&P 500 but with lower volatility.

Source: InvestingPro
Market consensus sees potential at $46.34.

Source: InvestingPro
2. Best Buy
Best Buy (NYSE:BBY) is a retailer of technology products in the United States, Canada, and other countries. Its stores offer computer and cell phone products.

It was incorporated in 1966 and is headquartered in Richfield, Minnesota.
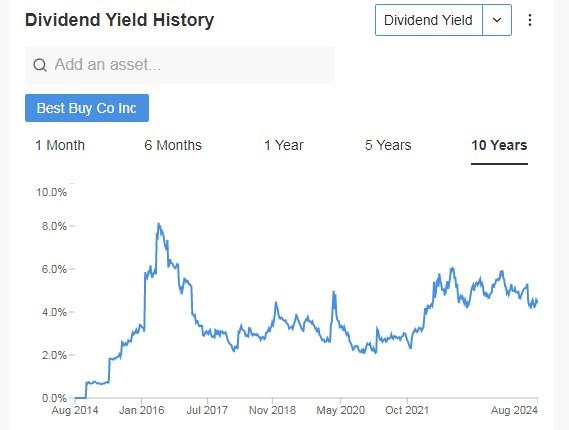
Its annual dividend yield is 4.63%. It has been increasing its dividend for six consecutive years and has been distributing it to its shareholders for 22 years.
Source: InvestingPro
On August 29th we will know its income statement. In the last ones it presented on May 30, it managed to beat market forecasts by 11.8%.

Source: InvestingPro
The retailer is in the early stages of an upturn that could be further boosted by new hardware upgrade cycles driven by advances in artificial intelligence applications.
In addition, Best Buy's business outlook appears to be improving, as indicated by the positive trend in laptop sales.
It has a solid market capitalization of $18.55 billion and trades at a price-to-earnings (P/E) ratio of 14.99, reflecting a slight discount compared to its adjusted P/E over the past twelve months.
The company operates with a moderate level of debt and has cash flows that can sufficiently cover interest payments, suggesting a degree of financial stability.
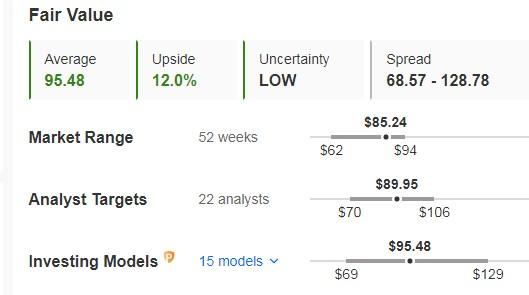
Its fair value or price to fundamentals is at $95.48, or 12% above the closing price for the week, reflecting that the stock is undervalued.
Source: InvestingPro
3. Dow
Dow (NYSE:DOW) features a wide range of packaging, transportation, infrastructure, mobility and consumer products and solutions in the United States, Canada, Europe, the Middle East, Africa, Asia Pacific, and Latin America.

It was incorporated in 2018 and is headquartered in Midland, Michigan.
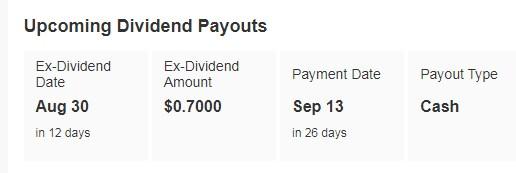
Its annual dividend yield is 5.36%. It will distribute $0.70 per share on September 13, and to be eligible to receive it, shares must be held by August 30.
Source: InvestingPro
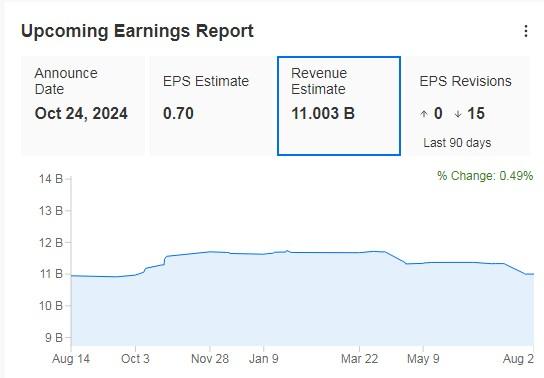
It will release its next results on October 24. Second-quarter earnings showed a 4% decline in net sales to $10.9 billion.
Operating EBIT increased to $819 million, a gain of $145 million from the previous quarter. The cash flow generation strategy resulted in US$832 million.
Source: InvestingPro
The company's top management has been aggressively repurchasing shares, which could be a sign of confidence on the part of the company's leaders in its prospects.
The market gives it a price target at $59.15.

Source: InvestingPro
***
Do you wish to discover how to leverage 13F filings to track the latest moves of leading hedge funds and take your investment strategy to the next level?
Join us for an exclusive webinar hosted by Jesse Cohen, senior analyst at Investing.com, and learn how you can copy the latest investments of great investors.
Register now for free, and gain the expertise to make smarter, more strategic investment decisions.
Disclaimer: This article is written for informational purposes only; it does not constitute a solicitation, offer, advice, counsel or recommendation to invest as such it is not intended to incentivize the purchase of assets in any way. I would like to remind you that any type of asset, is evaluated from multiple perspectives and is highly risky and therefore, any investment decision and the associated risk remains with the investor.
