5 reasons behind yesterday’s sharp market reversal
This post was written exclusively for Investing.com
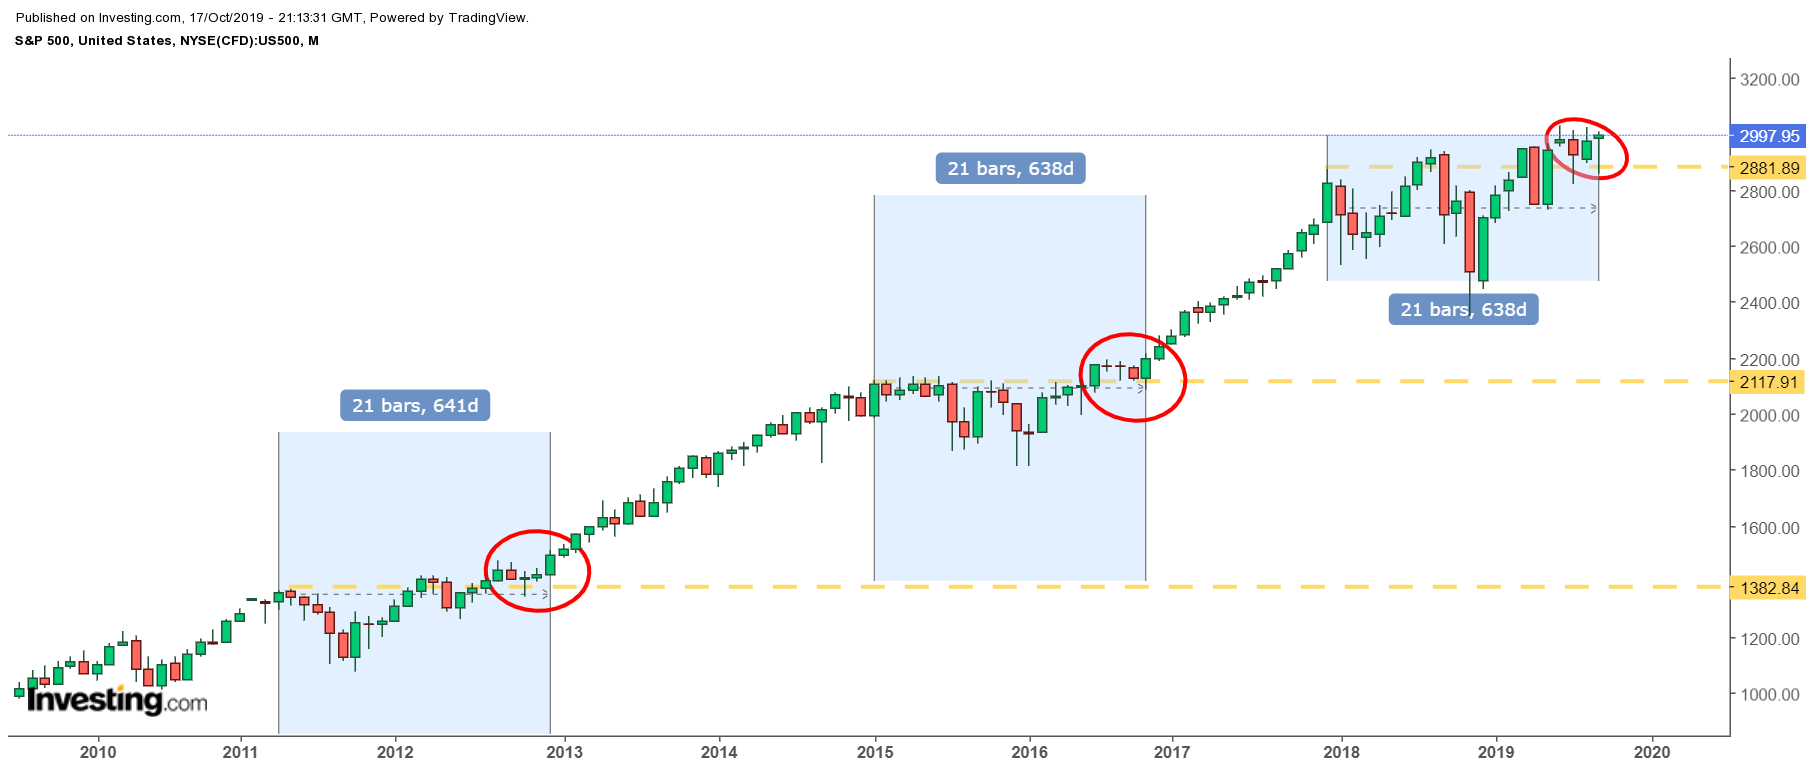
The S&P 500 may be ready for a big move higher if history repeats itself. The index has traded sideways for 22 months, while also seeing a drawdown of 20%. The last time that happened was in 2012 and 2013. Something similar happened in 2015 and 2016. Both times the S&P 500 went on to see massive gains for more than a year.
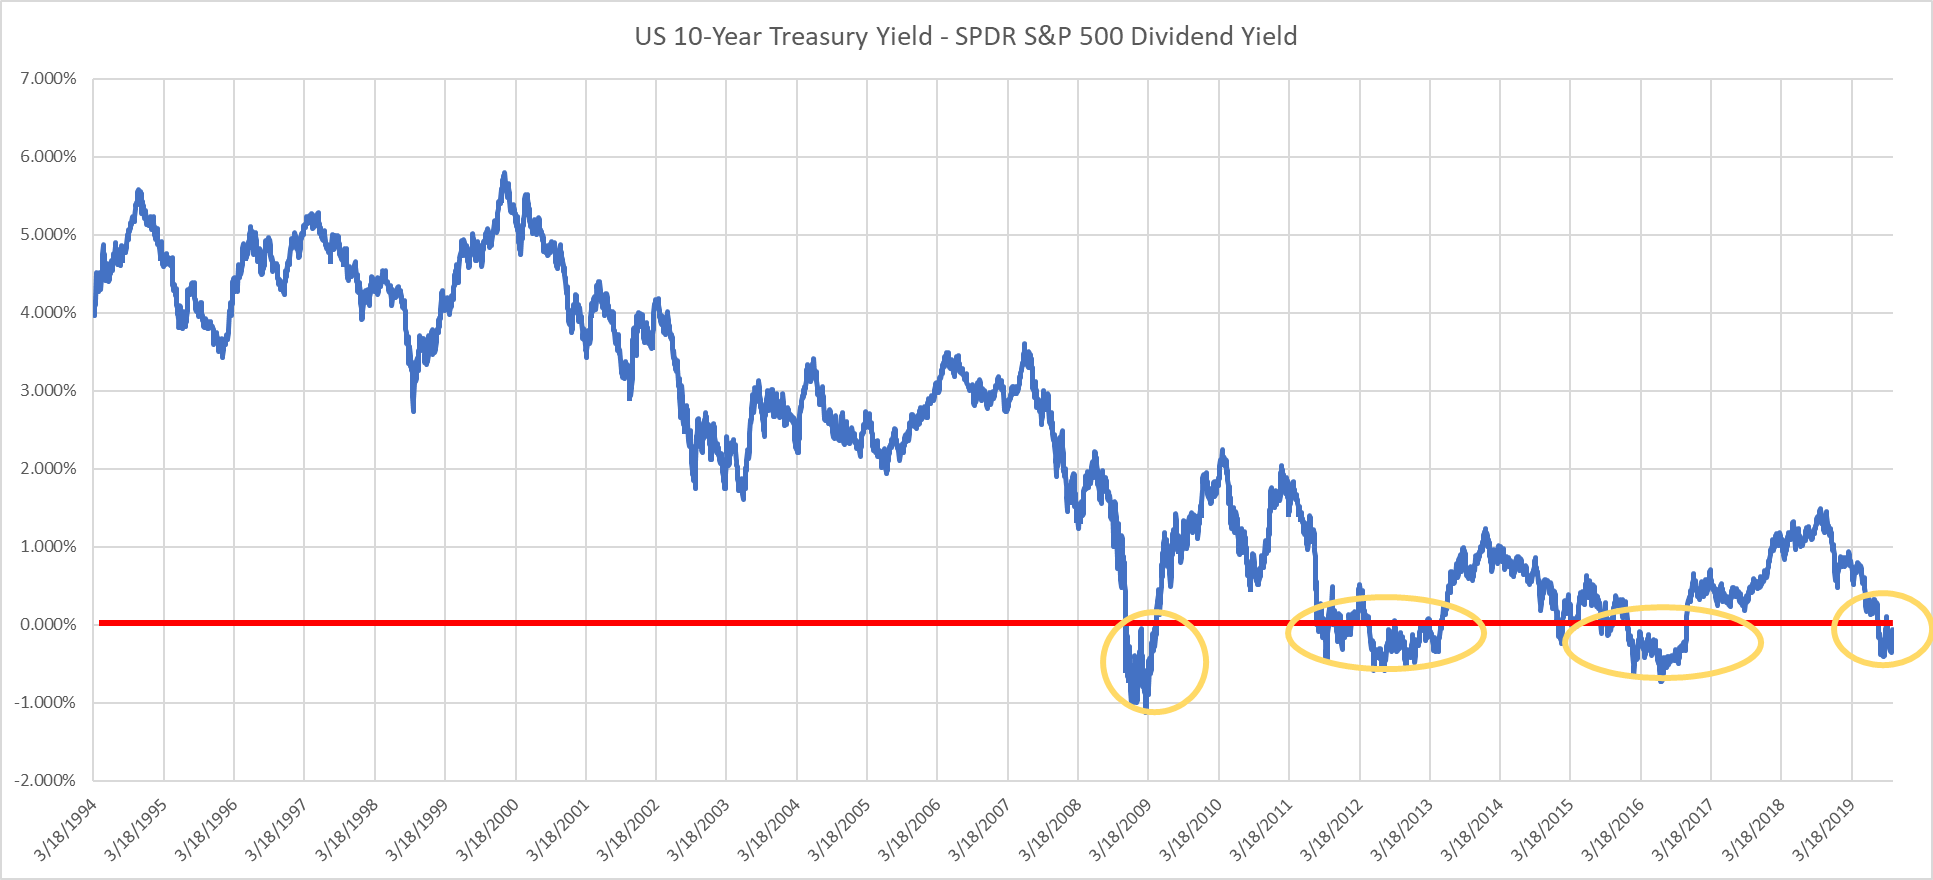
There are even more parallels, such as the index dividend yield inverting with the U.S. 10-year Treasury rate. The coincidences during these two previous periods and today are rather startling and could be a sign of good things to come.

The 22-Month Period
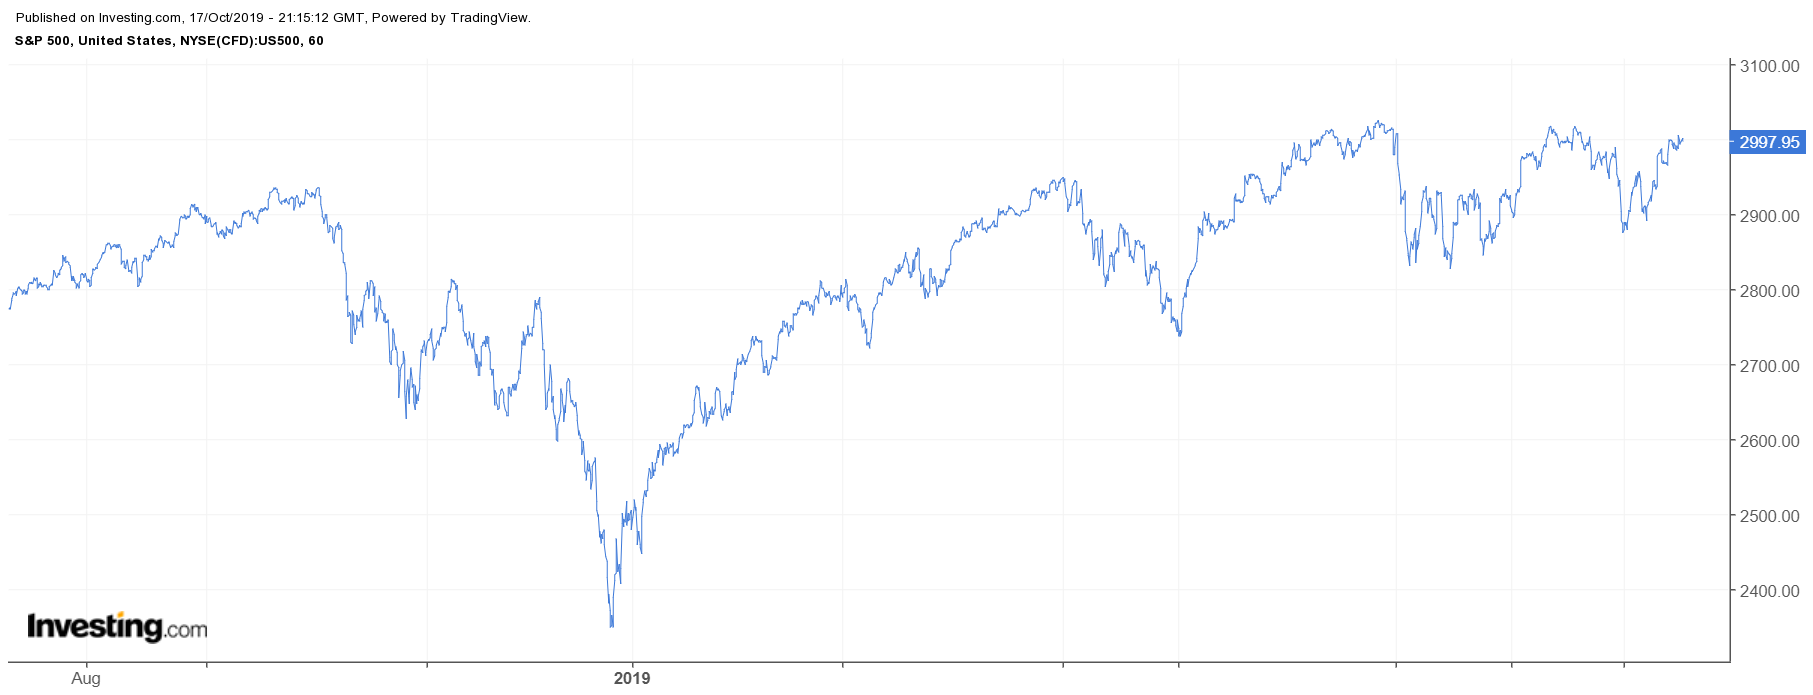
The last 22 months for the S&P 500 have been rather dull with the index essentially trading sideways since January 26, 2018. That was when it rose to what was then an all-time intraday high at 2,873. Since that time the S&P 500 has risen by just 4.35% to 2,998 as of Oct. 17, and has spent the majority of its time below the 2,873 level. It also saw a massive 20% drawdown from peak to trough in the fourth quarter of 2018.

A similar thing happened from April 2011 until December 2012 with a long 22 month period of consolidation. In April 2011, the index was trading at 1,363, and by December 2012 it had risen to only 1,426, a gain of 4.6%. It also saw a drawdown of about 20% during the second and third quarters of 2012.
If that wasn’t enough, the S&P 500 flatlined for 22 months starting in February 2015 at 2,104 and proceeded to trade sideways until November 2016 rising to just 2,199, a gain of 4.5%. It also saw a steep sell-off during that period of consolidation, with the index falling by almost 16%.
The 18th Month And The 4-Month Consolidation
Even more interestingly, it was during the 18th month that the index rose above a major level of resistance, which was then followed by four-months of consolidation. In the case of 2012, the S&P 500 rose above a level of approximately 1,385 in August, holding that break out for four months. In 2016, the break out occurred in July when the index rose above 2,120, and then proceeded to hold the break out for four months. Now, the index has risen above resistance around 2,875 in June, and has held that level for what will be its fourth month at the current pace through the end of October.
The Fifth Month
It was then on the fifth month that it finally broke out in a meaningful way starting the next significant move higher. In 2013 it took place in January, and 2016 it took place in December. In both cases the index never looked back, rising by roughly 50% and 37%, respectively.
Yields

If that wasn’t enough for you, the concordance runs deeper. Over that same time we saw interest rates fall sharply on the 10-year U.S. Treasury yield as well. It was during 2012 and 2016 that interest rates on the 10-year Treasury yield fell below the dividend yield of the S&P 500. The same thing has happened again in 2019.
The similarities are eerie. But it is the outcome that may prove to be profitable, at the same time proving that the bull run for the equity market is far from over. If history repeats itself, then November may prove to be the start of the next major leg higher for the S&P 500.
