Jamaica’s outlook revised to stable by Fitch after hurricane
- Bitcoin's recent dip is testing critical support around $60,000 as investor caution grows.
- Selling pressure is intensifying from large investors, but strong demand has emerged below $60,000.
- Technical indicators suggest a pivotal moment ahead; traders should watch these key levels for Bitcoin's short-term trajectory.
- Looking for actionable trade ideas to navigate the current market volatility? Unlock access to InvestingPro’s AI-selected stock winners for under $9 a month!
Bitcoin kicked off the week with a dip, pausing its recovery as it tested a crucial support zone once again.
This comes after a rocky start to October, a month that has historically favored the cryptocurrency, often referred to as “Uptober.”
Last week, Bitcoin found solid support around $60,000, where buyers rushed in to fuel a bounce.
However, rumors about the U.S. government potentially looking to sell its Bitcoin holdings, along with large investors offloading their assets, initially intensified selling pressure.
Despite this, the strong buyer response at key support levels suggests that buyers are poised to step in, increasing the likelihood of Bitcoin resuming its historical Uptober trend this year.
Bitcoin Shows Resilience
The downward trend accelerated after yesterday's inflation data but later lost momentum. Although U.S. inflation did not meet expectations, it continued its year-on-year decline toward the 2% target.
Ignoring short-term employment effects, the outlook appears strong: ongoing inflation progress eases recession fears, providing relief to global markets.
However, robust economic data in the U.S. may give the Fed reason to slow its interest rate cuts.
Discussions are now surfacing about the possibility of holding rates steady at the November meeting, increasing demand for the dollar while maintaining a low risk appetite.
Negative factors also weigh on Bitcoin's upward trajectory. Large investor sell-offs intensified this week, and ongoing geopolitical tensions—particularly those arising from the Middle East—continue to pressure prices.
As a result, investors are viewing Bitcoin more as a risky asset, akin to technology stocks, rather than a safe haven.
BTC Technical View: Testing a Crucial Support Zone
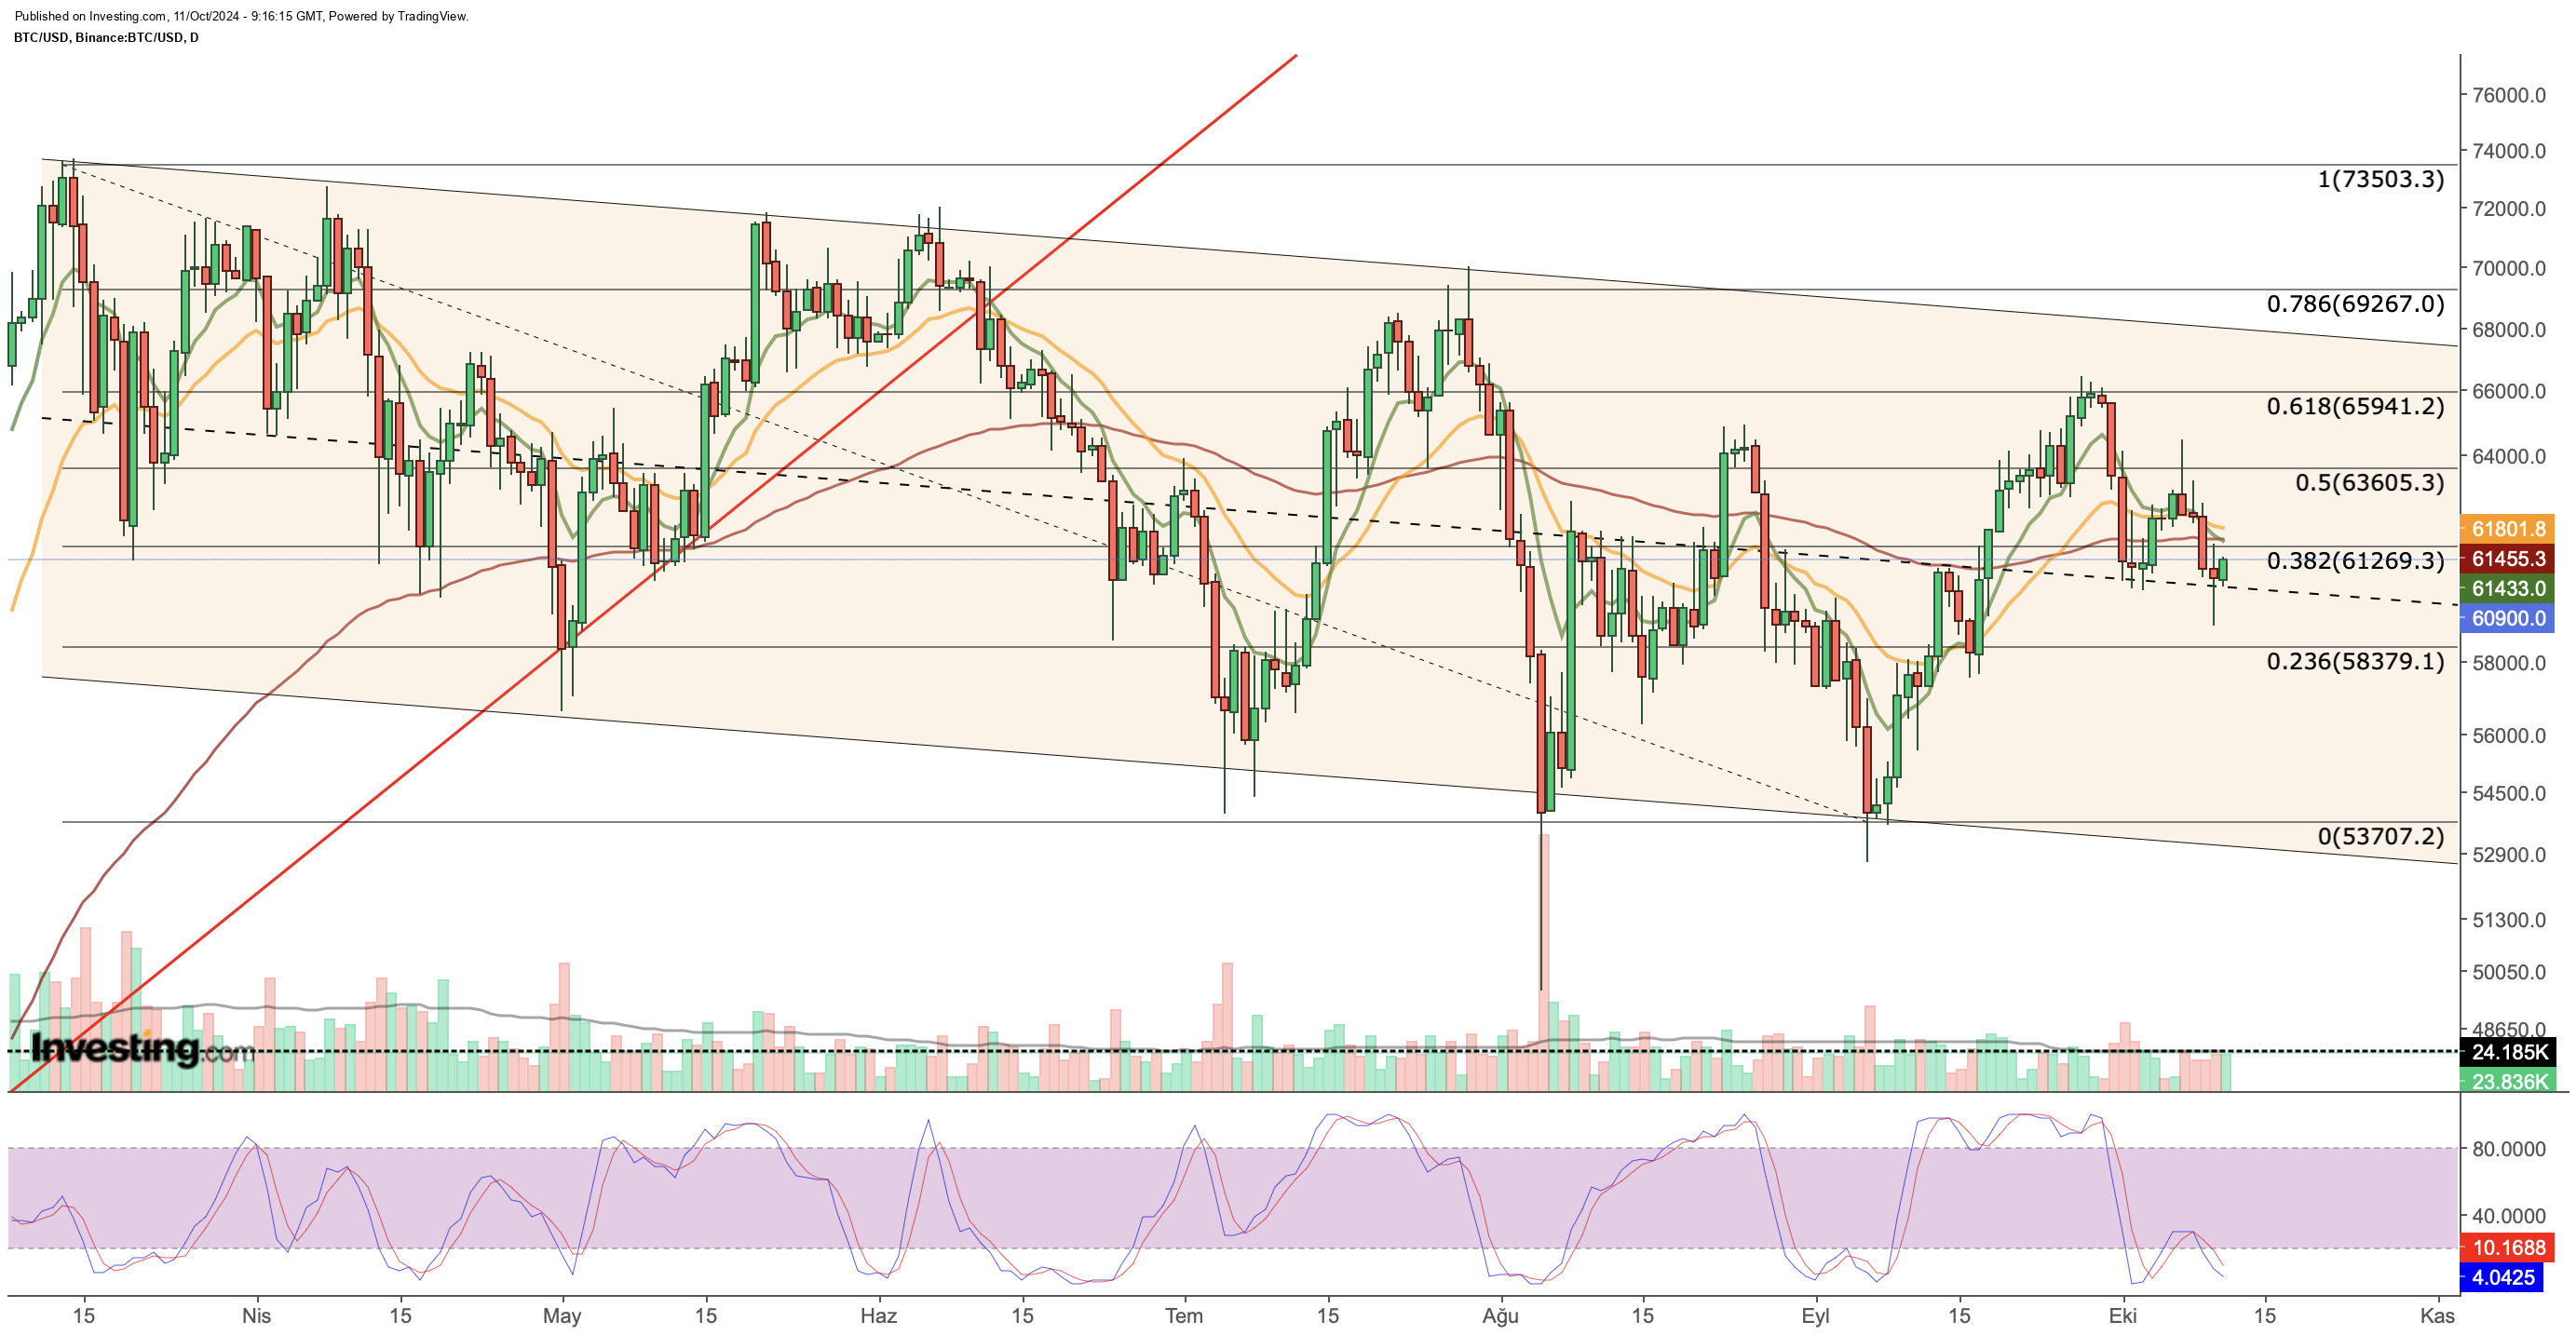
Current developments are tightening Bitcoin’s trading range. The recent recovery attempt has struggled to exceed $63,000, and the midline of the descending channel, in place since March, continues to act as a support zone.

However, technical indicators indicate that this support may be under pressure. On the daily chart, short-term exponential moving averages (EMAs) are trending downwards, with the 8 and 21-day EMAs dropping below the 3-month EMA.
If Bitcoin starts closing daily below $60,000, we could witness a negative EMA crossover, potentially mirroring patterns seen in June and August.
During those months, Bitcoin broke the midline of the descending channel twice, heading toward the channel’s lower band.
Should history repeat itself, Bitcoin might again find itself heading toward $53,000.
The price level that could attract buying interest below $60,000 appears to be around $58,300. Given the crypto market's rapid shifts, closely monitoring daily closes around these support levels is essential.
Key Levels to Watch in the Short Term
Despite the negative technical indicators, if Bitcoin can hold above the $60,000 level in the coming days, buyer support may increase.

In an upward scenario, the $61,400 to $61,800 range—where moving averages cluster—will serve as the first resistance zone. Surpassing this range could boost buyer volume and break the short-term downward trend, targeting higher levels.
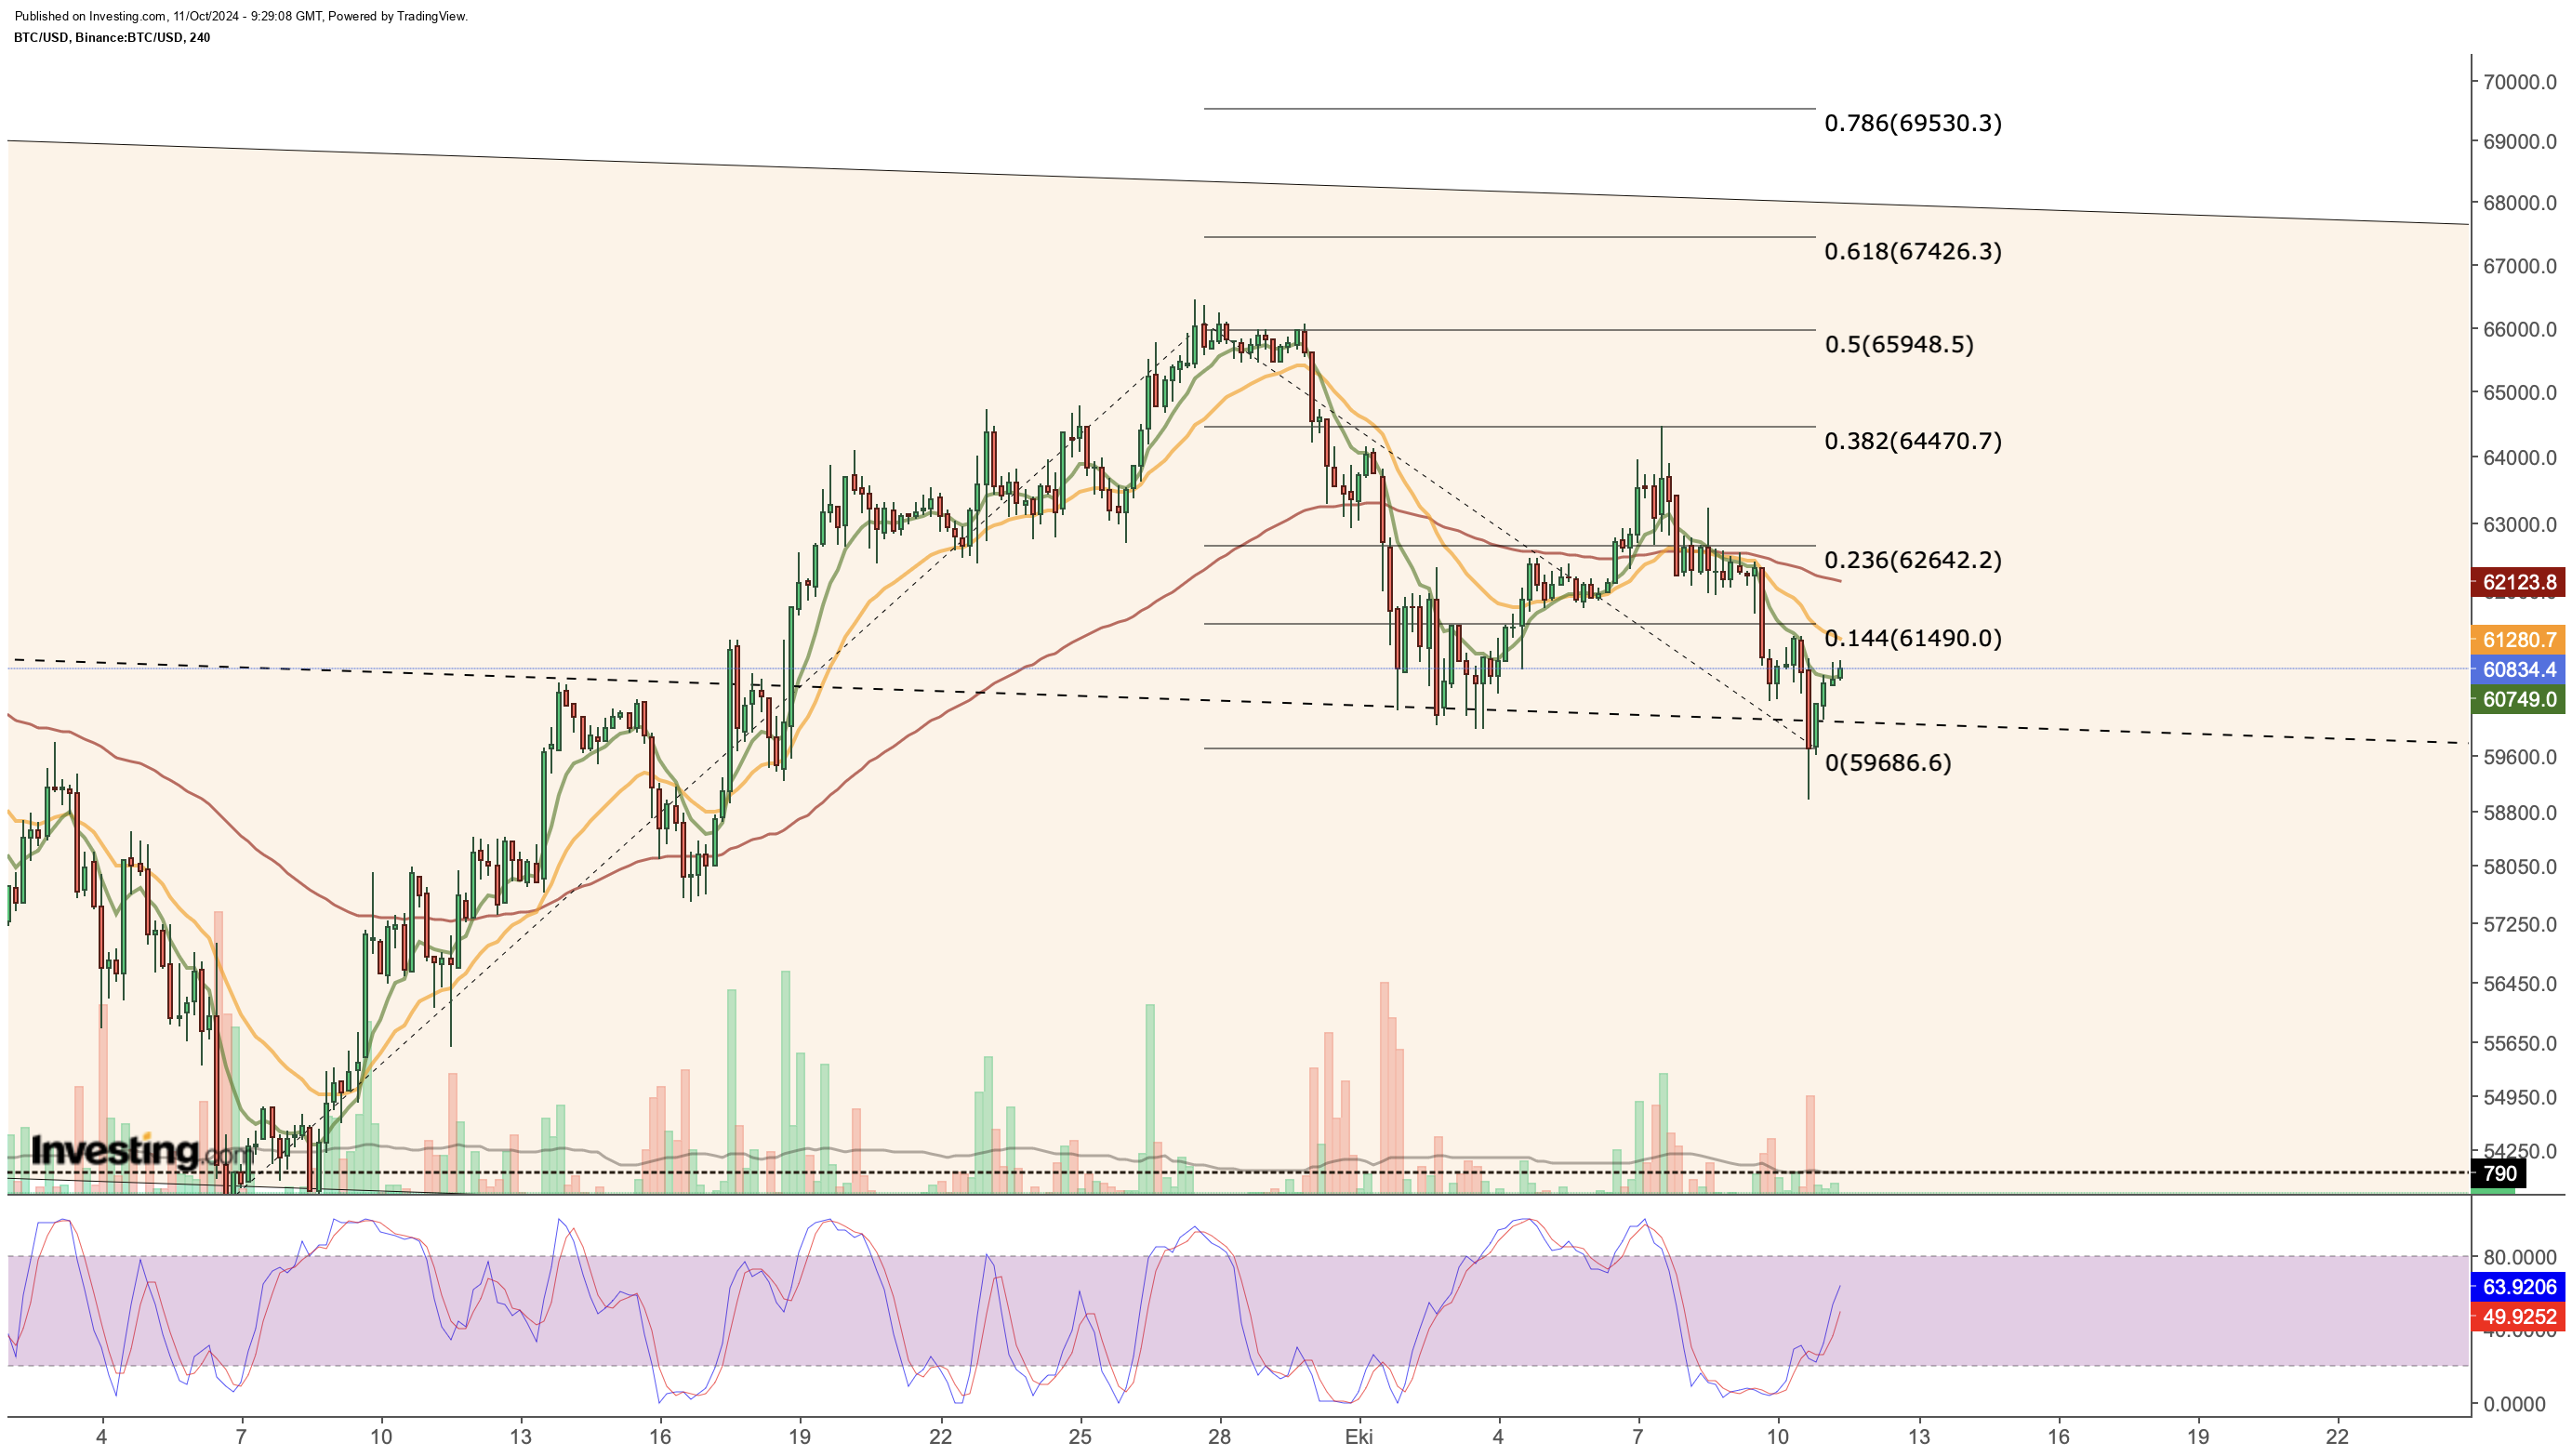
Let's delve deeper into the Bitcoin chart for short-term targets. In the 4-hour chart, we see that the downward trend following September's rise met resistance at the Fibonacci 0.5 level, around $58,900.
If this area holds firm, Bitcoin prices could see hourly closes above $61,500, with subsequent short-term targets set at $62,600, $64,400, and $67,400. However, as long as Bitcoin remains below $61,500, selling pressure is likely to persist.
***
Disclaimer: This article is written for informational purposes only; it does not constitute a solicitation, offer, advice, counsel or recommendation to invest as such it is not intended to incentivize the purchase of assets in any way. I would like to remind you that any type of asset, is evaluated from multiple perspectives and is highly risky and therefore, any investment decision and the associated risk remains with the investor.
