Chart Of The Day: Are Investors Overly Bullish?

Published 09/01/2020, 13:39
US500
-

We recently turned cautiously bullish after holding in our bearishness since the 2018 plunge that remained a hair's breadth away from a formal bear market.

However, signs have been mounting that perhaps investors have been lulled into a sense of complacency. We're also questioning our own recent bullishness, as we’re concerned investors are thinking only about the short term, despite increasing long-term risks.
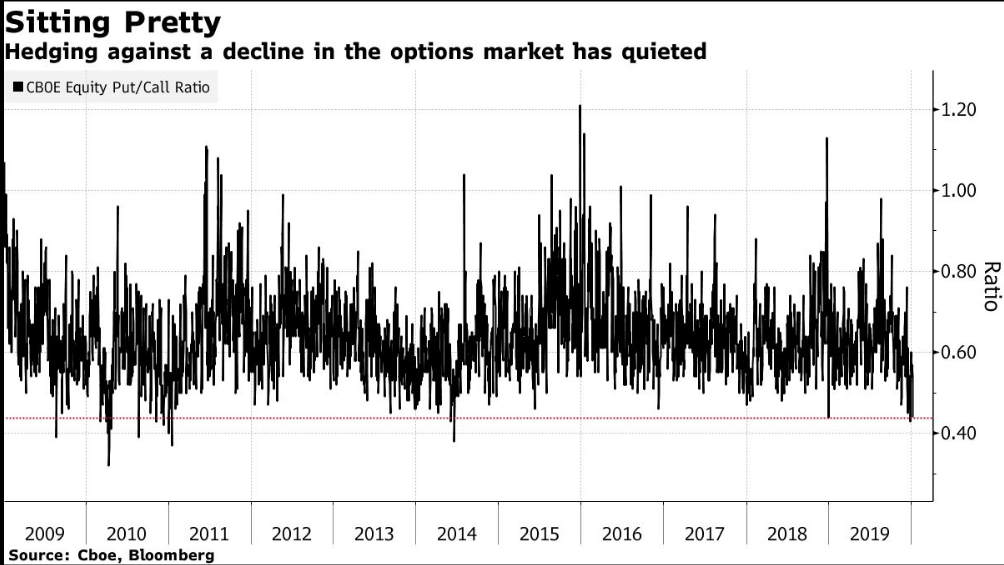
CBOE Equity Put to Call Ratio Chart

Bearish put options pricing has been dropping relative to call options, reaching extremely low levels, infrequently reached throughout this bull market.

The recent rally was spread among 82 of the companies listed on the S&P 500 Index who have been trading above their 200 DMAs – a two-year high. This suggests wide participation and when coupled with the lowest put/call ratio, we see a red flag.

Another gauge whose measure is extreme – and therefore potentially unsustainable – are ETFs. Traders seem to be placing many eggs in few baskets, overwhelmingly betting that the rally in equities will keep going.
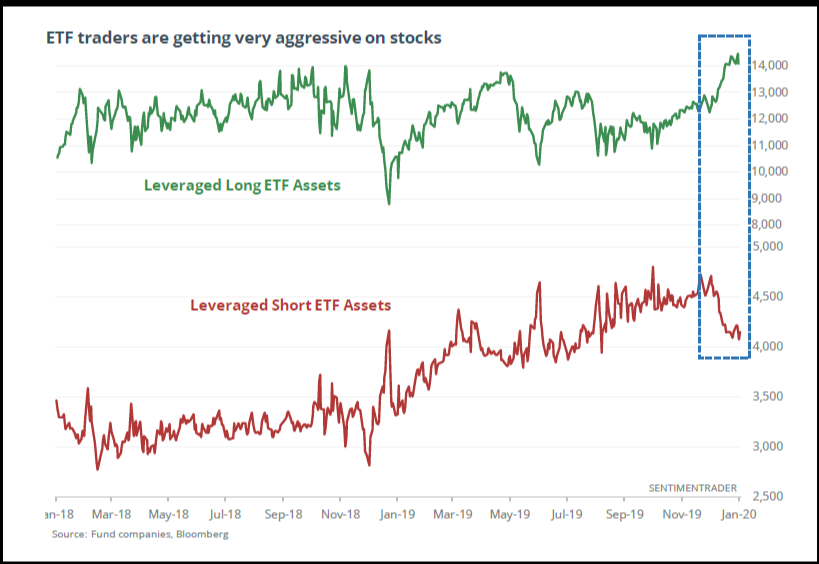
ETS Traders Aggressive on Stocks

As we can see in the chart, traders sharply increased leverage longs, while drastically dropping leveraged shorts, another sign of a potential herd mentality.
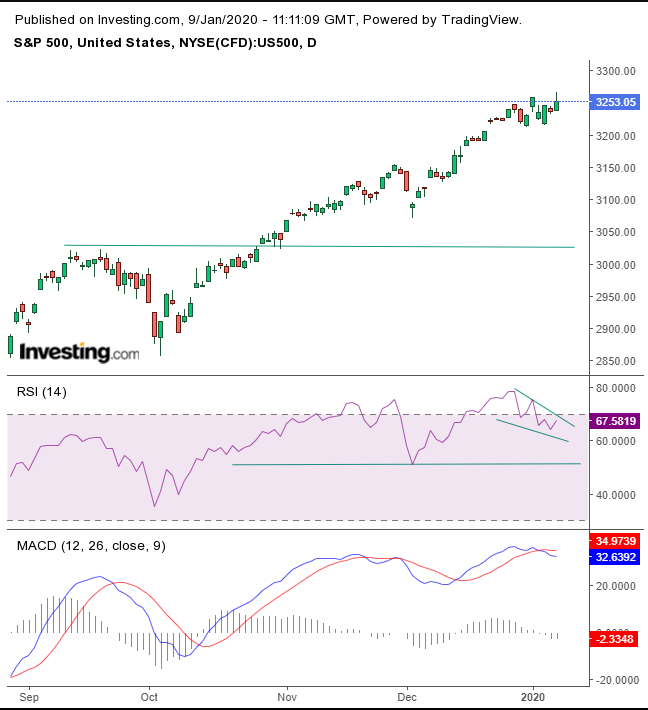
SP Daily Chart

While the price is headed toward a new record high, the RSI and MACD both provide negative divergences. If the RSI were to retest its previous low and break it, we could potentially see the price follow.

For the RSI, it’s the most overbought condition since January 2018, while for the MACD it’s the highest since February 2019.

Trading Strategies

Conservative traders would sit this out, as the trend is still up.

Moderate traders may risk a short with a close below 3,200, below the December lows.

Aggressive traders may risk a contrarian short position, providing they understand the risks and have prepared a trading plan accordingly.

Trade Sample

  • Entry: 3275
  • Stop-Loss: 3300
  • Risk: 25 points
  • Target: 3200
  • Reward: 75 points
  • Risk:Reward Ratio: 1:3
  • Latest comments

    Loading next article…
    Risk Disclosure: Trading in financial instruments and/or cryptocurrencies involves high risks including the risk of losing some, or all, of your investment amount, and may not be suitable for all investors. Prices of cryptocurrencies are extremely volatile and may be affected by external factors such as financial, regulatory or political events. Trading on margin increases the financial risks.
    Before deciding to trade in financial instrument or cryptocurrencies you should be fully informed of the risks and costs associated with trading the financial markets, carefully consider your investment objectives, level of experience, and risk appetite, and seek professional advice where needed.
    Fusion Media would like to remind you that the data contained in this website is not necessarily real-time nor accurate. The data and prices on the website are not necessarily provided by any market or exchange, but may be provided by market makers, and so prices may not be accurate and may differ from the actual price at any given market, meaning prices are indicative and not appropriate for trading purposes. Fusion Media and any provider of the data contained in this website will not accept liability for any loss or damage as a result of your trading, or your reliance on the information contained within this website.
    It is prohibited to use, store, reproduce, display, modify, transmit or distribute the data contained in this website without the explicit prior written permission of Fusion Media and/or the data provider. All intellectual property rights are reserved by the providers and/or the exchange providing the data contained in this website.
    Fusion Media may be compensated by the advertisers that appear on the website, based on your interaction with the advertisements or advertisers
    © 2007-2025 - Fusion Media Limited. All Rights Reserved.