Palantir launches Chain Reaction AI infrastructure platform with CenterPoint and NVIDIA
2020 hasn’t been kind to oil bulls. After the Jan. 6, $63.27 close, it’s been down hill all the way. But that’s only part of the picture.
Oil has been ranging since April 23, after notching up the $66.30 close, while the bottom of its trading pattern has been $50+. That congestion followed 2018's dismal performance, the worst year for black gold since 2015. From U.S. President Donald Trump's pressure on OPEC to shrink supply in order to keep prices down, to the U.S.-China trade war saga, the challenges to the oil markets have come thick and fast.
And now a potentially devastating global pandemic is looming. Not only is the coronavirus outbreak wreaking havoc on manufacturing, global shipping, airlines and tourism, it also creates a high risk that the trade deal comes undone. China will almost certainly not be able, or willing, to honor its obligations after spending so much money trying to rescue its economy from the ravages of the virus.
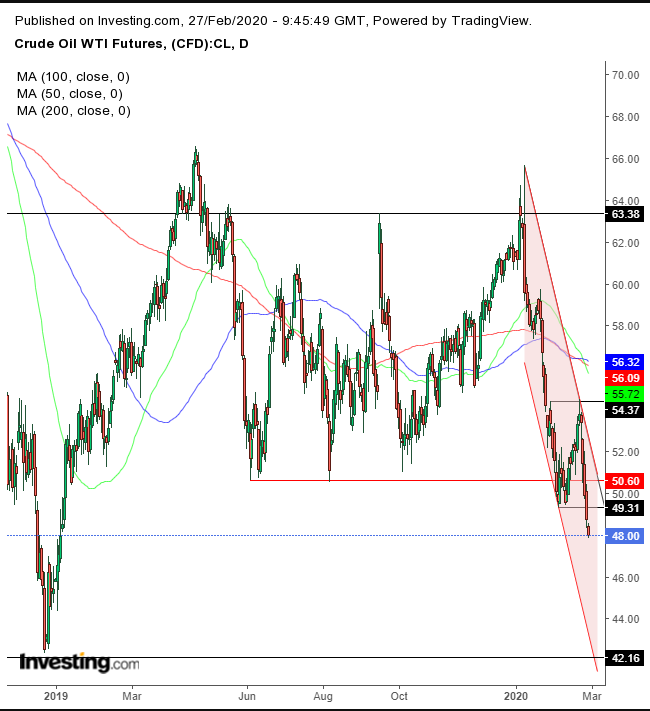
So, where does that leave oil? Its recent technical pattern suggests a $45 target and the longer range implies a target even lower than $40. However, we expect $42 to give a fair fight, a level that has been supporting the price since September 2016.
It’s interesting to note how a return toward $40 is now likely to be accepted as a legitimate target, while just a month ago it was hardly conceivable.

The range since Jan. 23 has been within $5 above $50, suggesting that the technical chain reaction will repeat the same distance to the downside, selecting an approximate target of $45.
However, the range from May 2019 provides at least a $13 rectangle, implying that the same mechanism would recreate itself below the $50 floor-turned-ceiling, indicating a target of under $40.
Nevertheless, we wouldn’t aim past the $42 level, which has proven itself a worthy support since September 2016.
Trade Strategies
Conservative traders should wait for the price to retest the $50 resistance, before committing to a short position.
Moderate traders would probably also wait for a pullback toward resistance, for a better entry, not necessarily to receive confirmation of said resistance.
Aggressive traders might enter a contrarian trade, with a measured stop-loss, as the price is likely to pull back before it continues lower.
Trade Sample - Aggressive Trade
