PPL Corp and subsidiaries extend credit facilities by one year
This article was written exclusively for Investing.com
- A late February multi-year high and pullback
- Sugar has been rallying since Apr. 1 – A higher high in July futures
- A recovery in oil supports sugar futures
- A stronger Brazilian currency is bullish for the sweet commodity
- If 2008 through 2011 is a model, sugar could be heading a lot higher
Sugar is a sweet commodity that is an essential ingredient in many of the foods we consume daily. While those sweet treats are part of our diets, too much of a good thing can be problematic. Added sugar intake leads to high blood pressure, inflammation, weight gain, diabetes, and fatty liver disease, all linked to an increased risk for heart attack and stroke.
In the US, added sugars account for up to 17% of the total calorie intake of adults and up to 14% for children. The global numbers are likely similar. Dietary guidelines suggest limiting added sugar to under 10% per day. Meanwhile, sugars are a vital energy source, with glucose being the most important for the body. The human body requires around 130 grams of sugar (glucose) each day to keep functioning.
Meanwhile, sugar is not only a food and energy source for the body; it is also the primary ingredient in ethanol in Brazil, the world’s leading producer and exporter of sugarcane.
Sugar is an essential raw material. Many countries worldwide, including the US and European Union, subsidize domestic sugar production as they view supplies as a national security matter. Sugar supplies come from two sources, sugarcane, which requires a tropical climate, and sugar beets, which can grow in other regions.
Sugar is a highly volatile agricultural product. Since the early 1970s, the sugar futures price has been as low as 2.29 cents and as high as 66 cents per pound. Since the turn of this century, the range has been from 4.62 to 36.08 cents per pound. At the 16.98 cents per pound level on the nearby July ICE sugar futures contract on Friday, Apr. 30, the price was below the average over the past two decades.
A late February multi-year high and pullback
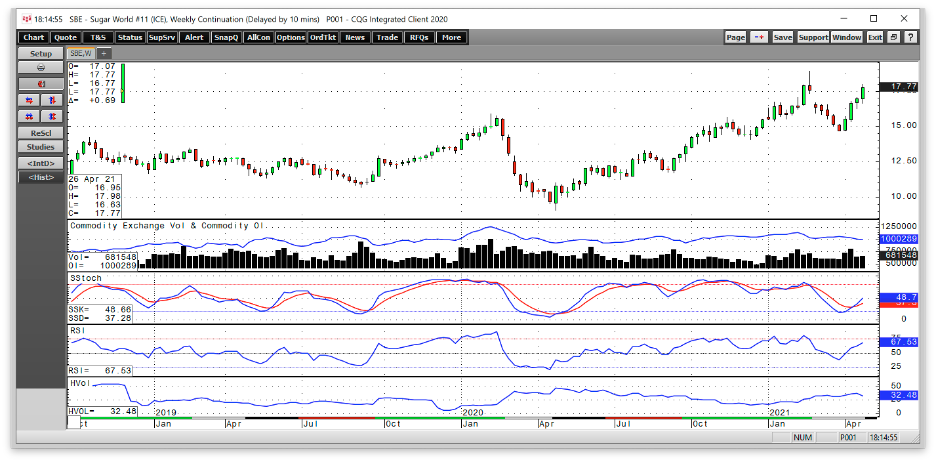
After making a bullish reversal on the weekly chart in late April 2020, sugar climbed steadily, making higher lows and higher highs until reaching the highest level in four years in late February 2021.

All charts courtesy of CQG
The weekly chart highlights the rise to 18.94 cents per pound during the week of Feb. 22 where the rally ran out of upside steam. Sugar reached its peak as March futures rolled to May in a backwardation where the nearby price traded at a premium to sugar for deferred delivery. Backwardation is a sign of nearby tight supplies.
The price corrected and probed below the 15 cents level, reaching a bottom at 14.67 cents per pound on Apr. 1.
After rallying back throughout April, price momentum and relative strength indicators crossed higher and were on either side of neutral conditions at the end of last week. Open interest, the total number of open long and short positions in the sugar futures market fell from 1,067,529 contracts the day sugar made its low on Apr. 1 to the 1,000,289 level as of the end of April. When the price of a futures market is rising declining open interest is not typically a technical validation of an emerging bullish trend.
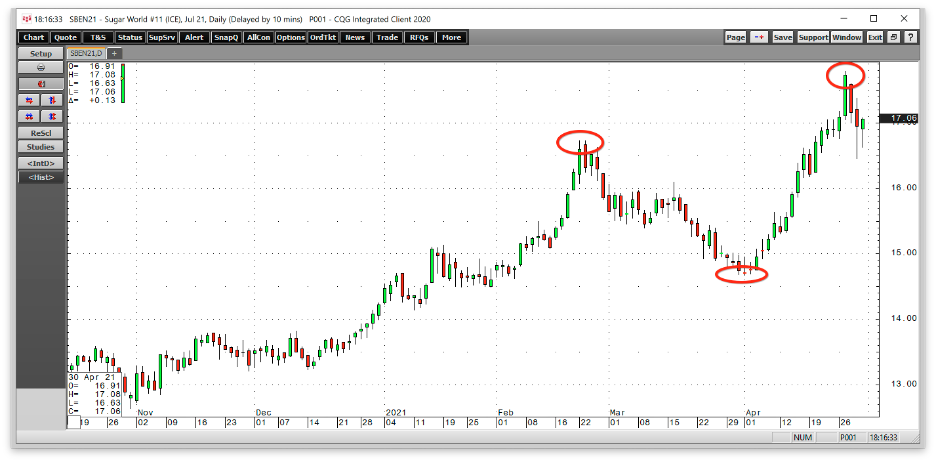
The pullback started after sugar made a double top on the July futures contract in late February.
Sugar has been rallying since Apr. 1 – A higher high in July futures
While the nearby contract reached almost 19 cents, the backwardation caused the July futures to peak at 16.73 cents in late February.
The daily chart illustrates that sugar’s high came on Feb. 22 and 23, forming a double top. The price fell throughout March, reaching the 14.67 cents bottom on Apr. 1. After moving higher throughout April and reaching a new and higher high at 17.05 cents on Apr. 22 and 23, surpassing the late February peak on July futures, but not near the continuous contract high from this year. The double top on Apr. 22 and 23 did not contain the price as it rose to 17.79 cents on Apr. 27 before correcting.
Meanwhile, several factors could negate the selloff at the end of April and falling open interest metric, and may propel sugar to challenge the 18.94 cents high and perhaps higher levels over the coming weeks and months.
A recovery in oil supports sugar futures
While sugar is a food, it is also the primary ingredient in biofuel in Brazil. The US is the world’s leading producer and exporter of corn. In the US, corn is ethanol’s input, while in Brazil, it is sugarcane. Higher gasoline prices push the price of biofuels to the upside. In the US, there is a mandate to blend ethanol with gasoline. In Brazil, many cars run only on biofuel.

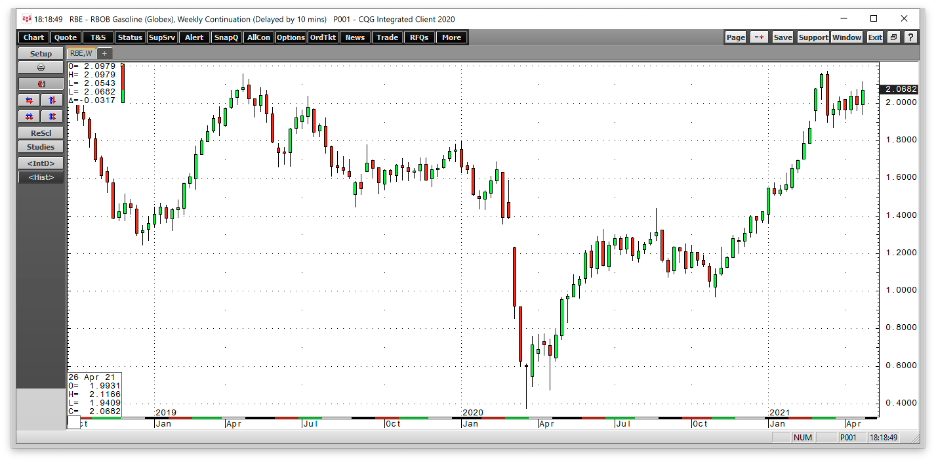
The chart of the continuous RBOB gasoline futures contract illustrates the rise from 37.6 cents per gallon wholesale in March 2020 to the recent high of $2.17 in March. Gasoline prices had been straddling the $2 per gallon level throughout April as the market consolidates the past year’s gains. They were just below the $2.07 level on Apr. 30. Long-term technical resistance stands at just below the $2.30 level, which could be a gateway to the $3 level. Gasoline demand in 2021 will be far higher than in 2020 as the vaccines create herd immunity to COVID-19.
