Five things to watch in markets in the week ahead

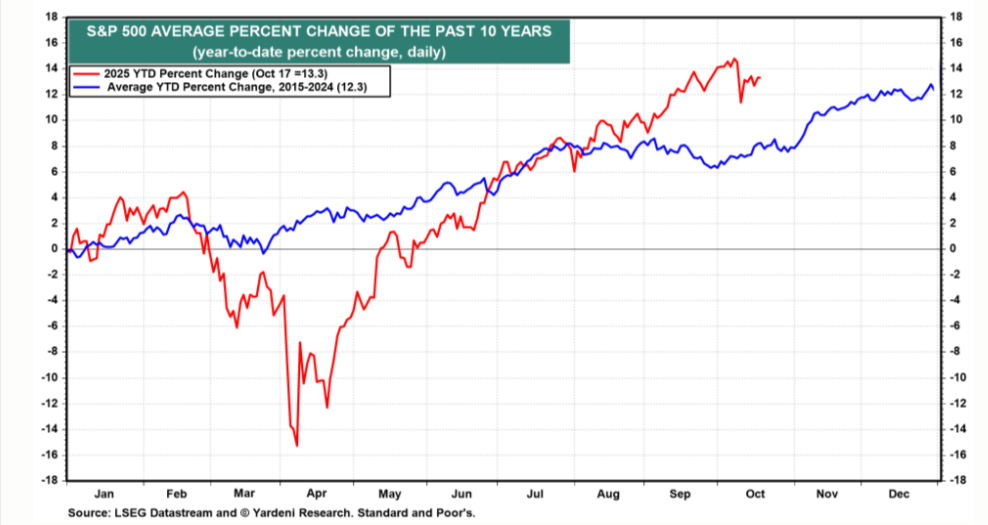
We’ve been monitoring the relationship between the S&P 500’s ytd performance versus its comparable average of the past 10 years (chart). This year, the index has been much more volatile than the average and has outperformed the average by about five percentage points since early August. Does this mean that the traditional Santa Claus rally started early this year and is over already? Over the past 10 years, the Santa rally has added about four percentage points to the average annual percentage gain of the S&P 500 during November and December.
Much will depend on investors’ assessments of the credit markets. They were spooked last week (just ahead of Halloween) by news that Zions Bancorp incurred a $50 million charge-off in Q3 due to legal actions against two borrowers. Stock prices dropped sharply on Thursday, led by the KBW Regional Banking ETF (chart).

Investors have also been spooked by fears of trouble in the private credit market since First Brands filed for Chapter 11 bankruptcy protection on September 29, 2025, disclosing liabilities of between $10 billion and $50 billion and assets in the range of $1 billion to $10 billion. ETFs tracking the private credit market tumbled during September and are lower than the “Annihilation Days” which followed the April 2 “Liberation Day.”
On the other hand, ETFs that track the high-yield and investment-grade corporate bond markets have held up well so far this year and so has an ETF tracking senior loans (chart).

We don’t expect credit problems that will add up to serious systemic risk of an economy-wide credit crunch, which has often caused recessions in the past. We are encouraged to see that the Fed’s data on commercial banks’ loan-loss reserves remains relatively stable so far this year (chart).

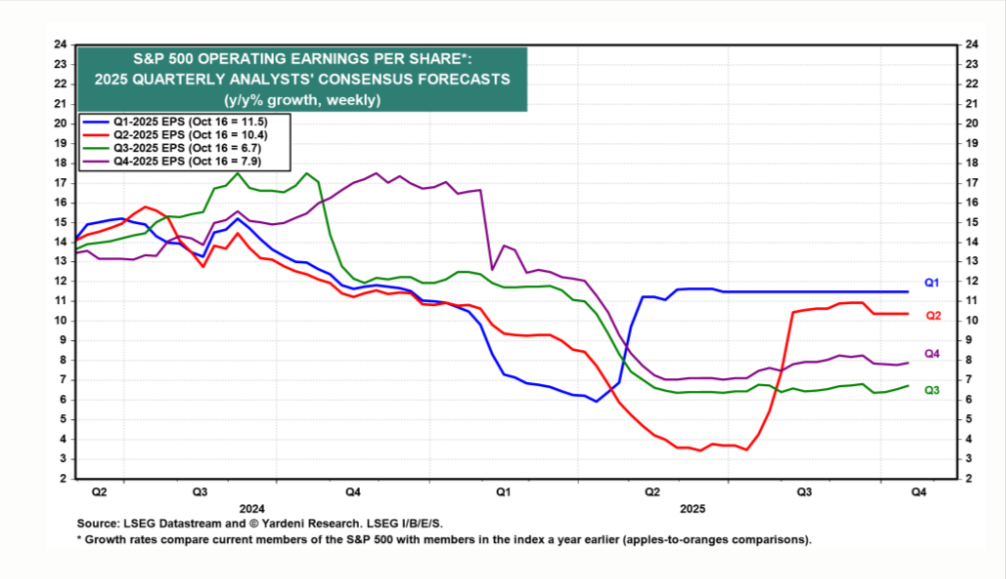
We also continue to be encouraged by the strength of S&P 500 companies’ collective earnings per share. They beat expectations significantly during Q1 and Q2 (chart). We expect they did do so again during Q3. Industry analysts are currently expecting a 6.7% y/y increase. We expect a 10.0% gain.
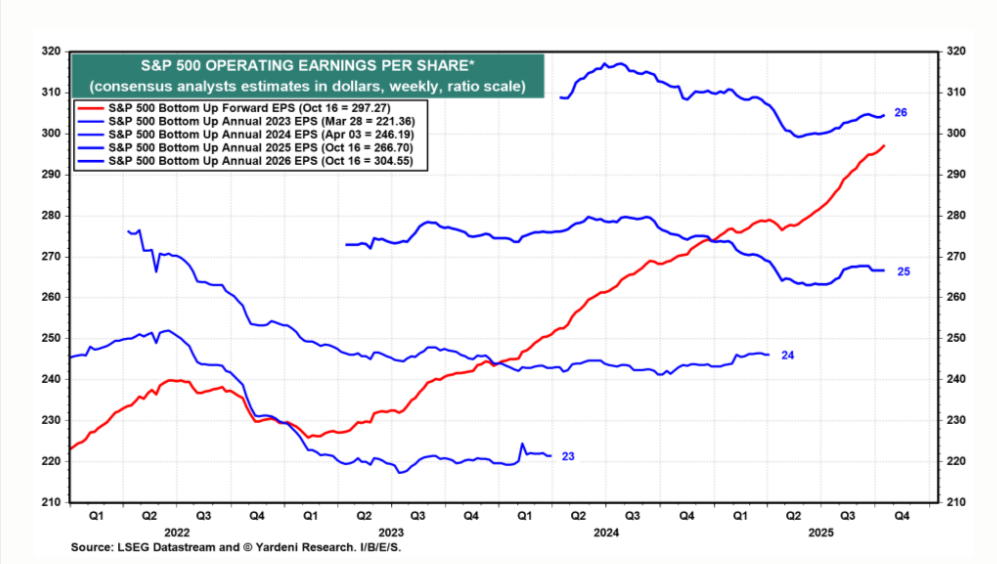
S&P 500 forward earnings per share rose to yet another record high last week, of $297.27; it has rapidly been converging toward analysts’ 2026 consensus expectation, currently at $304.55, which it will match at year-end (chart). The current forward P/E—i.e., the multiple using forward earnings as the “E”—is 22.4.
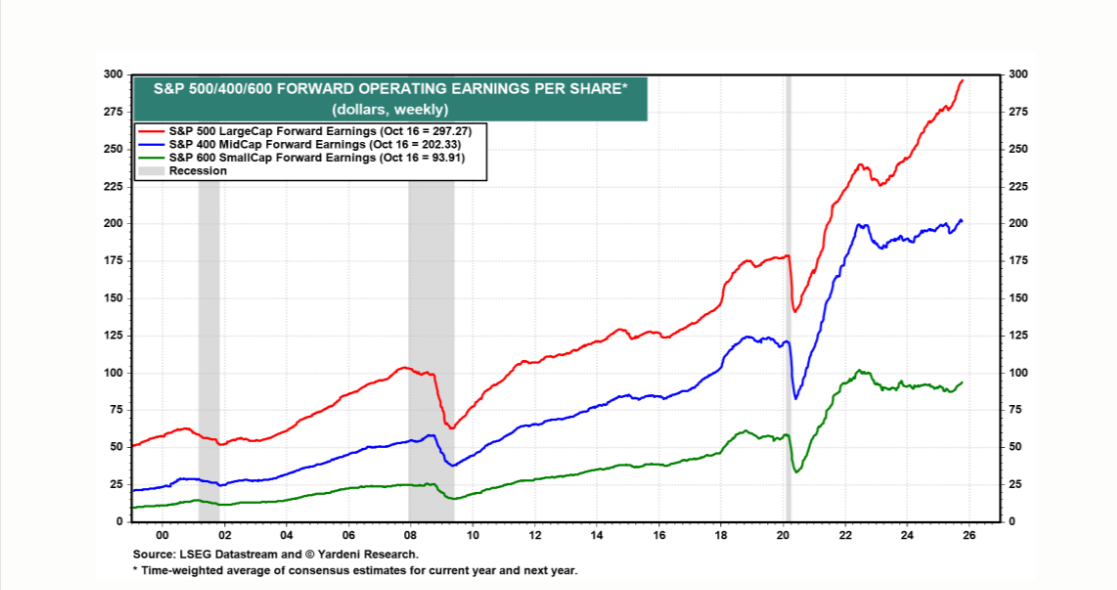
The recovery in the forward earnings of the S&P 400 MidCaps and S&P 600 SmallCaps remains disappointing compared to that of the S&P 500 (chart).