Microsoft sued by Australia competition regulator over Copilot, 365 pricing

Market Context & Structure
The E-mini S&P 500 Futures is trading at 6450.00 (-0.30%), locked inside a delicate balance zone after the August 7 swing high at 6508.75. The market has since oscillated around the VC PMI weekly mean at 6456, a critical equilibrium point aligning with the 38.2% Fibonacci retracement of the most recent rally.
This structure reflects a market wrestling with equilibrium, where both buyers and sellers are testing conviction inside the 6442–6456 price band. A decisive breakout from this zone is likely to determine the trajectory into the next cycle window.
360-Day Gann Cycle Anchor (9/28/24)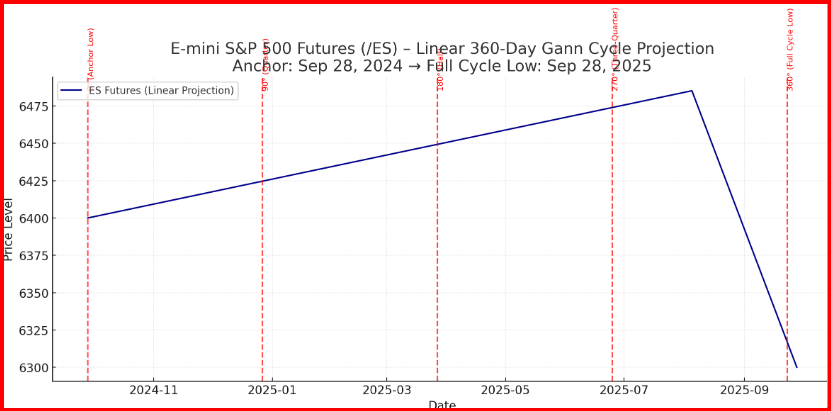
We anchor the long-term cycle to September 28, 2024, a major pivot low that began the current yearly rotation. In Gann methodology, a 360-day cycle represents a full “circle of time,” with harmonic divisions providing forward-looking pivot windows.
- 90° (Quarter Cycle): Late Dec 2024 – Early Jan 2025
Produced a corrective low and subsequent rally. - 180° (Half Cycle): Late March 2025
Defined a mid-cycle top, which transitioned into the corrective phase of Q2. - 270° (Three-Quarter Cycle): Late June 2025
Marked a secondary low that fueled the summer advance into the August highs. - 360° (Full Cycle Completion): September 28, 2025
We are now entering the final 40-day stretch into the annual cycle low window, due in late September.
This suggests that the market is in its maturing stage of the cycle, where rallies become fragile, and corrective pressures dominate until a final washout is achieved.
Technical Alignment (VC PMI & Fibonacci)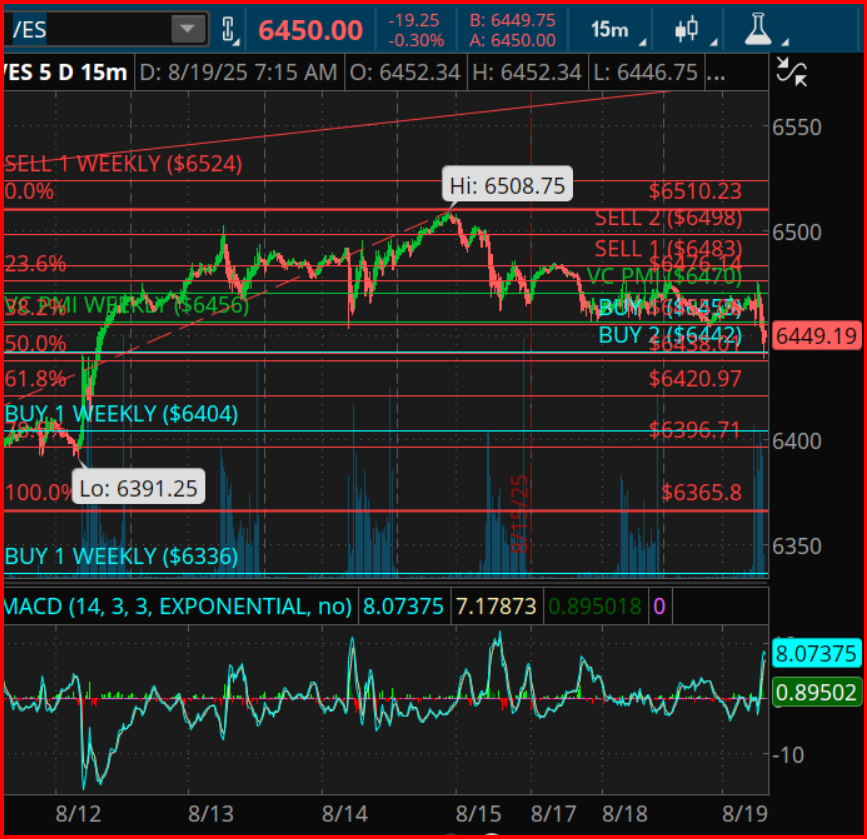
- Weekly Sell 1: 6524 → tested and rejected.
- VC PMI Weekly Mean: 6456 → current pivot equilibrium.
- Weekly Buy 1: 6404 → near-term support.
- Weekly Buy 2: 6336 → major cycle low support zone.
Fibonacci retracements reinforce these levels:
- 38.2%: 6456 (VC PMI overlap).
- 50%: 6442 (currently tested intraday).
- 61.8%: 6420.97 (next major support).
This tight clustering of Fibonacci and VC PMI levels within a 40-point range underscores the critical nature of 6420–6456 as the battleground into September.
Momentum (MACD)
The MACD shows a tentative bullish crossover (8.07 vs 7.17), but momentum remains fragile. Without a decisive close above 6456, this signal risks failure, reinforcing the probability of further mean reversion toward 6404–6336 before cycle completion.
Forward-Looking Projection
- Bullish Scenario: Sustained trade above 6456 could spark a recovery toward 6498–6510, but this would likely represent a countertrend rally within a larger corrective cycle.
- Bearish Scenario: Failure below 6442–6420 increases probability of a direct test of 6404 and potentially 6336, aligning with the cycle low window due late September.
Conclusion
The E-mini S&P 500 is trading at a time–price confluence where VC PMI equilibrium (6456), Fibonacci harmonics, and the 360-day Gann cycle converge. The cycle framework suggests that the market is in the final descending phase into the September 28, 2025 cycle low.
Until then, rallies are vulnerable to selling pressure, and the probability favors downside retests of 6420 → 6404 → 6336 before a durable bottom is formed.
***
TRADING DERIVATIVES, FINANCIAL INSTRUMENTS AND PRECIOUS METALS INVOLVES SIGNIFICANT RISK OF LOSS AND IS NOT SUITABLE FOR EVERYONE. PAST PERFORMANCE IS NOT NECESSARILY INDICATIVE OF FUTURE RESULTS.