Novo Nordisk, Eli Lilly fall after Trump comments on weight loss drug pricing

Technical Structure: The Double Top at 6500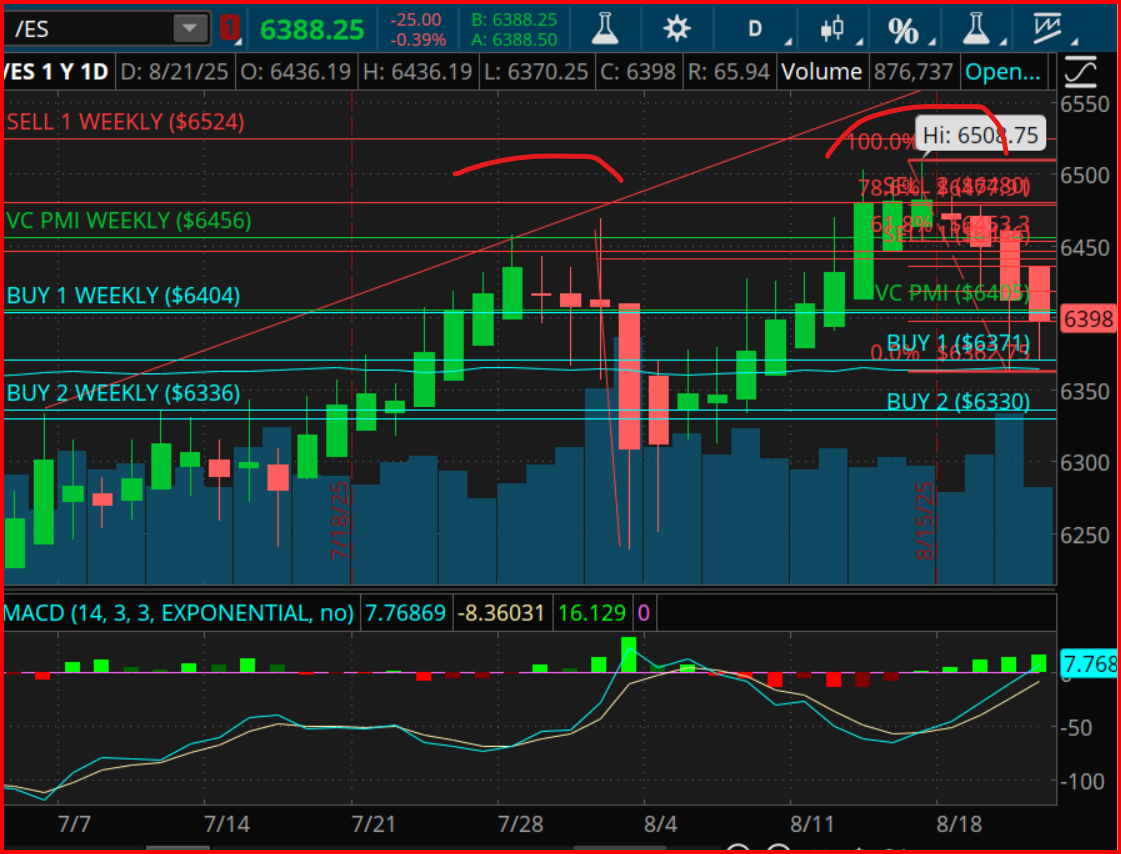
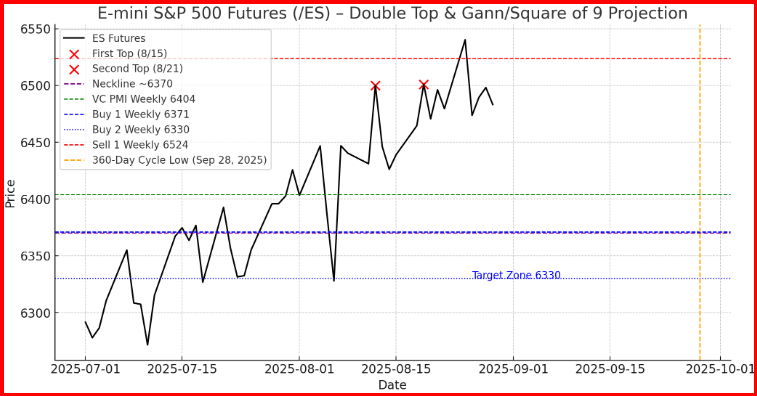
The chart is displaying one of the most recognizable reversal formations in classical technical analysis — the double top.
- On August 15, 2025, /ES reached a high near 6500, a level coinciding with the Fibonacci 100% extension and above the VC PMI Sell 1 Weekly ($6524) resistance zone. The rally was rejected, leading to a corrective pullback.
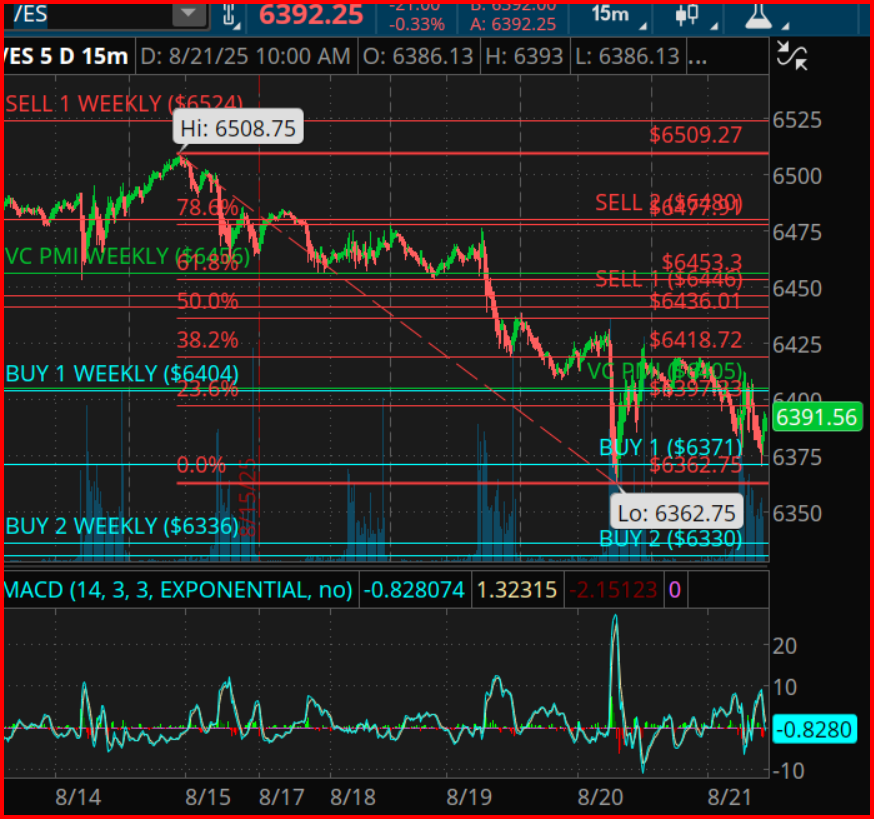
- On August 21, 2025, the market made another attempt at the same region, marking a high of 6500.75. Once again, sellers stepped in, preventing a decisive breakout.
- The fact that the second peak failed to exceed the first suggests that buyers are exhausted, and supply is overwhelming demand at this level.
The neckline support lies near 6370–6375, precisely at the BUY 1 Weekly level and Fibonacci 38.2% retracement zone. A sustained close below this neckline would confirm the double top, unleashing bearish momentum toward deeper retracement targets at 6330–6240.
VC PMI Framework: Neutral to Bearish Bias
The Variable Changing Price Momentum Indicator (VC PMI) lays out a clear probabilistic map:
- VC PMI Weekly = $6404 → this pivot has flipped from support to resistance after the August 21 rejection. Unless price reclaims and closes above this level, the market holds a neutral-to-bearish bias.
- Buy 1 Weekly = $6371 → the critical neckline. If breached, probability sharply increases for a move toward the Buy 2 Weekly = $6330 target.
- Sell 1 Weekly = $6524 → remains the ceiling of the advance. A weekly close above this would invalidate the topping structure and reopen the path toward new highs.
At present, the probability distribution favors a continuation lower unless bulls can defend the neckline.
Momentum and Market Psychology
The MACD oscillator highlights weakening bullish momentum:
- Histogram bars are shrinking, signaling a loss of upside velocity.
- The fast line has begun curling lower, hinting at a possible bearish crossover.
This aligns with market psychology: after weeks of steady gains from July into August, buyers are fatigued at resistance, while sellers see value in pressing the downside.
Gann Time Cycles: August Tops and September Bottoms
Gann’s framework gives additional weight to this reversal:
- The August 21–22 window aligns with a 90° (1/4 cycle) harmonic from the August 7 swing high, a classic turning point cluster.
- Looking further out, the 360-day cycle that began on September 28, 2024, projects to bottom around September 28, 2025. With less than six weeks to go, the probability increases that the August 21 top is the final crest before a cycle low washout.
- Historically, these 360-day cycle lows tend to be sharp, accelerated declines that flush weak longs before a major reversal.
Thus, time and price are converging toward a bearish setup into late Q3 2025.
Square of 9 Vibrational Analysis
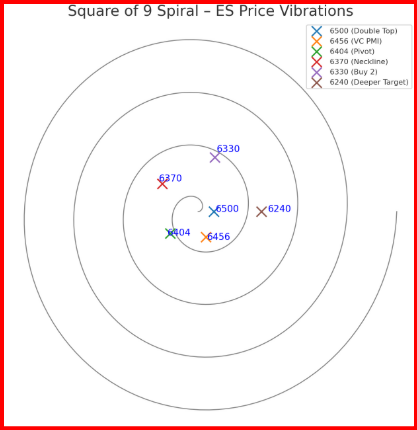
The Square of 9 adds yet another dimension of confirmation:
- The 6500 price level resonates with vibrational angles connected to prior pivot highs, reinforcing its significance as resistance.
- The projected 6370 neckline aligns with a Square of 9 vibration near 270°, symbolizing a potential “turning down” point in the cycle.
- The 6330 zone aligns with 315° in the spiral, often marking exhaustion points where reversals can form.
This vibrational map supports the idea that price will gravitate toward 6330 into September, completing the harmonic turn.
Strategic Implications
- Bearish Scenario (Higher Probability):
If /ES closes below 6370, expect a measured move toward 6330–6240 into the September 28 cycle low. This would confirm the double top and shift market tone decisively bearish. - Bullish Reversal (Lower Probability):
If /ES reclaims 6456–6524 and closes above, the double top would be negated, opening the path toward new highs. However, given cycle positioning, this outcome is less likely. - Tactical Approach:
Traders can look for short entries on failed rallies below 6450 with stops above 6525, targeting the 6330 zone initially. Long setups may re-emerge after the projected cycle low in late September.
Summary
The E-mini S&P 500 is at a critical juncture. The August 21 rejection at 6500.75 may well mark a final double top in this leg of the bull run. With VC PMI levels tilting bearish, MACD momentum fading, and Gann’s 360-day cycle pointing to a late-September low, the probability favors a downward acceleration toward the 6330–6240 zone before a larger cyclical reversal.
The market has written its message clearly: 6500 is the ceiling, 6370 is the trapdoor, and September may bring the flush.
***
TRADING DERIVATIVES, FINANCIAL INSTRUMENTS AND PRECIOUS METALS INVOLVES SIGNIFICANT RISK OF LOSS AND IS NOT SUITABLE FOR EVERYONE. PAST PERFORMANCE IS NOT NECESSARILY INDICATIVE OF FUTURE RESULTS.