S&P 500 jumps as tech rallies as investors eye end of government shutdown
- Predicting the stock market is impossible, and even dominant players can fall from grace eventually
- History has shown that new technological trends, or revolutions often lead to disappointment in the long run
- Ultimately, the best investment strategy is to focus on long-term performance and build a diversified portfolio
Investors often find themselves overly concerned about predicting the market's direction. Here's a little secret: Nobody can truly forecast where the market is headed, and it's a factor beyond our control.
It's not even guaranteed that today's dominant players, who are performing exceptionally well, will maintain their leadership in the years to come.
Clinging to such beliefs can be detrimental to our financial well-being. Take, for instance, the frantic rush into artificial intelligence, which has propelled the valuations of companies at the forefront of this impending revolution to unprecedented levels.
Many ponder whether this time is genuinely different. And there's no denying that we're at a pivotal moment in every industry's evolution.
But history is replete with such junctures, so be cautious about assuming that it's the first time this is happening, and as a wise investor, try not to get caught up in the hype.
Source: Man Numeric
A fascinating study conducted by Man Numeric, spanning back to the 1960s, examined the top 100 stocks in the S&P 500 by market capitalization weight at the end of each decade.
Surprisingly, it revealed that many of the leaders from the previous decade did not maintain their prominence in the following decades. Thus, achieving exceptionally high valuations in the short term doesn't guarantee long-term success.
With the exception of the decade since 2010, the top stocks have more or less remained the same, with major players becoming somewhat entrenched, accounting for about 54% of the market weight among the top 100Wewe can glean from this dats the importance of applying it to our investment strategy.
Recently, Christine Lagarde reiterated the 2% target and left the door open for further interest rate hikes (depending on future data) after raising the ECB's three benchmark interest rates by 25 basis points.
Interest rates on main refinancing operations, marginal lending operations, and deposits with the central bank have been raised to 4.50%, 4.75%, and 4.00%, respectively, starting from September 20, 2023.
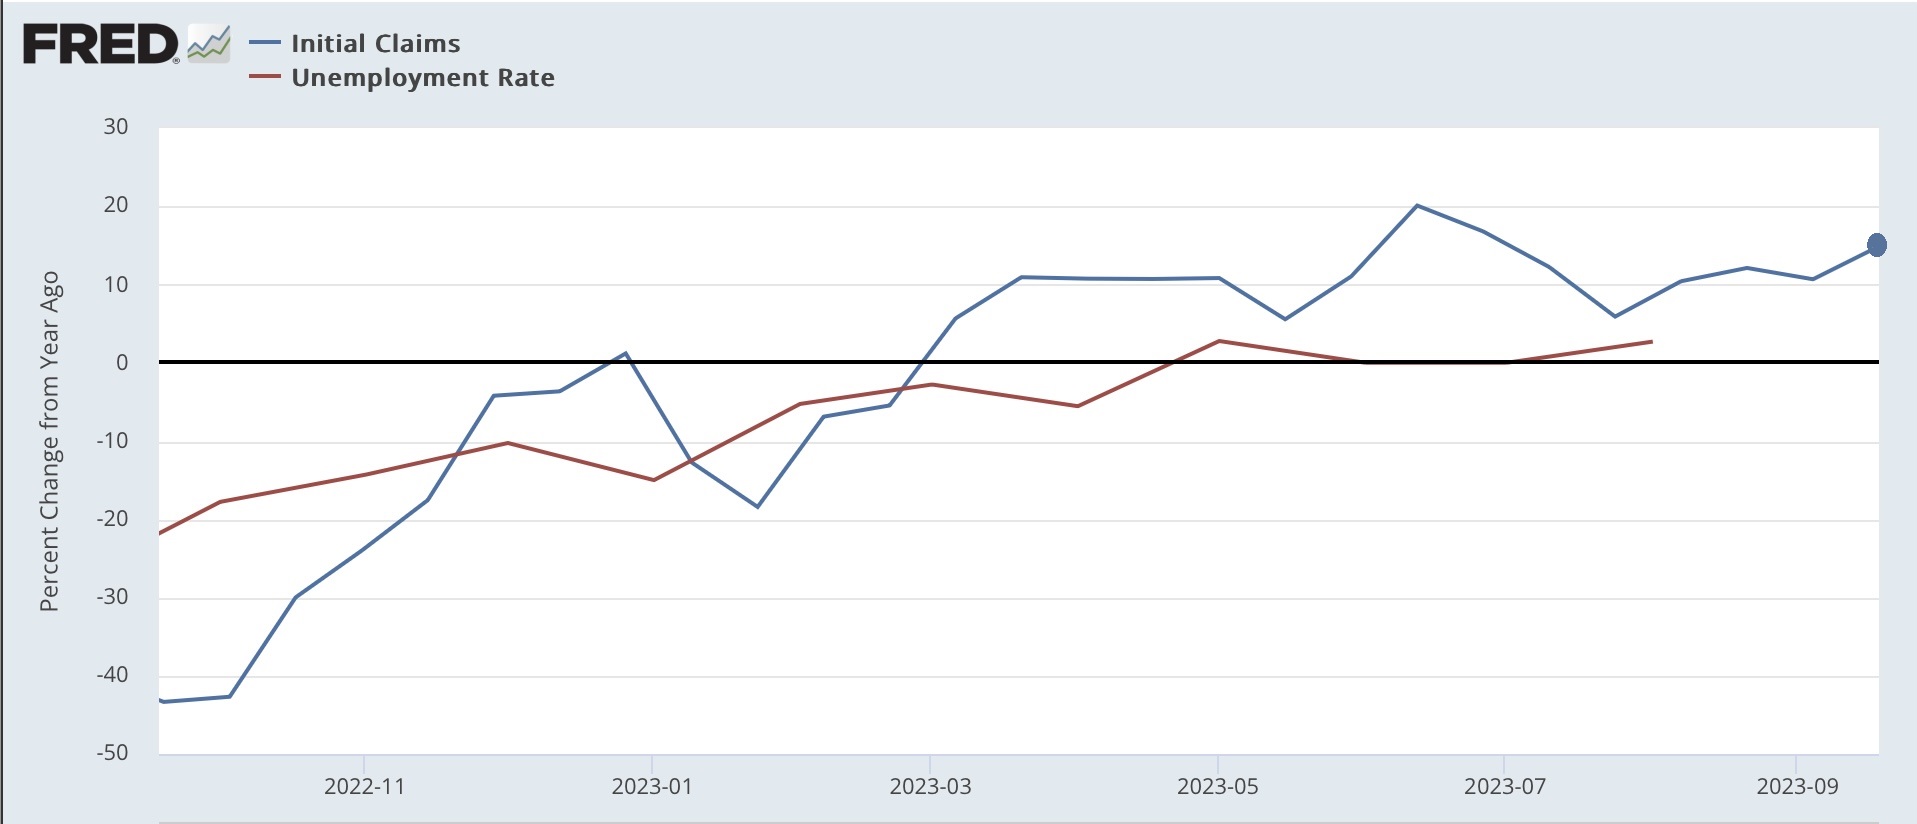
In the US, initial jobless claims (blue line in the chart below) saw a slight uptick to 220,000, while the 4-week average (red line) decreased to 224,500 (a drop of 5,000).
Continuing claims (yellow line) increased by 4,000 to reach 1.688 million. Year-over-year, these claims rose by 14.6%, 11.8%, and 29.6%, respectively. Source: US Bureau of Statistics
When looking at the monthly percentage change in the unemployment rate, it has increased by 14.8%. If this trend were to continue at the same rate, it would suggest that the unemployment rate could reach 4 percent in the upcoming months. Source: US Bureau of Statistics
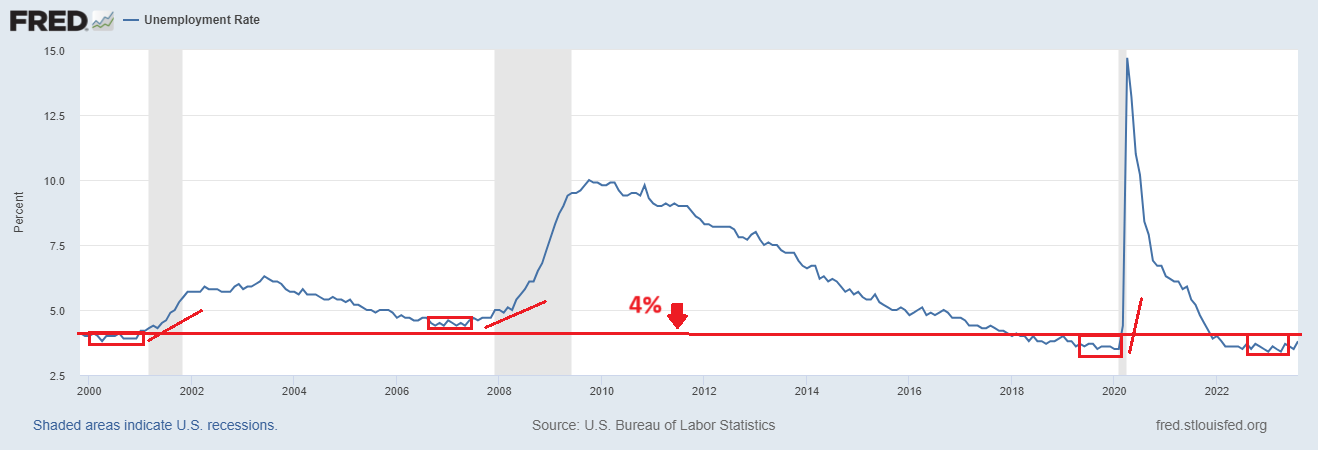
There is a clear upward trend, and we might be close to seeing Sahm's rule play out. This rule suggests that when the quarterly moving average of the unemployment rate increases by 0.5% from the previous 12-month low, it often indicates that the economy is heading into a recession.  Source: US Bureau of Statistics
The charts clearly illustrate how unemployment tends to reach a cyclical low before a recession and then sharply rises above 4%. Currently, it stands at 3.8%, after being at levels similar to the lows seen over the past 50 years.
Conclusion
Looking ahead, regardless of the possibility of a recession in the coming months, the most effective strategy is to focus on long-term performance.
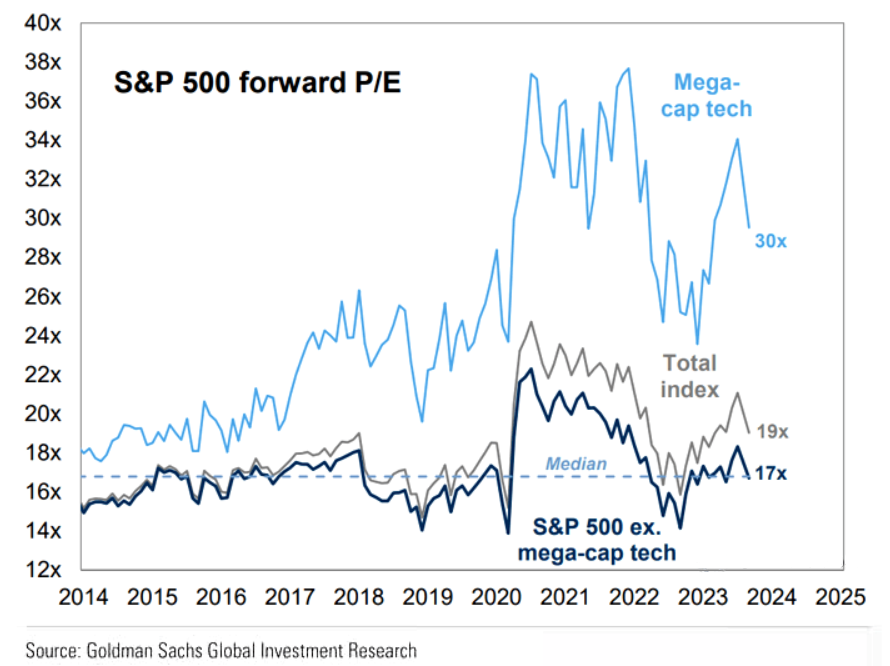
Short-term fluctuations might seem important, but it's the returns over a medium to long time frame that truly matter. While choosing stocks we like might seem straightforward, effectively managing risk in hindsight becomes complicated if we don't have a clear definition of our investment time frame.

Source: Goldman Sachs
So, will the market follow its historical patterns?
Perhaps, but it's also possible that this time could be different. Nevertheless, history teaches us that enthusiasm for new technologies, high valuations, and short-term parabolic trends often lead to disappointment in the long run when expectations are exceedingly high. Ultimately, it all tends to revert to the mean.
***
Disclaimer: This article is written for informational purposes only; it does not constitute a solicitation, offer, advice, or recommendation to invest as such it is not intended to incentivize the purchase of assets in any way. I would like to remind you that any type of asset, is evaluated from multiple points of view and is highly risky and therefore, any investment decision and the associated risk remains with the investor.

