IonQ CRO Alameddine Rima sells $4.6m in shares
- The US dollar has reached a two-month high.
- Key market movers this week include the PCE inflation data and comments from Fed officials.
- The euro struggles amid political uncertainty in Europe, while gold prices await US inflation data.
- InvestingPro Summer Sale is on: Check out our massive discounts on subscription plans!
The US dollar continued its three-week climb, reaching a two-month high against six major currencies. This strength comes amid a resilient U.S. economy, fueled by hawkish statements from the Federal Reserve and a dovish stance from other central banks. Political uncertainty in Europe, particularly in France, adds further pressure to the euro and bolsters the dollar.
This week, investors remain focused on clues regarding U.S. interest rate policy. The most critical data point will be the PCE inflation data, closely monitored by the Fed. Additionally, comments from Fed officials could significantly impact market sentiment.
Beyond Friday's PCE release, data throughout the week, including consumer confidence, revised first-quarter GDP, and unemployment claims, could also influence the direction of the dollar index.
Dollar Index Eyes Key Resistance After Weekly Dip
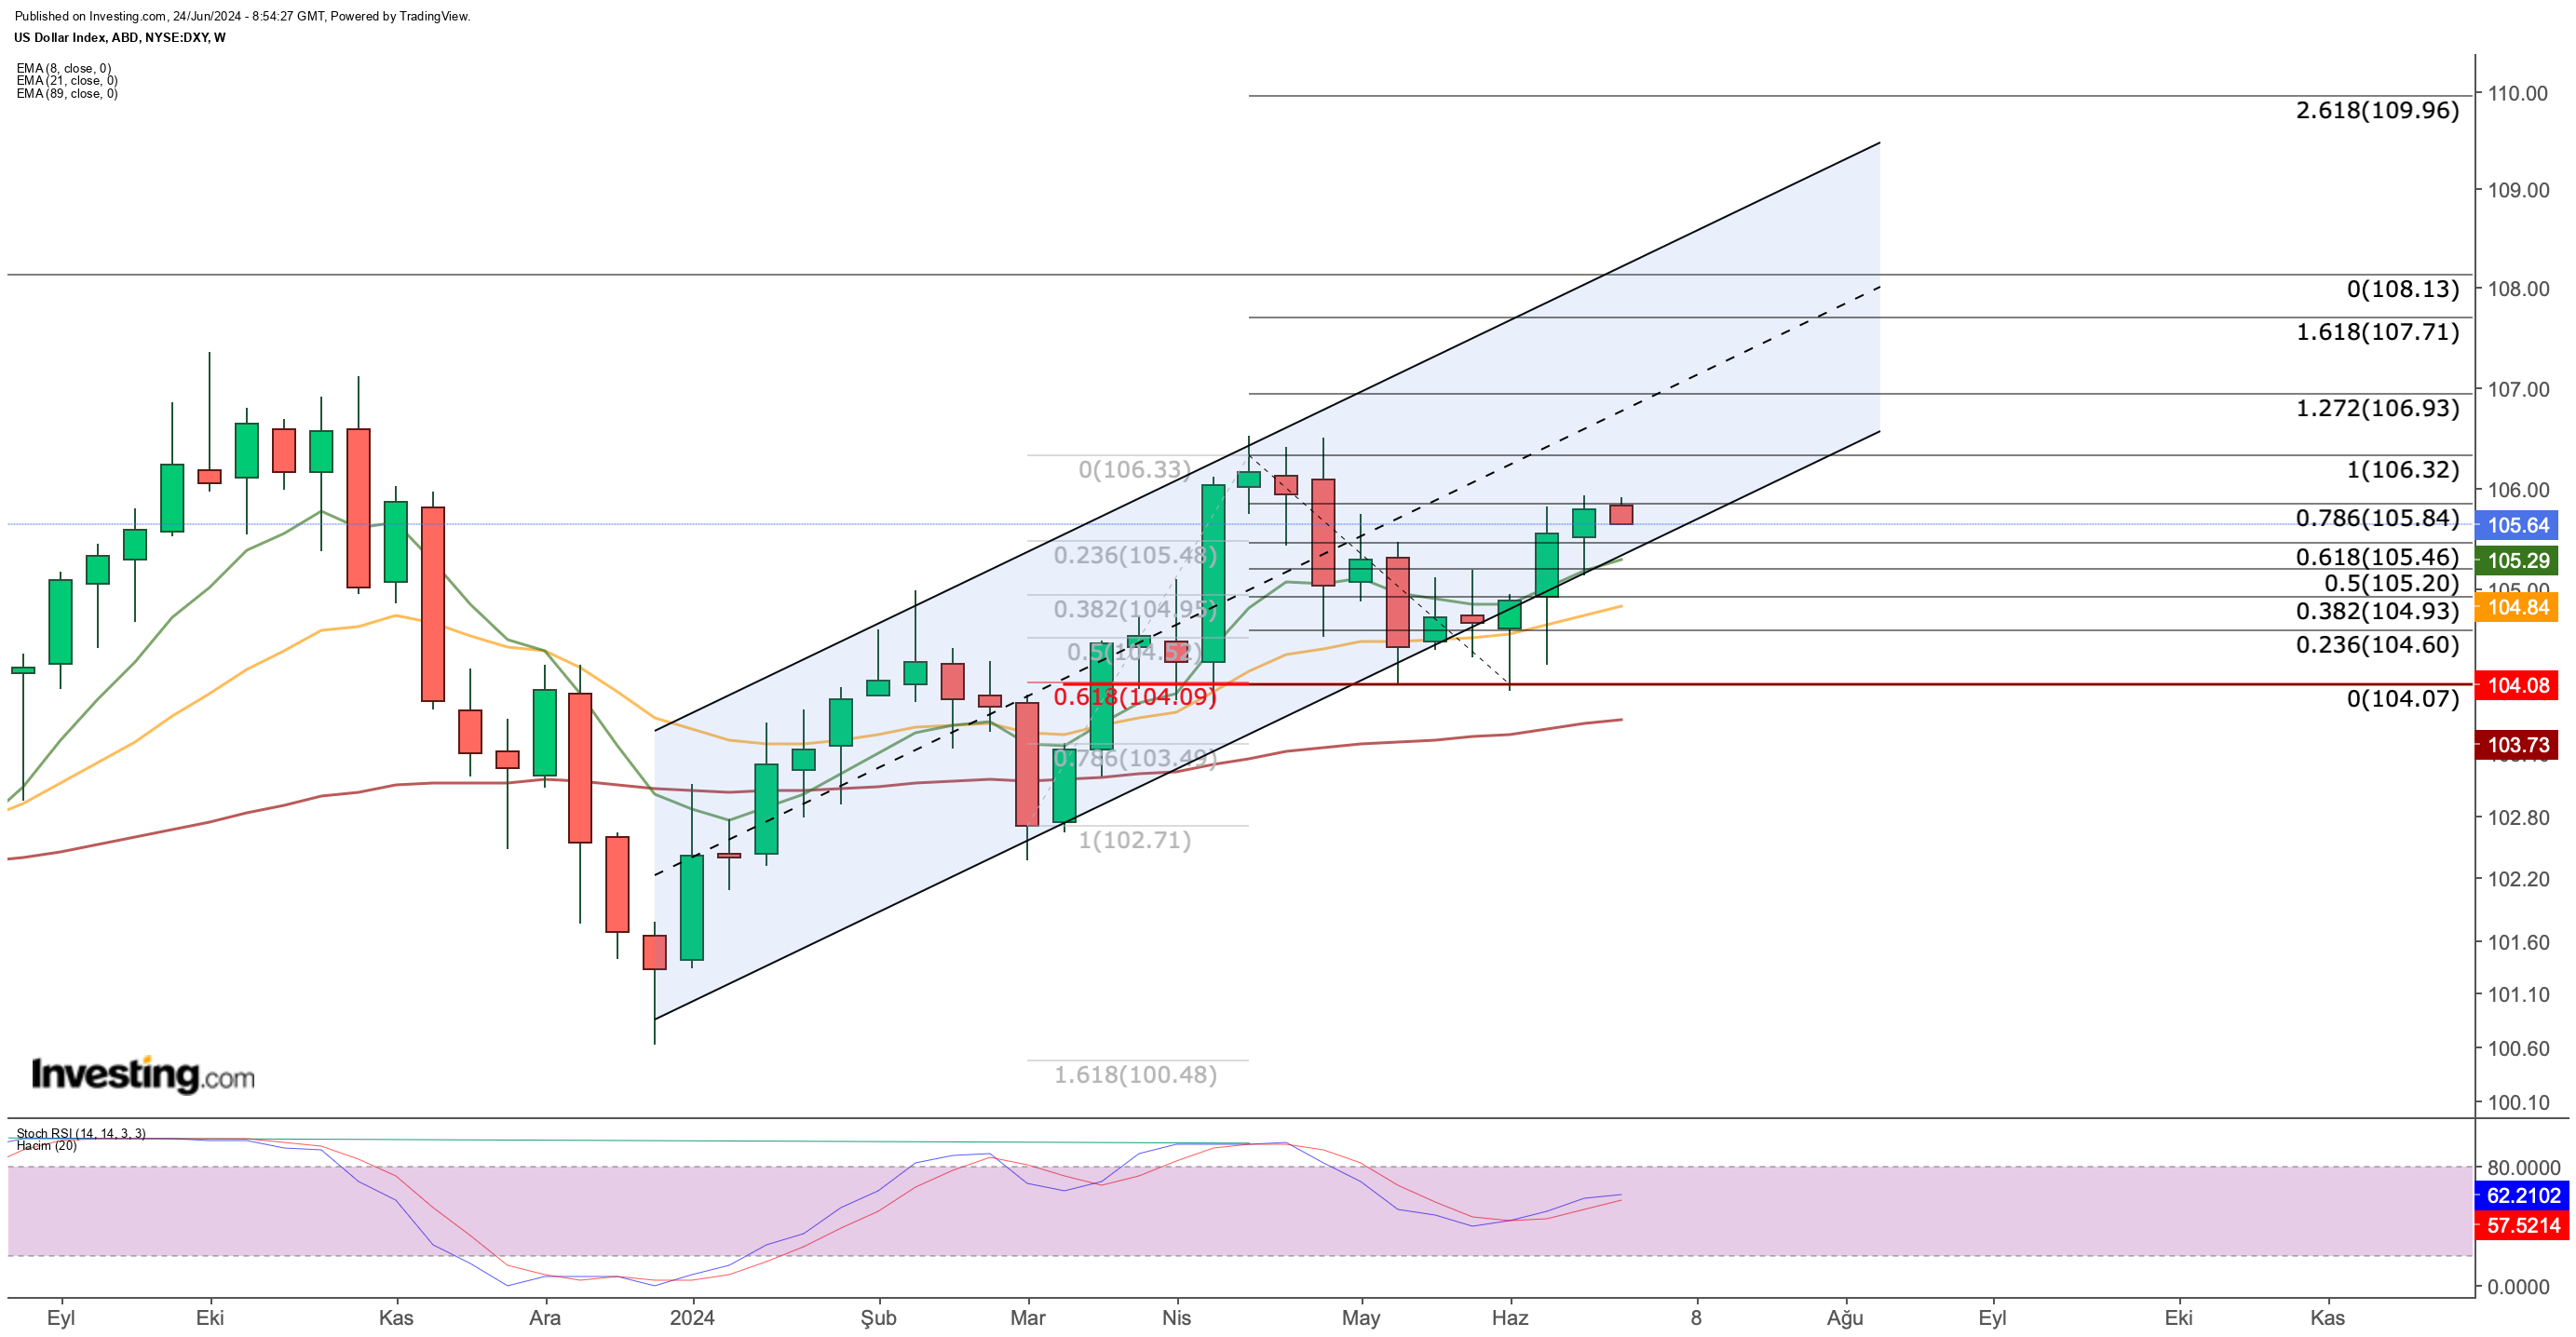
The US Dollar Index (DXY) kicked off the week with a decline, breaking a short-term upward trend. This week's focus will be on the 105.84 resistance level, which coincides with the Fibonacci 0.786 retracement of the April-May rally.
Despite the pullback, the dollar's positive outlook remains intact. A daily close above the second resistance point at 106.3 could send the DXY toward the 107 region, indicating continued dollar strength and dampened risk appetite.
However, if the DXY loses support at 105.3, it could signal a break below the rising channel that's been in place since the year's beginning. This scenario could trigger a pullback towards the 104 region, potentially fueled by dovish Fed rhetoric or weaker-than-expected PCE data.
Euro Eyes More Gains
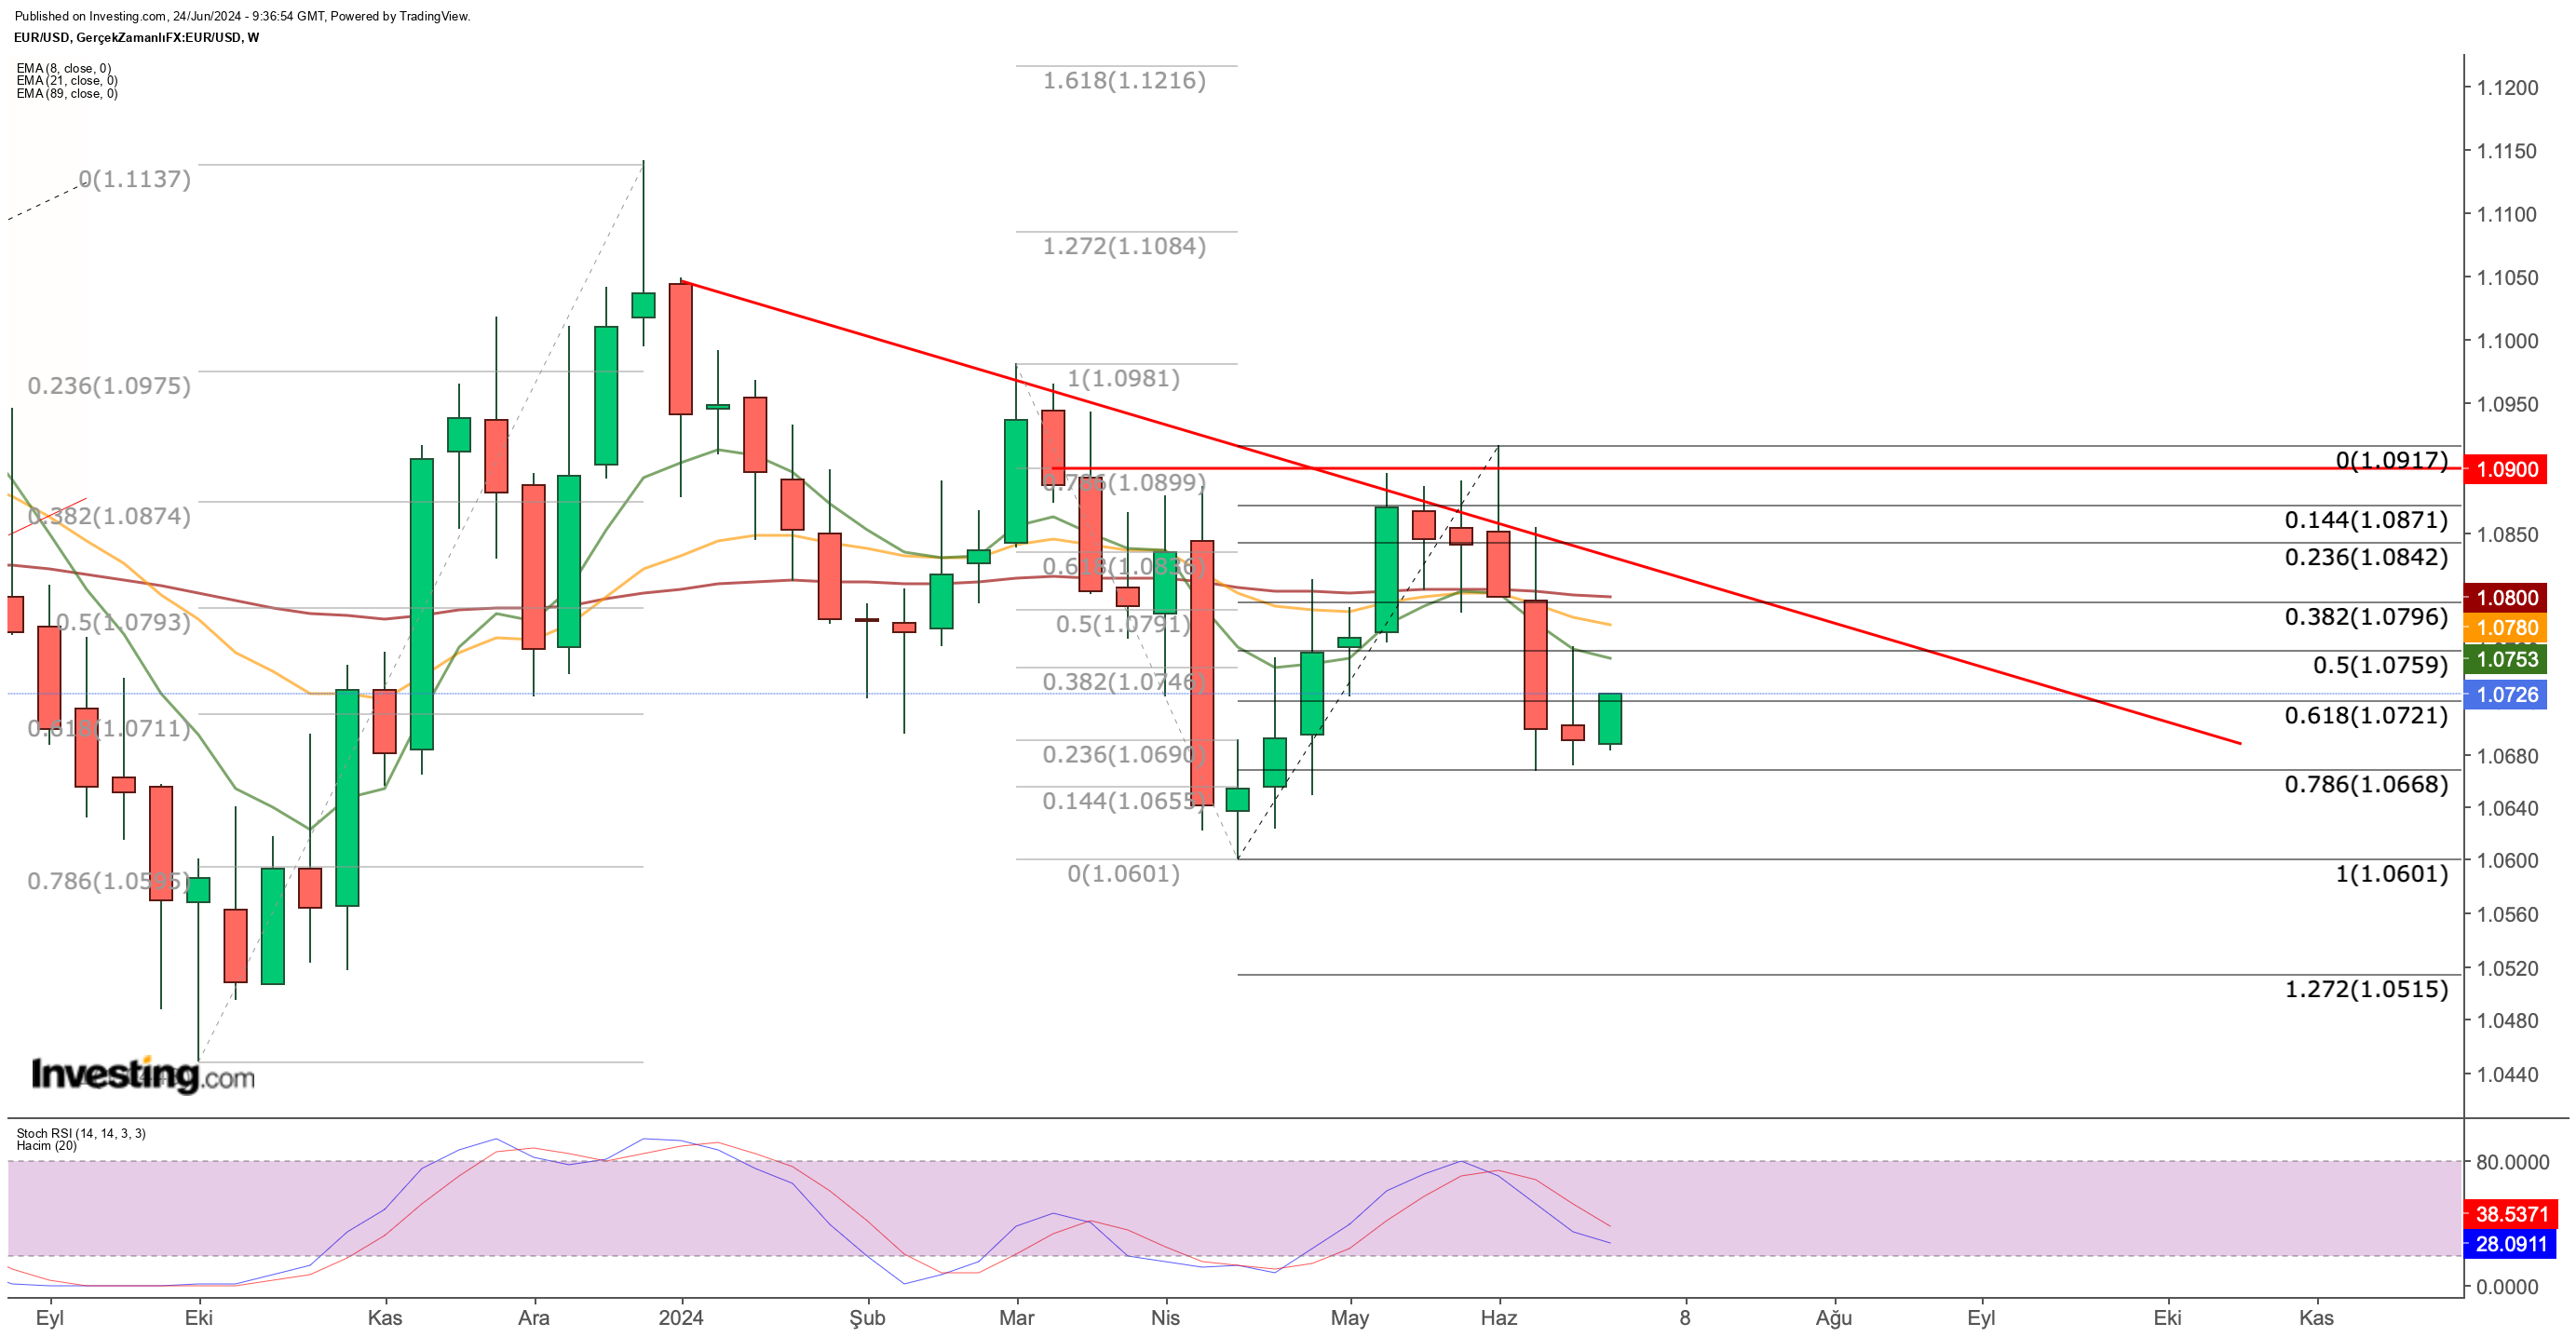
The euro staged a comeback this week after a rough June. Weakening economic data from Germany and France, coupled with European Central Bank (ECB) rate cuts, had pushed EUR/USD down to a low of 1.067.
Adding to the pressure, France's upcoming election injects uncertainty into the Eurozone's future. The winning candidate's policies could further weaken the euro.
However, the euro found support around 1.068 this week, clawing its way back to the 1.07 band. Technically, holding the 1.067 level by week's end was crucial to slow the downtrend. This price point coincides with the Fibonacci retracement level of 0.786, acting as a critical support zone.

For EUR/USD to continue its upward climb this week, the first hurdle to overcome is 1.072 (Fibonacci retracement of 0.618). However, for a sustained breakout above the downtrend and a stronger euro against the dollar, weekly closes need to be established in the 1.08 region. This would confirm EUR/USD trading above the 2024 downtrend line and short-term exponential moving averages (EMAs).
Despite the short-term uptick, the overall situation suggests this euro rally might not be long-lasting. In potential pullbacks, the euro could form a new bottom around 1.05.
Gold Awaits US Inflation Data Amidst Rate Cut Bets
Gold prices edged higher at the start of the week, buoyed by a dip in US Treasury yields. However, the metal's path forward remains heavily influenced by the upcoming US inflation data and the Federal Reserve's monetary policy stance.
With geopolitical tensions subdued, all eyes are on the US Federal Reserve's interest rate decisions. This week's inflation data release (Personal Consumption Expenditures data) and Fed officials' comments regarding interest rates and the US economy are critical events for gold investors. A lower-than-expected PCE reading could strengthen the case for two rate cuts this year, as anticipated by many market participants.

While the Fed has hinted at a potential rate cut in 2024, the market continues to push for two cuts to maintain pressure on the central bank. A lower PCE figure could be interpreted positively by investors, potentially boosting gold demand.
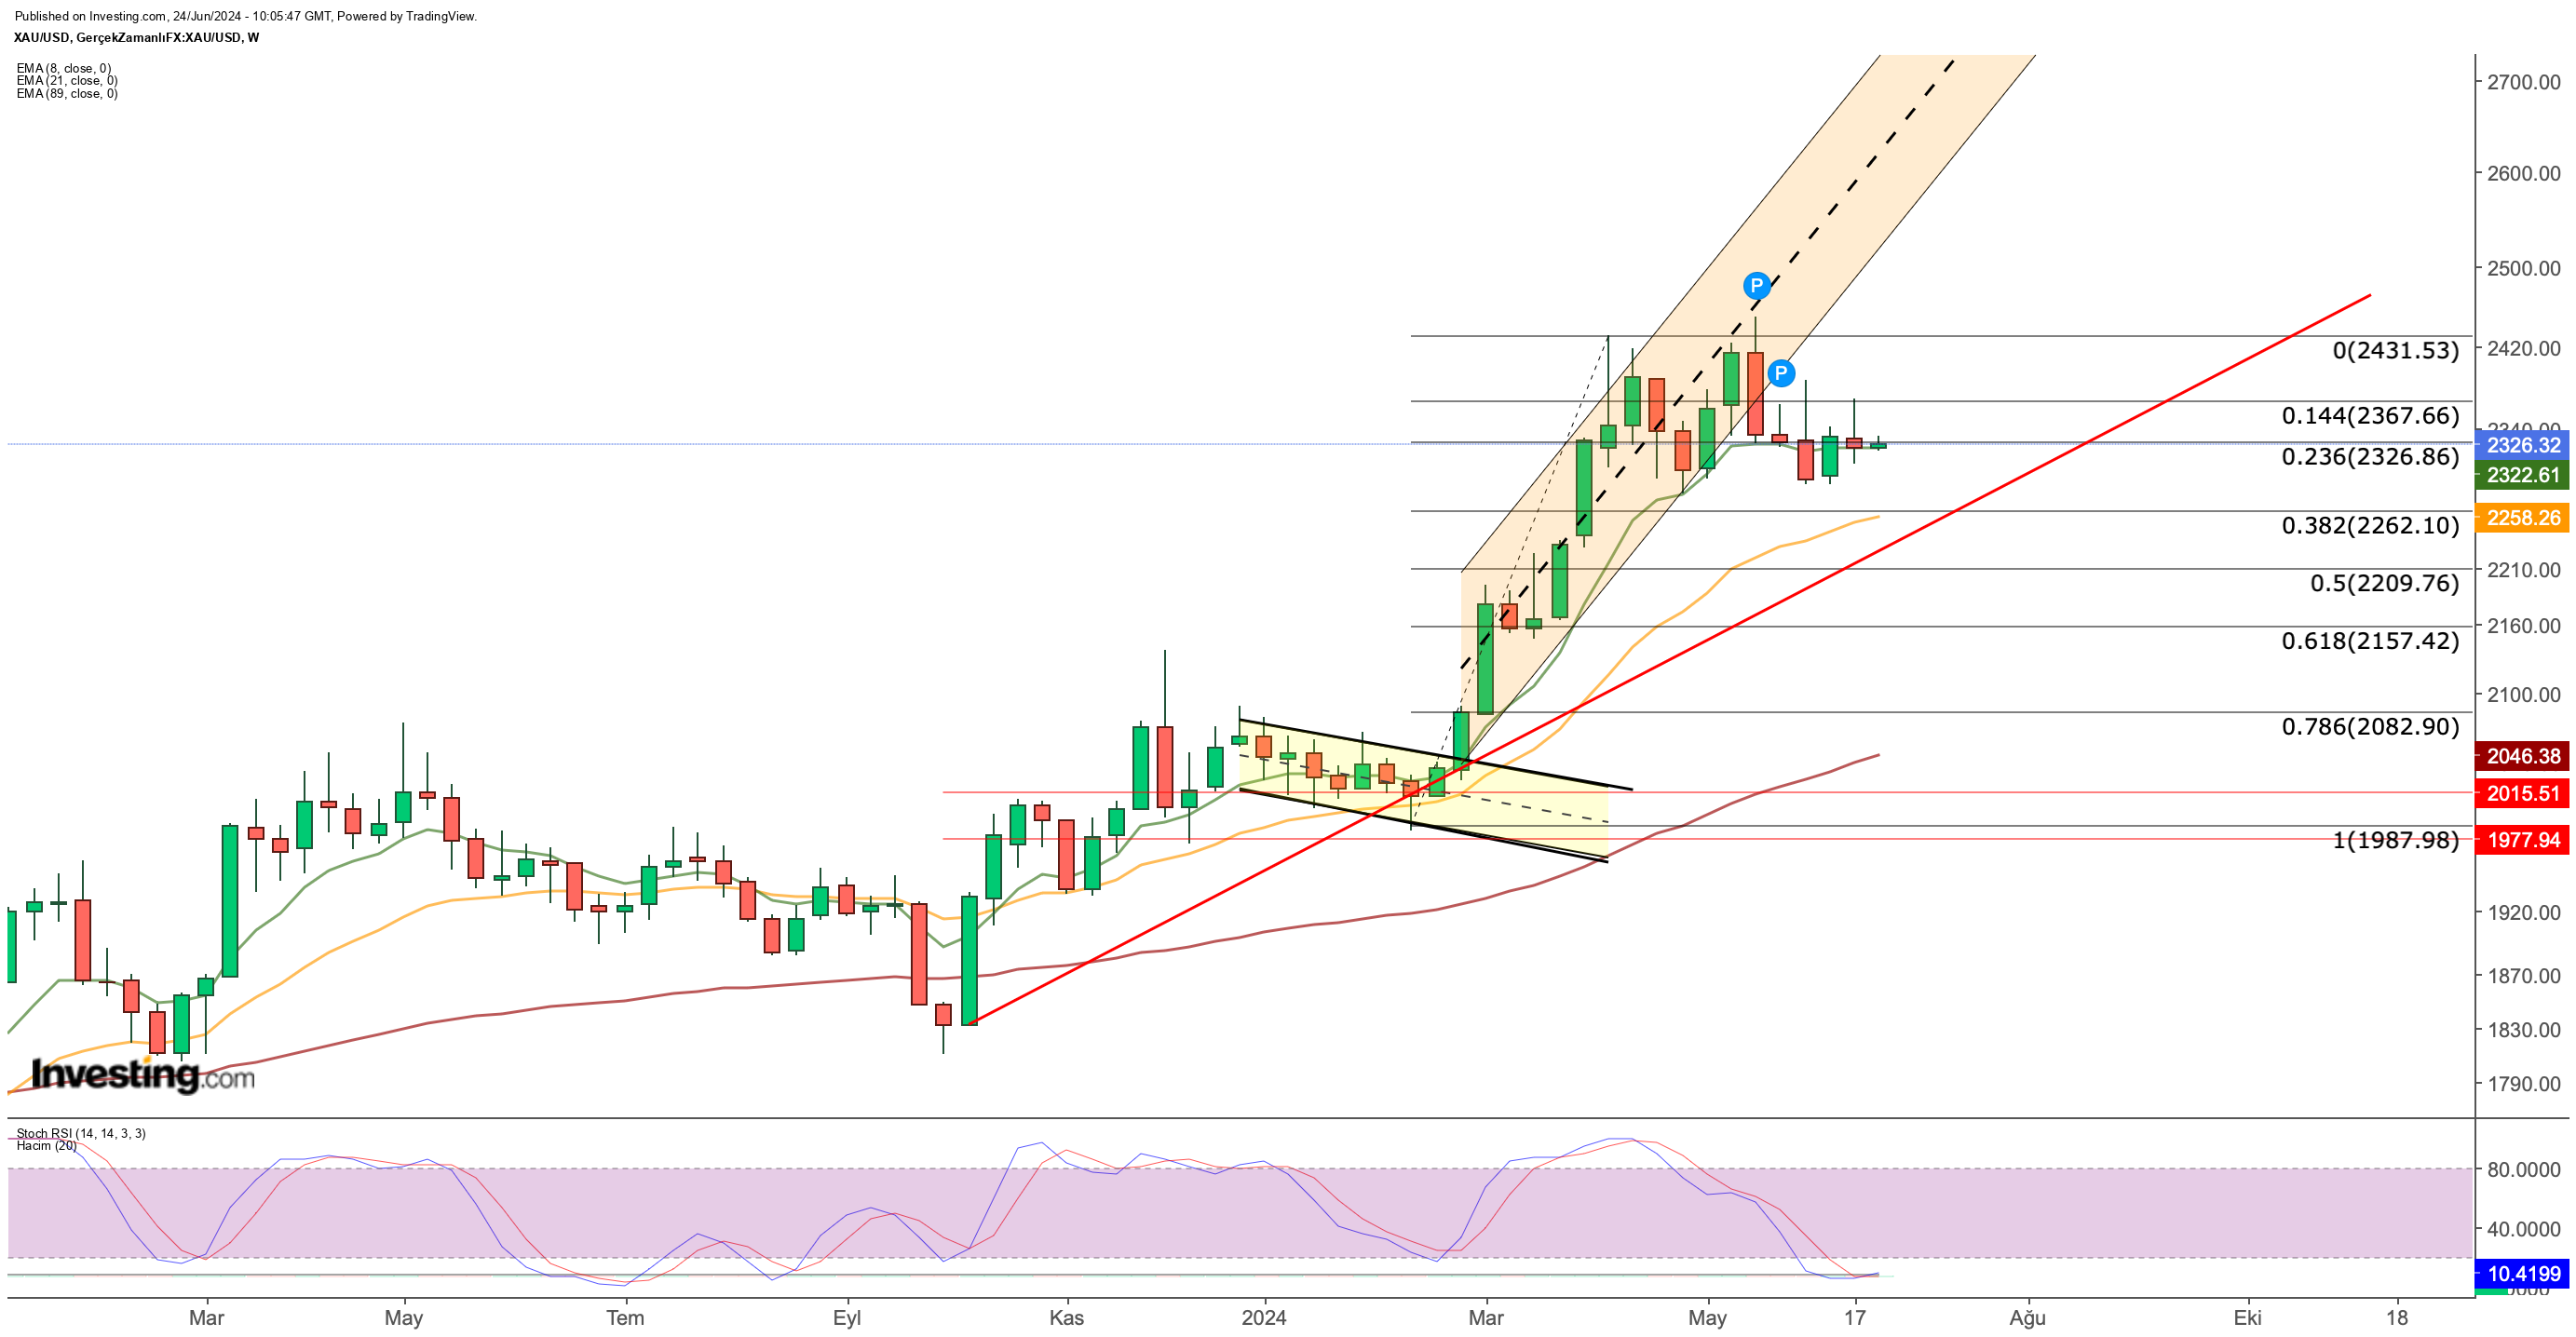
Technically, gold's price has been oscillating around the $2,300 level for the past month, establishing it as a key pivot point. Considering the metal's uptrend from February to May, the $2,320 level acts as a critical support line. A weekly close below this level could signal a breakdown of the current consolidation phase.
Conversely, if US economic data suggests a continued slowdown in inflation, it could entice investors back to gold, potentially sending the price towards the $2,360 resistance level and paving the way for a new uptrend.
***
Access first-hand market data, factors affecting stocks, and comprehensive analysis. Take advantage of this opportunity by visiting the link and unlocking the potential of InvestingPro to enhance your investment decisions.
And now, you can purchase the subscription at a fraction of the regular price. So, get ready to boost your investment strategy with our exclusive summer discounts!
Enjoy incredible discounts on our subscription plans as our annual subscription now costs less than $7 a month!
Don't miss this limited-time opportunity to access cutting-edge tools, real-time market analysis, and expert opinions.

Disclaimer: This article is written for informational purposes only; it does not constitute a solicitation, offer, advice, counsel or recommendation to invest as such it is not intended to incentivize the purchase of assets in any way. I would like to remind you that any type of asset, is evaluated from multiple perspectives and is highly risky and therefore, any investment decision and the associated risk remains with the investor.
