Top U.S. Defense Stocks to Watch According to Jefferies Analysis
After an avalanche of data last week, there are more signs of a slowing economy. Real GDP rose modestly in the first half, and inflation started to drift up. The labor market was the last piece to fall in line, and it did with a bang on Friday. Job growth slowed sharply starting in May (including large downward revisions in May and June), and the unemployment rate increased in July. It’s a complicated mix of supply and demand shocks, but an unsurprising outcome given the significant policy changes this year, including higher tariffs, less immigration, and downsizing the government. Changes in labor supply, as well as tension between the employment and inflation mandates, create challenges for the Fed.
Job Growth Has Slowed (Since the Spring)
The main takeaway from the employment report is that job growth has slowed considerably, and this slowdown began earlier than previously estimated. Before last Friday, job growth appeared to have held up well in May and June (the blue line), but with more data, those job gains were revised down sharply, and the increase in payrolls in July was modest (green line). The three-month average had been 150,000, and is now 35,000. That was a significant shift in the labor market data, but it aligns with other signs of economic slowdown.
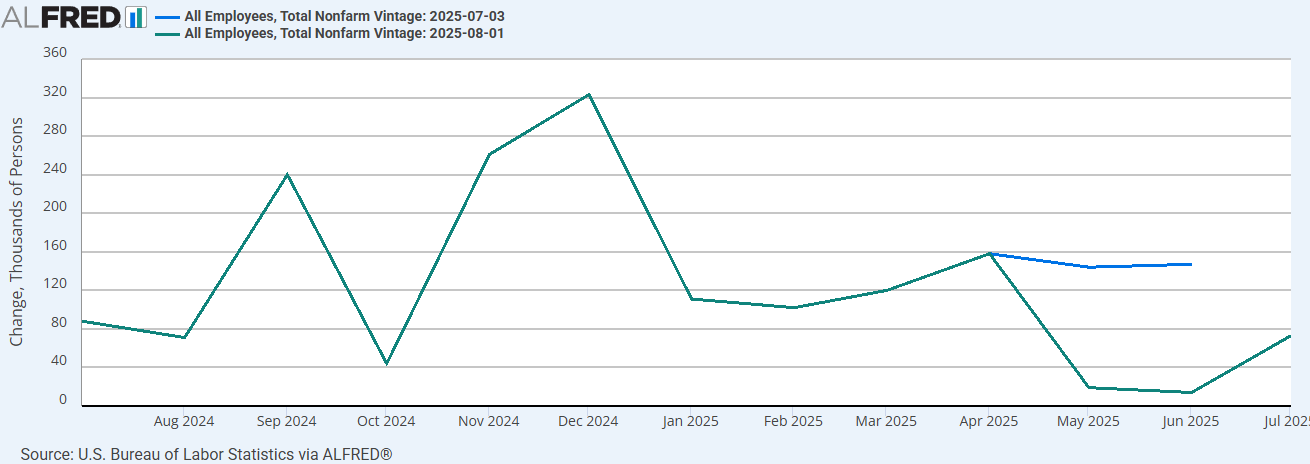 The primary task is to interpret this slower path for job growth. More on that below. However, the large revisions in May and June have raised several questions, and President Trump used them as a pretext to fire the Commissioner of the BLS.
This is a policy problem, not a measurement problem.
The problem is not the Bureau of Labor Statistics. Large, unpredictable shifts in economic policy are placing unusual strains on our measurement apparatus because they are causing large, unpredictable changes in the behavior of consumers and businesses. These changes are difficult to measure in real time. The GDP statistics this year have struggled to isolate massive swings in imported goods around the start of tariffs from its measure of domestic production. The initial estimates of payrolls didn’t capture the slowdown in employment, but that’s more a reflection of how sharp the jobs slowdown is, rather than a limitation of the surveys. Increasing staffing and budgets at statistical agencies would be a wise investment, according to the revisions.
The revisions were large, but not mysterious.
The two-month downward revision for May and June, at -258,000, was the largest since the pandemic. Although unusually large, these revisions followed the standard procedures: the BLS publishes its first estimate for a month on the first Friday of the next month. It revises that month’s estimate in the next two reports. There are two sources for these revisions: 1) data collections from businesses and government agencies that did not meet the deadline for the first estimate, and 2) updated seasonal factors based on the new data. Before 2003, seasonal factors remained unchanged at the monthly revisions. (There are later revisions at the annual benchmarks.)
Separating the latest revisions into the two sources, the June downward revision is primarily due to the collection of new data, while the May downward revision is primarily due to new seasonal factors. Note, the seasonal factors changed due to the additional collections for May and June, as well as the first collection for July.
 The June revision is the primary driver of the revisions. (It also influenced the revised seasonals in May.) The downward revision to payroll growth (as a percent change) in June is notable, but it is not historic. Even larger revisions from the first to the second estimate were common before 1990. On average, the revisions have gotten smaller over time. Larger revisions now tend to occur in times of transition in the labor market, such as recessions or early recoveries.
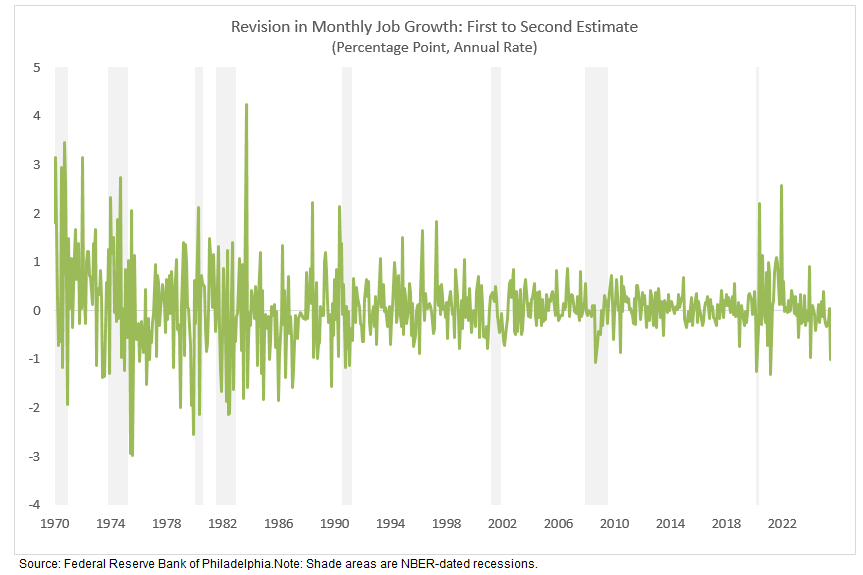 Note that level revisions, such as the -258,000 revision across May and June, are not suitable for historical comparisons. Nonfarm employment has risen over time—it is now 159 million, which is 2.2 times larger than its level in 1970. Additionally, the two-month revision in levels or percentages before 2003 is not comparable. The re-estimation of the seasonal factors was central to the May revision; prior to the BLS’s switch to concurrent seasonal adjustment in 2003, this would not have occurred. (Here’s an analysis from BLS as to why they switched procedures.)
The June downward revision is not mysterious. Nearly half of the revision came from state and local education. The increase in those employment series in the first estimate last month had been puzzling, given the end of federal COVID-era funding for schools and news reports of hiring freezes at universities over federal funding concerns, and some expected a revision. The remaining June revisions originated from the private sector. The first estimates of private-sector employment in June already showed a step down from May. It was the slowing that the Fed Governor Waller cited in his dissent at the FOMC meeting on Wednesday. The revisions last week reinforced that slowing. They were broad-based across industries and fit the pattern of large revisions at turning points, not a measurement problem.
Slowing Job Growth Reflects More Than Weaker Demand
Job growth has slowed markedly, but the source of the slowdown is crucial for judging whether it is a sign of cyclical weakness in the labor market and whether the Fed should lower interest rates in response.
If the slowing job growth is primarily due to factors like heightened uncertainty or slowing sales that reduce businesses’ demand for workers, that would also push up the unemployment rate and lower wage growth and hours. Those are signs of slack or cyclical weakness in the labor market, since the available workers are not being fully utilized. In that case, lower interest rates could boost demand and reduce the slack.
If, instead, the slowing job growth is primarily due to factors such as reduced immigration or population aging that reduce the supply of workers, the effects on the unemployment rate, wages, and hours would be reversed. The reduction in the supply of workers decreases the slack in the labor market because it lowers the level of maximum (or potential) employment. The lower job growth is not a sign of cyclical weakness. Lower interest rates that boost demand can lead to labor shortages and higher inflation.
Currently, the data suggest that reduced labor supply is likely the key driver though reduced demand is playing a role and the risk of cyclical weakening in the labor market have risen.
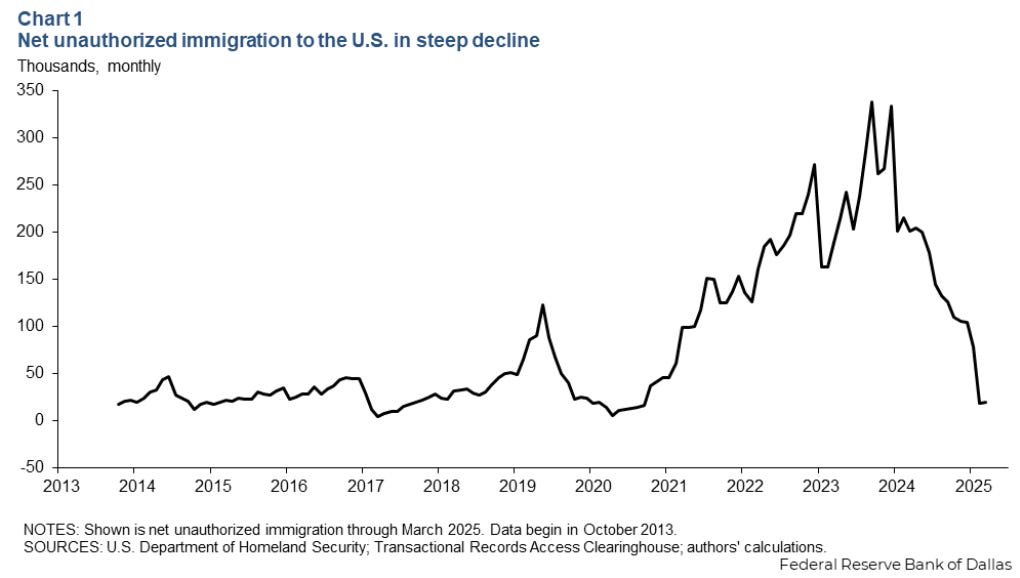
Unauthorized immigration into the US surged after the pandemic and was an important source of additional labor supply. (Chart is from researchers at the Dallas Fed.) Humanitarian programs offered a temporary legal status and work authorization. Starting in the middle of last year, net unauthorized immigration dropped sharply under the Biden administration. The Trump administration further tightened immigration enforcement and prioritized deportations.
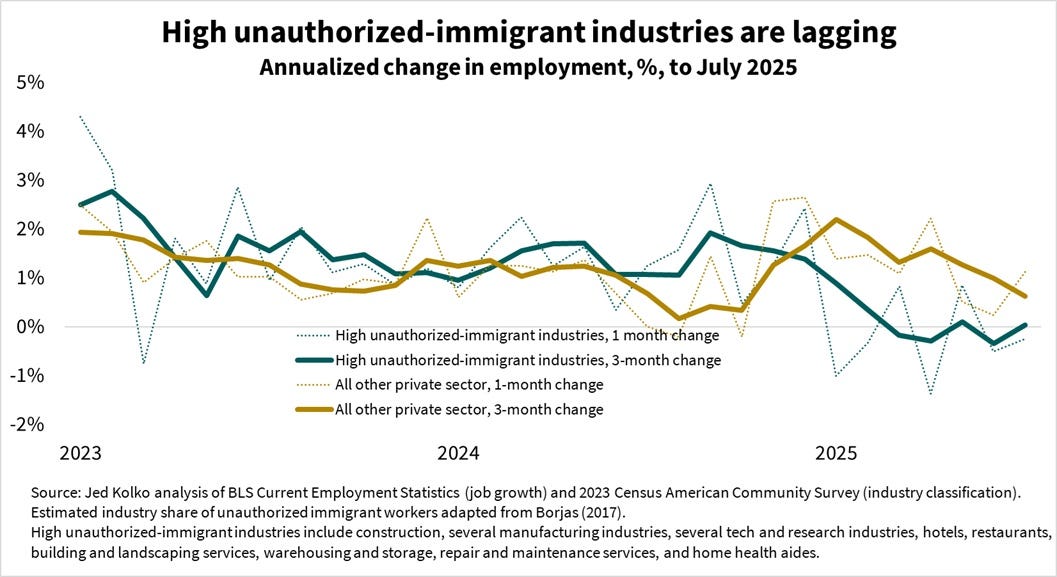
The employment statistics are broadly consistent with the reduction in immigrant labor supply. Job growth has slowed more this year in industries that have a higher fraction of unauthorized immigrants like construction and restaurants, according to analysis by Jed Kolko at the Petersen Institute. The slowing in other industries has been more gradual.
 The unemployment rate and wage growth has been also broadly consistent with labor supply as a key driver. The unemployment rate rose in July, but it was steady in May and decreased in June. If the sharp slowdown in job growth since May were due only to deteriorating demand, one would have expected the unemployment rate to rise over this period. But, a slower-growing labor force requires fewer jobs to keep unemployment steady and can blunt the effect of weakening demand for labor on the unemployment rate, at least initially.
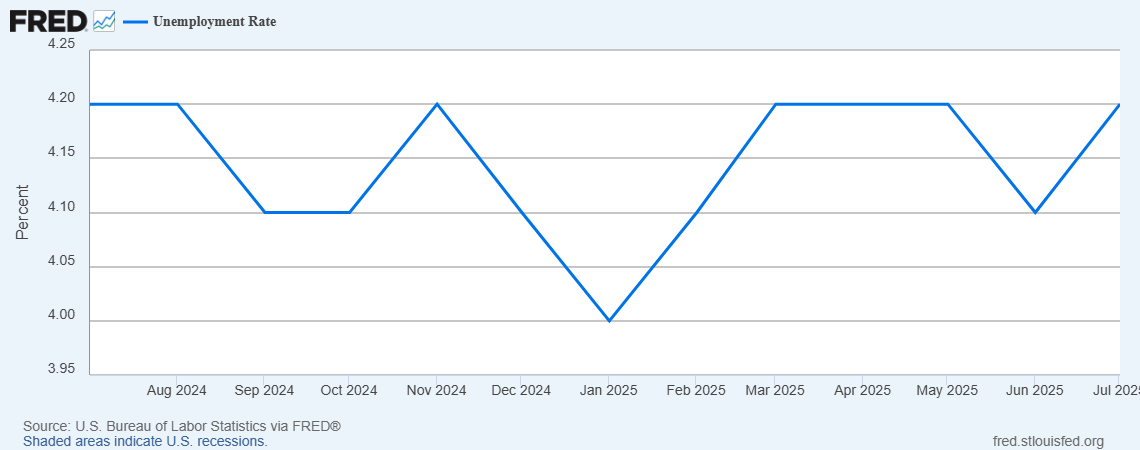 The stability of the unemployment rate masks effects of the low-hiring, low-firing labor market. The share of the unemployed who were permanently laid off has moved down in recent months, while the share who are new entrants to the labor force has edged up. Likewise, initial unemployment insurance claims have moved down since the start of June. These are not typical patterns of a deteriorating demand for labor.
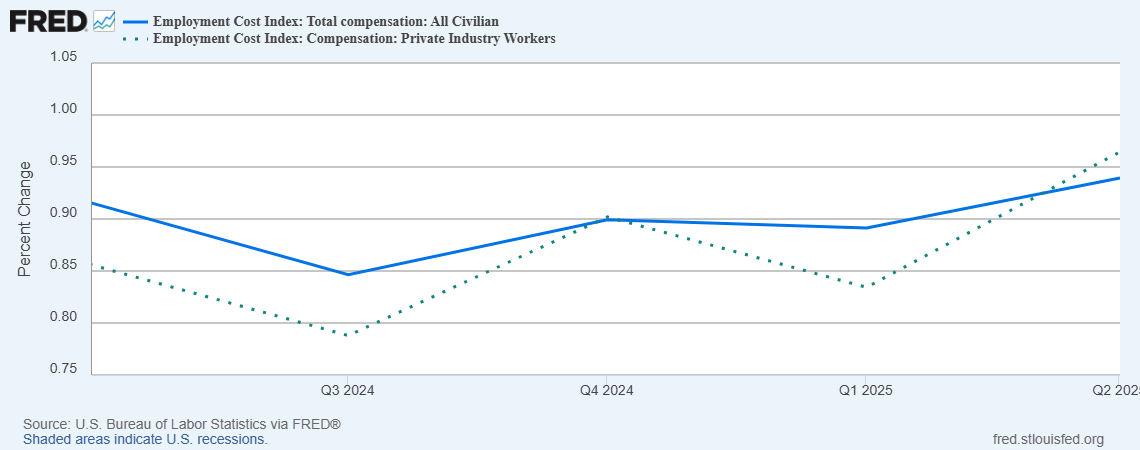
Wage growth has also remained firm. The Employment Cost Index, the Fed’s preferred measure of changes in hourly compensation picked up modestly in the second quarter for all workers and private-industry workers. If the slower job growth primarily reflected weakening labor demand, it would likely have depressed wage growth. Slower growth in labor supply, instead exerts upward pressure on wages.
Slower jobs growth is not only about labor supply. There are factors likely reducing the demand for labor, such as uncertainty about tariffs and other government policies, pessimism among consumers and businesses, modestly restrictive interest rates, and some slowing in consumer spending growth. I emphasize supply factors here to challenge the typical interpretation of three months of average job gains at 35,000 as a cyclically weak labor market.
The reaction to the employment report has varied among Fed officials. John Williams, New York Fed President, said on Friday after the employment report noted the large downward revisions, and said it’s important “to understand the direction of what we’re seeing in supply and demand for labor.” Looking across various data, he argued that, “What we’re seeing I would describe over the past year as a gentle gradual cooling of the labor market, but still leaving it in a still solid place.”
Mary Daly, the San Francisco Fed President, (nonvoting) said the “job market is not precariously weak, but it is softening and further softening would be unwelcome.” She also suggested that two cuts might not be enough this year. Both Williams and Daly emphasized the data from now until the September meeting will be important.
